 🏷️ Likely Rental
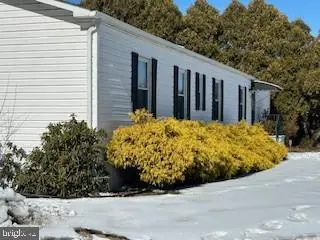
1887 Delsea Dr #80 · Vineland, NJ
Flood risk No data
- FEMA flood zone
- —
- Chance of flooding over 30 yrs
- —
- Est. flood insurance / yr
- —
Fire risk No data
- Est. fire insurance / yr
- —
Heat risk No data
- Hot days now (above threshold)
- —
- Hot days in 30 yrs
- —
Wind risk No data
- Chance of severe wind over 30 yrs
- —
Air-quality risk No data
- Unhealthy air days now
- —
- Unhealthy air days in 30 yrs
- —
Risk factors via First Street. Map © Google.
Why this score? — see what drove the B- grade
The composite is a weighted blend of 9 inputs, each scored 0–100. Each bar is that input's sub-score; the figure is the points it added to the 100-point composite (weight × sub-score).
- Cash flow +30.0/30.0
- 1% rule +10.0/10.0
- DSCR +10.0/10.0
- ARV discount +7.5/15.0
- Livability +3.3/5.0
- Rent growth +2.5/5.0
- Condition / age +2.2/5.0
- Schools +1.9/10.0
- Appreciation +0.0/10.0
$75,000
🖨 Deal sheet 📄 Offer letter ✓ Due diligence
Listing remarks
This home has a screened porch, living room, kitchen, laundry area, 2 bedrooms and 2 bathrooms. Located in Little Flower's Park. The lot rent is $820 per month. Located close to local amenities.
Key facts
- Laundry area
- Kitchen
- Living room
Tags
Property features AI
Finance
- Financial info: Annual ground rent noted
- HOA & community: Ground rent exists; Monthly land lease payment of $820; Approximately 100 years of land lease remaining
Exterior
- Parking: Driveway parking (1 space); 1 total garage/parking space reported
- Utilities: Water source: Other; Electric for cooling and hot water
- Home design: Manufactured home; Land lease ownership
- Construction: Above-grade construction
- Exterior features: Other above-grade structures
Interior
- Kitchen: Kitchen (appliances not specified)
- Bedrooms: 2 bedrooms on the main level
- Bathrooms: 2 full bathrooms on the main level
- Heating & cooling: Forced air heating (oil); Central air conditioning (electric); Electric hot water
- Interior features: Living room; Kitchen; No basement
- Laundry & utility: Laundry on the main floor
Neighborhood map
What this means for you Summary
Snapshot
- This is a 2-bed/2.0-bath single-family listed at $75k. Condition is rated fair.
Deal economics
- At list price, monthly cash flow is $814 ($10k/yr) — positive.
- The deal already cash-flows at list — no discount required.
- Meets the 1% rule at list price ($2k rent vs $75k).
- Recommended offer: $68k (9.0% below list) — sets the bar for market timing.
- Cap rate 19.3% vs local median 4.5% in Vineland — top-decile yield for the area; either an underpriced asset or a hidden risk that comps aren't pricing in. Stress-test before assuming the spread holds.
Location & tenants
- Location reads 66/100 on livability (#363 in NJ) — a middle-class / working-renter tenant base. Strengths: housing A+, health & safety A+; Watch: employment D+, schools D, crime F.
- Vineland Public School District (urban): math 9% / reading 34% proficiency, ranked #418 of 472 in NJ (top 89%) — low school quality limits family demand, transient renter base, plan for 1-2y turnover.
- Market conditions: 173 active listings in the ZIP; 216 units permitted in Cumberland County in 2024 (73 in 5+ unit buildings).
- This rent runs 31% of the median local income ($65k/yr) — at the standard rent-burdened threshold; future hikes will face affordability resistance.
Forward outlook
- Local home prices are declining (-3.0%/yr); year-one equity from $519 of loan paydown is wiped out by about $2k of value loss. Plan a longer hold.
- Cumberland County population projected to shrink 7% by 2050 — rents likely to lag national; underwrite the cash flow, not the appreciation.
- At projected returns (-3.0% appreciation + 3.0% rent growth), your $21k cash investment doubles in ~3 years — after that, you're playing with house money.
Negotiation context
- It's been on market 98 days — a 9% lower offer ($68k) is reasonable based on typical stale-listing flexibility.
Questions for the listing agent
- It's been on market 98 days. Have you received any prior offers? Is the seller open to a 9% concession, seller financing, or rate buy-down credit?
- Have any recent inspections been done? Can we get a copy of the seller's disclosures and any deferred-maintenance estimates?
- Why hasn't it sold? Are there any deal-killer items the seller is aware of (foundation, flood, title, zoning, code violations)?
- Is there a deadline driving the sale (1031 exchange, divorce, estate, relocation)? That informs how much negotiation room exists.
- Schools are D-rated, which usually means shorter tenancies and higher turnover. Who's the typical renter profile here, and what's been the actual vacancy rate?
- Crime grade is F in this area — have there been break-ins, vandalism, or insurance claims at this property in the last 3 years? What carrier currently insures it and at what premium?
- What's the average days-on-market for RENTAL listings here right now (not sales)? A rising rental-DOM trend means longer vacancies and softer asking-rent achievability than the comps imply.
- What's the recent tenant-quality profile in this submarket — average credit score on applications, eviction rate, late-payment / NSF rate, and stable-employment percentage? A property-management company in the area should have these aggregated.
- How much new for-sale + rental construction is in the pipeline within 1–3 miles? Heavy new supply typically softens prices + rents 12–24 months out; constrained supply supports both.
Investment metrics
- 1% rule
- 2.25% ✓
- Cap rate
- 19.32%
- Cash-on-cash
- 46.53%
- DSCR
- 3.07
- GRM
- 3.7
CMA / ARV
- ARV (on-the-fly)
- $259,700
- Comps found
- 4
Show comp detail 4 sales within ~0.75 mi
| Address | Dist | Beds/Ba | Sqft | Sold | Price | $/sf | Match |
|---|---|---|---|---|---|---|---|
| 1887 N Delsea Dr Unit 147 HOLLYHOCK DR | 0.03mi | 3/2.0 (+1) | 1,100 (+12%) | 11mo | $106,000 | $96 | 64 |
| 663 Wayne Ave | 0.55mi | 3/1.0 (+1) | 1,056 (+8%) | 6mo | $329,900 | $312 | 48 |
| 1227 W Wheat Rd | 0.64mi | 3/1.0 (+1) | 880 (-10%) | 14mo | $233,450 | $265 | 33 |
| 1206 W Wheat Rd | 0.60mi | 2/1.0 | 1,108 (+13%) | 20mo | $260,000 | $235 | 30 |
Match score weights: distance 35% · size 25% · config 20% · recency 20%. Top-matched comps best support the ARV.
Projected returns pro-forma
-3.0% appreciation · 3.0% rent growth · sell at horizon
- IRR
- 43.8%
- Equity multiple
- 2.89×
- Total profit
- $39,731
- Equity at exit
- $11,183
- IRR
- 49.8%
- Equity multiple
- 5.83×
- Total profit
- $101,476
- Equity at exit
- $6,485
Cash invested: $21,000 (down + closing). Projections, not guarantees.
Landlord ↔ Tenant lean methodology
- Overall (STATE)
- 21 Tenant-Leaning
- State New Jersey
- 21 Tenant-Leaning · D+6
- County
- — inherits STATE
- City
- — inherits STATE
ZIP-level market 08360
- Active inventory
- 173
- Price-to-rent
- 3.7×
Monthly cashflow live
- Estimated rent
- $1,687 medium interval (Pro) →
- Mortgage (P&I)
- −$393
- Tax est. 1.5%
- −$94 /mo · $1,125/yr
- Insurance
- −$31
- HOA
- −$0
- Vacancy / Maint / Mgmt
- −$354
- Net cashflow
- $814
Break-even live
UW: 25.0% down · 7.5% · 30yr · 1.5% tax · 5.0% vac · 8.0% maint · 8.0% mgmt
Financing live
Cash to close
- Down payment
- $18,750
- Closing costs
- $2,250
- Reserves months
- —
- Total cash needed
- —
Loan-product check · same deal, 3 products live
Conventional
25% down · 7.5% · 30yr
- Down + closing
- —
- Monthly P&I
- —
- Monthly cashflow
- —
- DSCR
- —
- Eligible?
- —
Personal DTI + credit; lowest rate.
DSCR
20% down · 8.5% · 30yr
- Down + closing
- —
- Monthly P&I
- —
- Monthly cashflow
- —
- DSCR
- —
- Eligible?
- —
No personal income docs; deal must DSCR.
Hard money
10% down · 12.0% · 12mo
- Down + closing
- —
- Monthly P&I
- —
- Monthly cashflow
- —
- DSCR
- —
- Eligible?
- —
Short-term bridge; refi at stabilization.
Listing history 17 events
-
2026-06-19days on market $75,000 Active 98 DOM
-
2026-06-18days on market $75,000 Active 97 DOM
-
2026-06-17days on market $75,000 Active 96 DOM
-
2026-06-16days on market $75,000 Active 95 DOM
-
2026-06-15days on market $75,000 Active 94 DOM
-
2026-06-14days on market $75,000 Active 92 DOM
-
2026-06-13days on market $75,000 Active 91 DOM
-
2026-06-10days on market $75,000 Active 89 DOM
-
2026-06-09days on market $75,000 Active 88 DOM
-
2026-06-08days on market $75,000 Active 87 DOM
-
2026-06-07days on market $75,000 Active 86 DOM
-
2026-06-03days on market $75,000 Active 82 DOM
-
2026-06-02days on market $75,000 Active 81 DOM
-
2026-06-01days on market $75,000 Active 80 DOM
-
2026-05-31days on market $75,000 Active 79 DOM
-
2026-05-30days on market $75,000 Active 78 DOM
-
2026-03-13$75,000 Active
ⓘ Source: listings_history table (triggers on properties + properties_extension) + one-shot
backfill from property_details.listing_events for pre-trigger history.
Nearby sold comps map
Loading sold comps map…
Walkable amenities ~0.75 mi
Loading nearby amenities…
Taxation est. · year 1
- Rental income
- $20,241
- − Mortgage interest
- −$4,201
- − Property taxes
- −$1,125
- − Insurance
- −$375
- − Repairs & maintenance
- −$1,619
- − Management
- −$1,619
- − Depreciation
- −$2,182
- Taxable income
- $9,119
- Est. tax owed @ 24.0%
- −$2,189
- After-tax cash flow
- $7,582/yr
For passive investors: Depreciation is non-cash, so a rental often shows a tax loss while cash-flowing — sheltering income. Rental losses are passive: they offset passive income freely, and up to $25,000/yr can offset ordinary (W-2) income if you actively participate and your MAGI is under $100k (phasing out to $0 by $150k); unused losses carry forward. On sale, claimed depreciation is recaptured at up to 25%, and gains may owe capital-gains tax (a 1031 exchange can defer both). Figures are a year-1 estimate at your 24.0% rate — not tax advice; consult a CPA.
Condition & rehab AI · 13 photos
This home requires significant repairs and updates, including a new roof, flooring, and interior walls, as well as replacing outdated fixtures. These improvements will significantly increase its value and make it more attractive to buyers and renters.
Repairs flagged
- Major roof — The satellite image suggests water damage, indicating a major repair is needed.
- Major flooring — The carpet is visibly stained and worn, requiring replacement.
- Major interior walls — The wallpaper is peeling, indicating a major repair is needed.
- Major bathrooms — The fixtures are outdated and in poor condition, requiring replacement.
- Major HVAC system — The satellite image suggests the condenser unit may be in poor condition, indicating a major repair is needed.
Value-add opportunities
- Both replace roof — A new roof will significantly increase the home's value and make it more attractive to buyers and renters.
- Both replace flooring — New flooring will improve the home's appearance and increase its value.
- Both paint interior walls — Fresh paint will improve the home's appearance and increase its value.
- Both replace bathroom fixtures — Up-to-date fixtures will make the home more attractive to buyers and renters.
Renovation cost estimate screening
| Repair item | Severity | Est. cost |
|---|---|---|
| roof · The satellite image suggests water damage, indicating a major repair is needed. | Major | $15,000–50,000 |
| flooring · The carpet is visibly stained and worn, requiring replacement. | Major | $15,000–50,000 |
| interior walls · The wallpaper is peeling, indicating a major repair is needed. | Major | $15,000–50,000 |
| bathrooms · The fixtures are outdated and in poor condition, requiring replacement. | Major | $15,000–50,000 |
| HVAC system · The satellite image suggests the condenser unit may be in poor condition, indicating a major repair is needed. | Major | $15,000–50,000 |
| Total estimated repair cost · 5 items | $75,000–250,000 |
Value-add ROI direction
- Both replace roof — A new roof will significantly increase the home's value and make it more attractive to buyers and renters. ↑
- Both replace flooring — New flooring will improve the home's appearance and increase its value. ↑
- Both paint interior walls — Fresh paint will improve the home's appearance and increase its value. ↑
- Both replace bathroom fixtures — Up-to-date fixtures will make the home more attractive to buyers and renters. ↑
ⓘ Cost ranges are severity-bucket heuristics (US national rule-of-thumb). Get contractor quotes + a written scope before underwriting a rehab budget.
Schools (NCES district)
- District
- Vineland Public School District
- NCES district ID
- 3416800
- Math proficiency
- 9% ▼ -17.00%
- Reading proficiency
- 34% ▬ 0.00%
- Median HH income
- $51,168
- Composite
- 19.17/100
- National rank
- #8819
- State rank
- #418 of 472 in NJ
Livability — Vineland
- Score
- 66/100
- State rank
- #363
- US rank
- #12180
Category grades
Schools grade is shown separately in the Schools card above.
Census & demographics
- Census place
- Vineland, NJ
- County
- Cumberland County · 80,266 people
- City population
- 45,038
- Metro
- Vineland-Bridgeton, NJ
- Population (ZIP)
- 45,038
- Household income
- $65,359
- Rent vs Own
- Severe rent burden
- 1328.0
Population outlook (Cumberland County) Hauer SSP2
- Today (2025)
- 152,743 people
- By 2030
- 150,373 · -1.6%
- By 2040
- 146,881 · -3.8%
- By 2050
- 142,653 · -6.6%
- By 2075
- 129,468 · -15.2%
- By 2100
- 107,456 · -29.6%
Race, ethnicity, and origin ACS 2023
- Neighborhood character
- Diverse neighborhood (Simpson 0.62)
- Race & ethnicity
- Hispanic / Latino 51% White 32% Two or more races 17% Black 11% Asian 1%
- Hispanic origin (detail)
- Mexican 11% Puerto Rican 33% Dominican 2%
- Common ancestry
- Romanian 2% Subsaharan African 1% Scotch-Irish 1%
- Foreign-born
- 14% · Canada, Jamaica
- Languages at home
- 59% English-only · Spanish 37% Russian/Polish/Slavic 2% Other Indo-European 1%
Political lean MEDSL · Cumberland
- 2024 margin
- Toss-up / Even · D 47.6% · R 51.3% · Other 1.1%
- 2008→2024 swing
- -25.4pp toward R · 2008: 21.6pp · 2024: -3.8pp
- All cycles
- 2024: R+3.8 2020: D+6.0 2016: D+5.3 2012: D+23.1 2008: D+21.6
Not yet ingested
- Civics
- —
Market trends
- HPI YoY
- ▼ -320.06%
- Current HPI
- 278.786
- Rent YoY
- —
- Metro
- Vineland-Bridgeton, NJ
- State GDP YoY
- ▲ 2.05%
- F500 in state
- 34
Industry mix (Fortune 500 HQ in NJ)
| Industry | F500 HQs | Revenue |
|---|---|---|
| Consumer Goods | 3 | $31B |
|
||
| Pharmaceuticals | 2 | $153B |
|
||
| Technology | 2 | $21B |
|
||
| Insurance | 2 | $20B |
|
||
| Healthcare | 2 | $19B |
|
||
| Financial Services | 1 | $70B |
|
||
Price history
1 event — show timeline
- 2026-03-13 Listed $75,000 BRIGHT MLS
Cash-flow waterfall
monthlySold comps — $/sqft
last 12 mo · ≤1 miLoading sold comps…