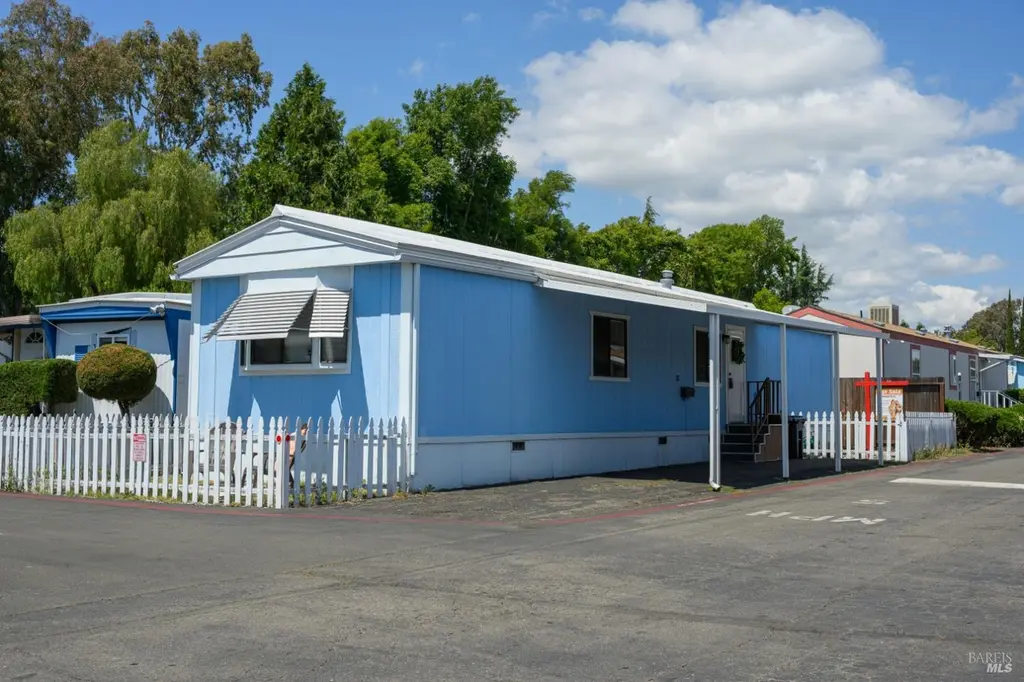
14 Balboa Ct · Fairfield, CA
Flood risk 1/10 · Minimal
- FEMA flood zone
- X (unshaded)
- Chance of flooding over 30 yrs
- 0.0%
- Est. flood insurance / yr
- $507 – $1,088
Fire risk 4/10 · Minor
- Est. fire insurance / yr
- $659 – $1,223
Heat risk 6/10 · Moderate
- Hot days now (above 97°F)
- 7 days/yr
- Hot days in 30 yrs
- 14 days/yr
Wind risk 1/10 · Minimal
- Chance of severe wind over 30 yrs
- —
Air-quality risk 10/10 · Severe
- Unhealthy air days now
- 21 days/yr
- Unhealthy air days in 30 yrs
- 22 days/yr
Risk factors via First Street. Map © Google.
Why this score? — see what drove the B+ grade
The composite is a weighted blend of 9 inputs, each scored 0–100. Each bar is that input's sub-score; the figure is the points it added to the 100-point composite (weight × sub-score).
- Cash flow +30.0/30.0
- ARV discount +15.0/15.0
- 1% rule +10.0/10.0
- DSCR +10.0/10.0
- Condition / age +3.8/5.0
- Schools +3.5/10.0
- Livability +3.4/5.0
- Rent growth +2.5/5.0
- Appreciation +0.0/10.0
$119,777
🖨 Deal sheet 📄 Offer letter ✓ Due diligence
Listing remarks
Cornflower blue and ready for you! A truly immaculate homage to yesteryear with the best priced space rent in Solano in an all-ages gated mobile park. Time capsule home loved by only one owner in its full 40 years, the best condition you'll find just about anywhere. You will love the wood paneling with plush carpeting and well-preserved linoleum design elements that are all making a comeback, so you'll be ahead of trends! Add your own touch with a little sweat equity and transform this space into something special while appreciating the character. This single-wide layout lives larger than meets the eye, with a thoughtful 2-bedroom split layout, eat-in kitchen, and full laundry space. This u
Key facts
- Built-in cabinetry
- Gated mobile park
- Wood paneling
Tags
Property features AI
Finance
- Financial info: Monthly space rent / land lease approx. $400
- HOA & community: Located in Pacific Estates MHP; Park amenities include clubhouse, pool, picnic area, guest parking, activities, and nearby public transit; Association covers grounds maintenance, management, and security; fee frequency listed in remarks
Exterior
- Parking: Covered parking for 2
- Security: Secured access; Security gate
- Utilities: Cable available; Internet available; Public sewer; 220 volts in laundry; Gas water heater
- Home design: Manufactured in-park home (single wide); Original condition; Located on a corner lot; Land lease in place
- Construction: Skyline manufactured home; Skirt: Unknown
- Exterior features: Covered patio; Porch with steps; Carport awning; Porch awning; Fenced yard; Shed(s)
Interior
- Kitchen: Breakfast area; Laminate countertops; Free-standing gas oven and range; Free-standing refrigerator
- Bedrooms: 2 bedrooms
- Flooring: Carpet; Linoleum
- Bathrooms: 1 full bathroom with tub and shower over
- Heating & cooling: Floor furnace heating; Ceiling fan(s); Wall AC unit(s)
- Interior features: Cathedral/vaulted living room ceiling; Storage area
- Laundry & utility: Washer and dryer included; 220V outlet in laundry; Gas water heater
Neighborhood map
What this means for you Summary
Snapshot
- This is a 2-bed/1.0-bath manufactured listed at $120k. Condition is rated good.
Deal economics
- At list price, monthly cash flow is $787 ($9k/yr) — positive.
- The deal already cash-flows at list — no discount required.
- Meets the 1% rule at list price ($2k rent vs $120k).
- Recommended offer: $118k (1.5% below list) — sets the bar for market timing.
- Cap rate 14.2% vs local median 3.0% in Fairfield — top-decile yield for the area; either an underpriced asset or a hidden risk that comps aren't pricing in. Stress-test before assuming the spread holds.
Location & tenants
- Location reads 67/100 on livability (#314 in CA) — a middle-class / working-renter tenant base. Strengths: employment A+, housing A+, health & safety A+; Watch: schools C-, crime D-, commute F.
- Fairfield-Suisun Unified (urban): math 23% / reading 53% proficiency, ranked #238 of 517 in CA (top 46%) — families likely to look elsewhere, expect single-tenant / working-renter base with shorter leases.
- Market conditions: Rents flat; 264 active listings in the ZIP; 40 comparable units currently listed for rent nearby; rentals lingering (median 44d on market — plan ~5-8 weeks vacancy on turnover, expect pricing pressure); 50% of comp listings sitting > 30 days — soft ceiling on asking rent; solid renter incomes; 1,472 units permitted in Solano County in 2024 (131 in 5+ unit buildings).
Forward outlook
- Local home prices are declining (-3.0%/yr); year-one equity from $828 of loan paydown is wiped out by about $4k of value loss. Plan a longer hold.
- Solano County population projected at +15% by 2050 — modest demand growth; plan on rents tracking national, not racing it.
- At projected returns (-3.0% appreciation + 0.1% rent growth), your $34k cash investment doubles in ~5 years — after that, you're playing with house money.
Negotiation context
- It's been on market 24 days — a 2% lower offer ($118k) is reasonable based on typical stale-listing flexibility.
Risks & watch-outs
- Climate carrying-cost: extreme-heat days projected 7→14/yr by 2055 (HVAC capex compounding) — expect insurance premiums to compound above CPI over the hold.
Questions for the listing agent
- Is there a deadline driving the sale (1031 exchange, divorce, estate, relocation)? That informs how much negotiation room exists.
- Crime grade is D in this area — have there been break-ins, vandalism, or insurance claims at this property in the last 3 years? What carrier currently insures it and at what premium?
- What's the average days-on-market for RENTAL listings here right now (not sales)? A rising rental-DOM trend means longer vacancies and softer asking-rent achievability than the comps imply.
- What's the recent tenant-quality profile in this submarket — average credit score on applications, eviction rate, late-payment / NSF rate, and stable-employment percentage? A property-management company in the area should have these aggregated.
- How much new for-sale + rental construction is in the pipeline within 1–3 miles? Heavy new supply typically softens prices + rents 12–24 months out; constrained supply supports both.
Investment metrics
- 1% rule
- 1.71% ✓
- Cap rate
- 14.17%
- Cash-on-cash
- 28.15%
- DSCR
- 2.25
- GRM
- 4.9
CMA / ARV
- ARV (median comp)
- $150,000
- List price
- $119,777
- Delta
- -20.15%
- Verdict
- UNDERPRICED
- Comps
- 7 within 1.0 mi
Show comp detail 5 sales within ~0.75 mi
| Address | Dist | Beds/Ba | Sqft | Sold | Price | $/sf | Match |
|---|---|---|---|---|---|---|---|
| 77 Anza Ct | 0.05mi | 2/1.0 | 780 (+2%) | 1mo | $155,000 | $199 | 94 |
| 46 Anza Ct | 0.06mi | 2/1.0 | 720 (-6%) | 3mo | $155,000 | $215 | 85 |
| 20 Balboa Ct | 0.04mi | 2/1.0 | 784 (+2%) | 21mo | $159,000 | $203 | 76 |
| 55 Anza Ct | 0.10mi | 2/2.0 | 800 (+5%) | 15mo | $185,000 | $231 | 71 |
| 41 Anza Ct | 0.06mi | 3/1.0 (+1) | 864 (+13%) | 18mo | $190,000 | $220 | 55 |
Match score weights: distance 35% · size 25% · config 20% · recency 20%. Top-matched comps best support the ARV.
Projected returns pro-forma
-3.0% appreciation · 0.15% rent growth · sell at horizon
- IRR
- 19.1%
- Equity multiple
- 1.75×
- Total profit
- $25,030
- Equity at exit
- $17,859
- IRR
- 25.4%
- Equity multiple
- 2.92×
- Total profit
- $64,355
- Equity at exit
- $10,356
Cash invested: $33,538 (down + closing). Projections, not guarantees.
Landlord ↔ Tenant lean methodology
- Overall (STATE)
- 18 Strongly Tenant-Friendly
- State California
- 18 Strongly Tenant-Friendly · D+13
- County
- — inherits STATE
- City
- — inherits STATE
ZIP-level market 94533
- Rents YoY
- 0.1%
- Active inventory
- 264
- Price-to-rent
- 4.9×
Monthly cashflow live
- Estimated rent
- $2,044 high interval (Pro) →
- Mortgage (P&I)
- −$628
- Tax est. 1.5%
- −$150 /mo · $1,797/yr
- Insurance
- −$50
- HOA
- −$0
- Vacancy / Maint / Mgmt
- −$429
- Net cashflow
- $787
Break-even live
UW: 25.0% down · 7.5% · 30yr · 1.5% tax · 5.0% vac · 8.0% maint · 8.0% mgmt
Financing live
Cash to close
- Down payment
- $29,944
- Closing costs
- $3,593
- Reserves months
- —
- Total cash needed
- —
Loan-product check · same deal, 3 products live
Conventional
25% down · 7.5% · 30yr
- Down + closing
- —
- Monthly P&I
- —
- Monthly cashflow
- —
- DSCR
- —
- Eligible?
- —
Personal DTI + credit; lowest rate.
DSCR
20% down · 8.5% · 30yr
- Down + closing
- —
- Monthly P&I
- —
- Monthly cashflow
- —
- DSCR
- —
- Eligible?
- —
No personal income docs; deal must DSCR.
Hard money
10% down · 12.0% · 12mo
- Down + closing
- —
- Monthly P&I
- —
- Monthly cashflow
- —
- DSCR
- —
- Eligible?
- —
Short-term bridge; refi at stabilization.
Rent comps 40 comps
| Address | Beds | Baths | Sqft | Rent | $/sqft | DOM | Units | Dist |
|---|---|---|---|---|---|---|---|---|
| 2215 Peach Tree Dr Fairfield, CA | 1.0–2.0 | 1.0 | 701 | $2,375 | $3.39 | 14d | 3 | 0.09mi |
| 181 Pacific Ave Unit 205D Fairfield, CA | 2.0 | 1.0 | 808 | $1,675 | $2.07 | 23d | 1 | 0.13mi |
| 540 Pacific Ave Unit 6 Fairfield, CA | 2.0 | 1.5 | 800 | $1,800 | $2.25 | 23d | 1 | 0.15mi |
| 237 Alaska Ave Unit 8 Fairfield, CA | 2.0 | 1.0 | 800 | $1,850 | $2.31 | 44d | 1 | 0.15mi |
| 101 Tabor Ave Unit A Fairfield, CA | 3.0 | 1.0 | 900 | $2,100 | $2.33 | 44d | 1 | 0.17mi |
| 131 Alaska Ave Apt 12 Fairfield, CA | 2.0 | 1.0 | 800 | $1,795 | $2.24 | 44d | 1 | 0.19mi |
| 2134 Union Ave Fairfield, CA | 2.0 | 1.0 | 950 | $2,395 | $2.52 | 44d | 1 | 0.21mi |
| 195 E Pacific Ave Unit 19 Fairfield, CA | 2.0 | 2.0 | 1000 | $1,949 | $1.95 | 14d | 1 | 0.23mi |
| 2101 Santa Ana Dr Apt 48 Fairfield, CA | 1.0 | 1.0 | 772 | $1,395 | $1.81 | 44d | 1 | 0.28mi |
| 2450 Peach Tree Dr Fairfield, CA | 2.0 | 1.0 | 810 | $2,199 | $2.71 | 14d | 2 | 0.30mi |
| 2124 Santa Ana Dr Fairfield, CA | 2.0 | 1.0 | 1000 | $2,020 | $2.02 | 44d | 1 | 0.31mi |
| 2376 Fairfield Ave Fairfield, CA | 1.0 | 1.0 | 620 | $2,174 | $3.51 | 14d | 2 | 0.45mi |
| 2355 Fairfield Ave Fairfield, CA | 1.0 | 1.0 | 769 | $1,740 | $2.26 | 14d | 3 | 0.48mi |
| 319 E Tabor Ave Fairfield, CA | 1.0–2.0 | 1.0 | 625 | $2,111 | $3.38 | 21d | 4 | 0.49mi |
| 2323 Fairfield Ave Fairfield, CA | 1.0 | 1.0 | 620 | $1,901 | $3.07 | 23d | 5 | 0.52mi |
| 1111 Alaska Ave Fairfield, CA | 1.0–2.0 | 1.0 | 787 | $2,249 | $2.86 | 14d | 10 | 0.56mi |
| 1736 Fillmore St Unit 1 Fairfield, CA | 2.0 | 1.0 | 850 | $1,800 | $2.12 | 44d | 1 | 0.60mi |
| 1712 Arthur Ct Unit 1712A Fairfield, CA | 2.0 | 1.0 | 740 | $1,800 | $2.43 | 21d | 1 | 0.66mi |
| 50 El Basset Ct #50 Fairfield, CA | 2.0 | 1.0 | 850 | $2,450 | $2.88 | 44d | 1 | 0.68mi |
| 1746 Kidder Ave Unit 5 Fairfield, CA | 2.0 | 1.0 | 775 | $1,900 | $2.45 | 44d | 1 | 0.69mi |
| 1746 Kidder Ave Unit 10 Fairfield, CA | 1.0 | 1.0 | 675 | $1,495 | $2.21 | 44d | 1 | 0.69mi |
| 53 El Basset Ct Fairfield, CA | 2.0 | 1.5 | 997 | $2,100 | $2.11 | 14d | 1 | 0.71mi |
| 100 Hawthorn Dr Fairfield, CA | 1.0–2.0 | 1.0 | 726 | $2,249 | $3.10 | 14d | 11 | 0.74mi |
| 460 San Marco St Unit D Fairfield, CA | 2.0 | 1.0 | 640 | $1,650 | $2.58 | 44d | 1 | 0.74mi |
| 708 E Tabor Ave Unit 76612 Fairfield, CA | 2.0 | 1.0 | 950 | $1,750 | $1.84 | 44d | 1 | 0.75mi |
| 459 San Marco St Unit 4 Fairfield, CA | 2.0 | 1.0 | 650 | $1,600 | $2.46 | 23d | 1 | 0.76mi |
| 459 San Marco St Unit 3 Fairfield, CA | 2.0 | 1.0 | 650 | $1,600 | $2.46 | 44d | 1 | 0.76mi |
| 1890 Dover Ave Fairfield, CA | 1.0–2.0 | 1.0–2.0 | 835 | $1,995 | $2.39 | 14d | 2 | 0.79mi |
| 1600 Travion Ct Fairfield, CA | 2.0 | 1.0 | 837 | $1,950 | $2.33 | 44d | 3 | 0.83mi |
| 2915 N Texas St Fairfield, CA | 2.0 | 1.0–2.0 | 838 | $2,225 | $2.66 | 44d | 2 | 0.83mi |
| 2915 N Texas St Fairfield, CA | 2.0 | 1.0–2.0 | 842 | $2,350 | $2.79 | 14d | 1 | 0.83mi |
| 1206 Dana Dr Unit 02 Fairfield, CA | 2.0 | 1.5 | 1100 | $1,925 | $1.75 | 44d | 1 | 0.87mi |
| 766 E Tabor Ave Unit 12 Fairfield, CA | 2.0 | 1.0 | 950 | $1,750 | $1.84 | 44d | 1 | 0.88mi |
| 1415 Union Ave Fairfield, CA | 1.0 | 1.0 | 650 | $1,750 | $2.69 | 44d | 1 | 0.92mi |
| 1240 Dana Dr Fairfield, CA | 2.0 | 2.0 | 950 | $1,800 | $1.89 | 44d | 1 | 0.92mi |
| 2550 Hilborn Rd Fairfield, CA | 1.0–2.0 | 1.0–2.0 | 870 | $2,563 | $2.95 | 14d | 16 | 1.01mi |
| 2800 Dover Ave Unit G6 Fairfield, CA | 2.0 | 1.0 | 950 | $2,095 | $2.21 | 23d | 1 | 1.03mi |
| 3001 N Texas St Fairfield, CA | 1.0–2.0 | 1.0–2.0 | 931 | $2,374 | $2.55 | 14d | 8 | 1.04mi |
| 713 E Travis Blvd Fairfield, CA | 1.0–2.0 | 1.0–1.5 | 827 | $2,277 | $2.75 | 44d | 1 | 1.10mi |
| 1930 Manor Pl Unit 1 Fairfield, CA | 2.0 | 1.5 | 1100 | $2,150 | $1.95 | 21d | 1 | 1.40mi |
Listing history 2 events
-
2026-05-07historical Contingent (Show) 1482-char remark
-
2026-04-29$119,777 Active 1482-char remark
ⓘ Source: listings_history table (triggers on properties + properties_extension) + one-shot
backfill from property_details.listing_events for pre-trigger history.
Climate risk First Street
- Flood 1/10 Low FEMA zone X (unshaded) · 0% chance over 30 yrs
- Wildfire 4/10 Moderate
- Heat 6/10 Major 7 d/yr ≥97°F today · 14 d/yr by 30 yrs out
- Wind 1/10 Low
- Air quality 10/10 Extreme 21 unhealthy d/yr today · 22 by 30 yrs out
Nearby sold comps map
Loading sold comps map…
Walkable amenities ~0.75 mi
Loading nearby amenities…
Taxation est. · year 1
- Rental income
- $24,524
- − Mortgage interest
- −$6,709
- − Property taxes
- −$1,797
- − Insurance
- −$599
- − Repairs & maintenance
- −$1,962
- − Management
- −$1,962
- − Depreciation
- −$3,484
- Taxable income
- $8,010
- Est. tax owed @ 24.0%
- −$1,923
- After-tax cash flow
- $7,518/yr
For passive investors: Depreciation is non-cash, so a rental often shows a tax loss while cash-flowing — sheltering income. Rental losses are passive: they offset passive income freely, and up to $25,000/yr can offset ordinary (W-2) income if you actively participate and your MAGI is under $100k (phasing out to $0 by $150k); unused losses carry forward. On sale, claimed depreciation is recaptured at up to 25%, and gains may owe capital-gains tax (a 1031 exchange can defer both). Figures are a year-1 estimate at your 24.0% rate — not tax advice; consult a CPA.
Condition & rehab AI · 12 photos
This single-wide manufactured home is in good condition with cosmetic updates needed to enhance its resale value.
Repairs flagged
- Minor kitchen cabinets — slight wear
- Minor bathroom fixtures — dated design
Value-add opportunities
- Resale paint interior walls — enhances curb appeal and interior aesthetics
- Resale replace linoleum flooring — modernizes the space and improves functionality
- Resale update kitchen cabinets — modernizes the kitchen and improves functionality
Renovation cost estimate screening
| Repair item | Severity | Est. cost |
|---|---|---|
| kitchen cabinets · slight wear | Minor | $500–3,000 |
| bathroom fixtures · dated design | Minor | $500–3,000 |
| Total estimated repair cost · 2 items | $1,000–6,000 |
Value-add ROI direction
- Resale paint interior walls — enhances curb appeal and interior aesthetics ↑
- Resale replace linoleum flooring — modernizes the space and improves functionality ↑
- Resale update kitchen cabinets — modernizes the kitchen and improves functionality ↑
ⓘ Cost ranges are severity-bucket heuristics (US national rule-of-thumb). Get contractor quotes + a written scope before underwriting a rehab budget.
Schools (NCES district)
- District
- Fairfield-Suisun Unified
- NCES district ID
- 0613360
- Math proficiency
- 23% ▼ -10.00%
- Reading proficiency
- 53% ▲ 8.00%
- Median HH income
- $69,654
- Composite
- 34.59/100
- National rank
- #5157
- State rank
- #238 of 517 in CA
Livability — Fairfield
- Score
- 67/100
- State rank
- #314
- US rank
- #10551
Category grades
Schools grade is shown separately in the Schools card above.
Census & demographics
- Census place
- Fairfield, CA
- County
- Solano County · 433,239 people
- City population
- 120,008
- Metro
- Vallejo, CA
- Population (ZIP)
- 78,805
- Household income
- $87,384
- Rent vs Own
- Severe rent burden
- 3474.0
Population outlook (Solano County) Hauer SSP2
- Today (2025)
- 478,685 people
- By 2030
- 497,974 · +4.0%
- By 2040
- 528,515 · +10.4%
- By 2050
- 549,115 · +14.7%
- By 2075
- 587,229 · +22.7%
- By 2100
- 571,378 · +19.4%
Race, ethnicity, and origin ACS 2023
- Neighborhood character
- Highly diverse neighborhood (Simpson 0.75)
- Race & ethnicity
- Hispanic / Latino 39% White 23% Black 16% Two or more races 16% Asian 14% Pacific Islander 1%
- Hispanic origin (detail)
- Mexican 34%
- Common ancestry
- Italian 5% Lithuanian 1% Slovak 1%
- Foreign-born
- 26% · Canada, Vietnam, China
- Languages at home
- 59% English-only · Spanish 28% Tagalog/Filipino 6% Other Indo-European 2%
Political lean MEDSL · Solano
- 2024 margin
- Strong D (+23.0) · D 60.0% · R 37.1% · Other 2.9%
- 2008→2024 swing
- -5.6pp toward R · 2008: 28.6pp · 2024: 23.0pp
- All cycles
- 2024: D+23.0 2020: D+30.3 2016: D+30.5 2012: D+28.1 2008: D+28.6
Not yet ingested
- Civics
- —
Market trends
- HPI YoY
- ▼ -258.88%
- Current HPI
- 285.4365
- Rent YoY
- ▲ 0.15%
- Metro
- Vallejo, CA
- State GDP YoY
- ▲ 3.21%
- F500 in state
- 116
Industry mix (Fortune 500 HQ in CA)
| Industry | F500 HQs | Revenue |
|---|---|---|
| Technology | 27 | $1,492B |
|
||
| Financial Services | 3 | $174B |
|
||
| Retail | 3 | $44B |
|
||
| Insurance | 3 | $26B |
|
||
| Media / Entertainment | 2 | $115B |
|
||
| Pharmaceuticals / Biotech | 2 | $62B |
|
||
Price history
+4.4% since first listed4 events — show timeline
- 2026-06-08 Sold (MLS) $125,000 BAREIS
- 2026-05-24 Pending — BAREIS
- 2026-05-07 Contingent — BAREIS
- 2026-04-29 Listed $119,777 BAREIS
Cash-flow waterfall
monthlySold comps — $/sqft
last 12 mo · ≤1 miLoading sold comps…