 Multi-family
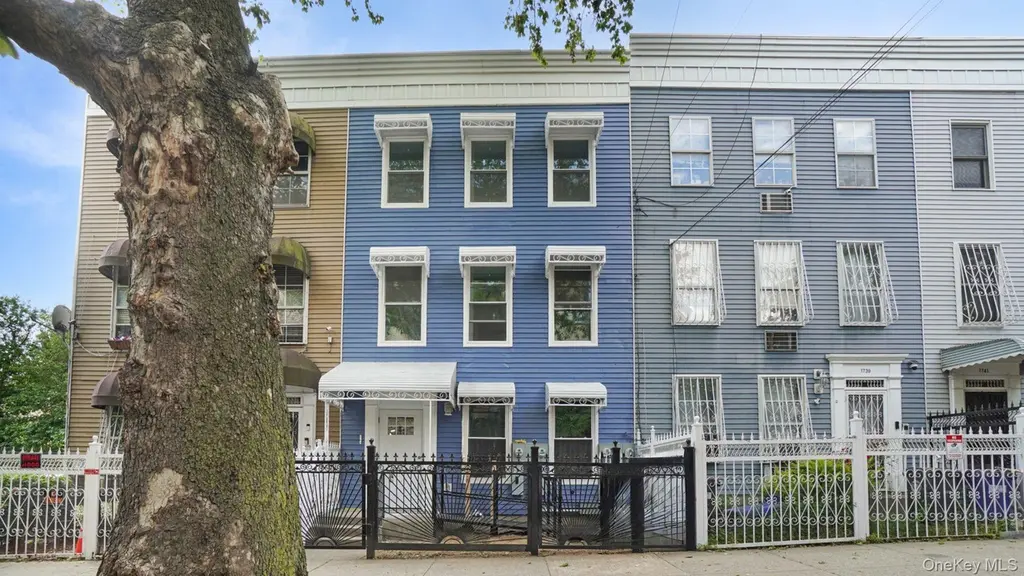
1737 Popham Ave · New York, NY
Flood risk 1/10 · Minimal
- FEMA flood zone
- X (unshaded)
- Chance of flooding over 30 yrs
- 0.0%
- Est. flood insurance / yr
- $507 – $1,088
Fire risk 1/10 · Minimal
- Est. fire insurance / yr
- $691 – $1,283
Heat risk 6/10 · Moderate
- Hot days now (above 99°F)
- 7 days/yr
- Hot days in 30 yrs
- 15 days/yr
Wind risk 6/10 · Moderate
- Chance of severe wind over 30 yrs
- 27.0%
Air-quality risk 3/10 · Minor
- Unhealthy air days now
- 3 days/yr
- Unhealthy air days in 30 yrs
- 4 days/yr
Risk factors via First Street. Map © Google.
Why this score? — see what drove the C+ grade
The composite is a weighted blend of 9 inputs, each scored 0–100. Each bar is that input's sub-score; the figure is the points it added to the 100-point composite (weight × sub-score).
- Cash flow +25.6/30.0
- Appreciation +10.0/10.0
- DSCR +8.5/10.0
- 1% rule +5.8/10.0
- Schools +5.0/10.0
- Livability +3.8/5.0
- Rent growth +2.5/5.0
- Condition / age +2.5/5.0
- ARV discount +0.0/15.0
$1,300,000
🖨 Deal sheet 📄 Offer letter ✓ Due diligence
Multi-family units
County records classify this as Multi-Family (2-4 Unit). Listing-text estimate: 1 unit. estimate disagrees with records
Listing remarks
Welcome to this exceptional attached residence located in the highly desirable Morris Heights neighborhood of the Bronx. Situated at 1737 Popham Avenue, this spacious property presents an outstanding opportunity for both end-users and investors alike. Offering approximately 3,000 square feet of building space on a 2,146 square foot lot, the property is thoughtfully configured with a 3-over-3-over-2 layout, providing versatility, strong income potential, and comfortable living arrangements. The property features a total of 8 generously sized bedrooms and 3 full bathrooms, making it ideal for owner-occupants or investors seeking rental income potential. Each unit offers a functional layout wi
Key facts
- 2,100 sq ft lot
- Built 1993
- Listed 13 days
Property features AI
Exterior
- Parking: Driveway (no carport)
- Utilities: Public sewer
- Home design: Triplex
- Construction: Frame construction
- Exterior features: Trash collection (public); Not waterfront
Interior
- Bedrooms: Two 3-bedroom units; One 2-bedroom unit
- Bathrooms: Three full bathrooms
- Heating & cooling: Central air conditioning; Electric heating; Other heating
- Interior features: Finished basement; Other interior features
Neighborhood map
What this means for you Summary
Snapshot
- This is a 8-bed/3.0-bath multifamily listed at $1.30M.
Deal economics
- At list price, monthly cash flow is $3k ($37k/yr) — positive.
- The deal already cash-flows at list — no discount required.
- Meets the 1% rule at list price ($14k rent vs $1.30M).
- Cap rate 9.1% vs local median 2.6% in New York — top-decile yield for the area; either an underpriced asset or a hidden risk that comps aren't pricing in. Stress-test before assuming the spread holds.
Location & tenants
- Location reads 75/100 on livability (#268 in NY, #4,188 nationally) — a middle-class / working-renter tenant base. Strengths: amenities A+, commute A+, health & safety A; Watch: crime F, cost of living F.
- Market conditions: 34 active listings in the ZIP; lower-income renter base — watch delinquency; 6,929 units permitted in Bronx County in 2024 (6,829 in 5+ unit buildings).
- At $14,020/mo this rent would consume 507% of the median local household income ($33k/yr) (locally 10286% of renters already pay >50% of income on rent) — very limited rent-growth headroom before tenants either downsize or default.
Forward outlook
- In year one you build about $139k of equity ($9k loan paydown + $130k appreciation (10.0% local appreciation)).
- Bronx County population projected at +21% by 2050 — long-run rental-demand tailwind backs the buy-and-hold thesis.
- At projected returns (10.0% appreciation + 3.0% rent growth), your $364k cash investment doubles in ~2 years — after that, you're playing with house money.
- By year 2, paydown + projected appreciation supports a ~$223k cash-out refi (75% LTV) — recoverable capital for the next deal without selling this one.
Negotiation context
- Only 13 days on market — expect competitive offers; lowballing is unlikely to land.
- Current owner paid $412k; list at $1.30M implies a 216% gain — meaningful room to come down on a strong offer.
Risks & watch-outs
- Climate carrying-cost: major wind risk, 27% chance of damaging wind over 30y; extreme-heat days projected 7→15/yr by 2055 (HVAC capex compounding) — expect insurance premiums to compound above CPI over the hold.
Questions for the listing agent
- Is there a deadline driving the sale (1031 exchange, divorce, estate, relocation)? That informs how much negotiation room exists.
- Schools are B-rated — typically a magnet for longer-tenancy family renters. What's the average tenant stay here, and is there a school-zone premium baked into asking?
- Crime grade is F in this area — have there been break-ins, vandalism, or insurance claims at this property in the last 3 years? What carrier currently insures it and at what premium?
- What's the average days-on-market for RENTAL listings here right now (not sales)? A rising rental-DOM trend means longer vacancies and softer asking-rent achievability than the comps imply.
- What's the recent tenant-quality profile in this submarket — average credit score on applications, eviction rate, late-payment / NSF rate, and stable-employment percentage? A property-management company in the area should have these aggregated.
- How much new apartment / multifamily construction is in the pipeline within 1–3 miles? Heavy new supply (>2% of stock underway) typically softens rents 12–24 months out; light construction supports rent growth.
Investment metrics
- 1% rule
- 1.08% ✓
- Cap rate
- 9.15%
- Cash-on-cash
- 10.19%
- DSCR
- 1.45
- GRM
- 7.7
CMA / ARV
- ARV (on-the-fly)
- $987,000
- Comps found
- 1
Show comp detail 1 sale within ~0.75 mi
| Address | Dist | Beds/Ba | Sqft | Sold | Price | $/sf | Match |
|---|---|---|---|---|---|---|---|
| 118 Rockwood St | 0.70mi | 8/3.0 | 2,580 (-14%) | 20mo | $850,000 | $329 | 27 |
Match score weights: distance 35% · size 25% · config 20% · recency 20%. Top-matched comps best support the ARV.
Projected returns pro-forma
10.0% appreciation · 3.0% rent growth · sell at horizon
- IRR
- 31.7%
- Equity multiple
- 3.48×
- Total profit
- $904,407
- Equity at exit
- $1,171,143
- IRR
- 27.4%
- Equity multiple
- 7.89×
- Total profit
- $2,507,773
- Equity at exit
- $2,525,614
Cash invested: $364,000 (down + closing). Projections, not guarantees.
Landlord ↔ Tenant lean methodology
- Overall (CITY)
- 0 Strongly Tenant-Friendly
- State New York
- 15 Strongly Tenant-Friendly · D+10
- County
- — inherits STATE
- City New York
- 0 Strongly Tenant-Friendly · D+34
ZIP-level market 10453
- Home prices YoY
- 4.2%
- Active inventory
- 34
- Price-to-rent
- 23.2×
Monthly cashflow live
- Estimated rent
- $14,020 medium interval (Pro) →
- Mortgage (P&I)
- −$6,817
- Tax from tax record
- −$627 /mo · $7,523/yr
- Insurance
- −$542
- HOA
- −$0
- Vacancy / Maint / Mgmt
- −$2,944
- Net cashflow
- $3,090
Break-even live
3-unit breakdown (identical units grouped — click to expand)
| Units | Beds | Baths | Est. rent |
|---|---|---|---|
| 3× units | 3 | 1 | $14,019 |
| #1 | 3 | 1 | $4,673 |
| #2 | 3 | 1 | $4,673 |
| #3 | 3 | 1 | $4,673 |
| Total (3 units) | $14,020 | ||
UW: 25.0% down · 7.5% · 30yr · 1.5% tax · 5.0% vac · 8.0% maint · 8.0% mgmt
Financing live
Cash to close
- Down payment
- $325,000
- Closing costs
- $39,000
- Reserves months
- —
- Total cash needed
- —
Loan-product check · same deal, 3 products live
Conventional
25% down · 7.5% · 30yr
- Down + closing
- —
- Monthly P&I
- —
- Monthly cashflow
- —
- DSCR
- —
- Eligible?
- —
Personal DTI + credit; lowest rate.
DSCR
20% down · 8.5% · 30yr
- Down + closing
- —
- Monthly P&I
- —
- Monthly cashflow
- —
- DSCR
- —
- Eligible?
- —
No personal income docs; deal must DSCR.
Hard money
10% down · 12.0% · 12mo
- Down + closing
- —
- Monthly P&I
- —
- Monthly cashflow
- —
- DSCR
- —
- Eligible?
- —
Short-term bridge; refi at stabilization.
Listing history 13 events
-
2026-06-18days on market $1,300,000 Active 13 DOM
-
2026-06-17days on market $1,300,000 Active 12 DOM
-
2026-06-16days on market $1,300,000 Active 11 DOM
-
2026-06-15days on market $1,300,000 Active 10 DOM
-
2026-06-13days on market $1,300,000 Active 8 DOM
-
2026-06-09days on market $1,300,000 Active 4 DOM
-
2026-06-08days on market $1,300,000 Active 3 DOM
-
2026-06-07statusdays on market $1,300,000 Active 2 DOM
-
2026-06-04days on market $1,300,000 Coming Soon 7 DOM
-
2026-06-03days on market $1,300,000 Coming Soon 6 DOM
-
2026-06-02days on market $1,300,000 Coming Soon 5 DOM
-
2026-06-01days on market $1,300,000 Coming Soon 4 DOM
-
2026-05-31days on market $1,300,000 Coming Soon 3 DOM
ⓘ Source: listings_history table (triggers on properties + properties_extension) + one-shot
backfill from property_details.listing_events for pre-trigger history.
Tax reassessment forecast NY · Partial reset (capped growth)
- Current annual tax
- $7,523 · $627/mo
- Projected year-2 tax
- $14,747 · $1,229/mo
- Expected delta
- +$7,223/yr (+$602/mo · 96.0%)
ⓘ Screening estimate from a state-policy table — verify with the county assessor before closing.
Climate risk First Street
- Flood 1/10 Low FEMA zone X (unshaded) · 0% chance over 30 yrs
- Wildfire 1/10 Low
- Heat 6/10 Major 7 d/yr ≥99°F today · 15 d/yr by 30 yrs out
- Wind 6/10 Major 27% chance of damaging wind over 30 yrs
- Air quality 3/10 Moderate 3 unhealthy d/yr today · 4 by 30 yrs out
Nearby sold comps map
Loading sold comps map…
Walkable amenities ~0.75 mi
Loading nearby amenities…
Taxation est. · year 1
- Rental income
- $168,240
- − Mortgage interest
- −$72,820
- − Property taxes
- −$7,523
- − Insurance
- −$6,500
- − Repairs & maintenance
- −$13,459
- − Management
- −$13,459
- − Depreciation
- −$37,818
- Taxable income
- $16,660
- Est. tax owed @ 24.0%
- −$3,998
- After-tax cash flow
- $33,080/yr
For passive investors: Depreciation is non-cash, so a rental often shows a tax loss while cash-flowing — sheltering income. Rental losses are passive: they offset passive income freely, and up to $25,000/yr can offset ordinary (W-2) income if you actively participate and your MAGI is under $100k (phasing out to $0 by $150k); unused losses carry forward. On sale, claimed depreciation is recaptured at up to 25%, and gains may owe capital-gains tax (a 1031 exchange can defer both). Figures are a year-1 estimate at your 24.0% rate — not tax advice; consult a CPA.
Schools (NCES district)
No district data.
Livability — New York
- Score
- 75/100
- State rank
- #268
- US rank
- #4188
Category grades
Schools grade is shown separately in the Schools card above.
Census & demographics
- Census place
- New York, NY
- County
- Bronx County · 1,197,324 people
- City population
- 7,731,280
- Metro
- New York-Newark-Jersey City, NY-NJ-PA
- Population (ZIP)
- 76,282
- Household income
- $33,186
- Rent vs Own
- Severe rent burden
- 10286.0
Population outlook (Bronx County) Hauer SSP2
- Today (2025)
- 1,607,353 people
- By 2030
- 1,681,852 · +4.6%
- By 2040
- 1,824,421 · +13.5%
- By 2050
- 1,945,470 · +21.0%
- By 2075
- 2,187,887 · +36.1%
- By 2100
- 2,244,136 · +39.6%
Race, ethnicity, and origin ACS 2023
- Neighborhood character
- Predominantly Hispanic (67%)
- Race & ethnicity
- Hispanic / Latino 67% Black 26% Two or more races 17% White 2% Native American 2% Asian 1%
- Hispanic origin (detail)
- Mexican 4% Puerto Rican 13% Dominican 41%
- Foreign-born
- 44% · Canada, United Kingdom, Jamaica
- Languages at home
- 32% English-only · Spanish 58% French/Haitian/Cajun 2% Other Indo-European 1%
Political lean MEDSL · Bronx
- 2024 margin
- Solid D (+45.4) · D 72.7% · R 27.3%
- 2008→2024 swing
- -32.3pp toward R · 2008: 77.8pp · 2024: 45.4pp
- All cycles
- 2024: D+45.4 2020: D+67.6 2016: D+79.1 2012: D+82.9 2008: D+77.8
Not yet ingested
- Civics
- —
Market trends
- HPI YoY
- ▲ 14.52%
- Current HPI
- 361.6961
- Rent YoY
- —
- Metro
- New York-Newark-Jersey City, NY-NJ-PA
- State GDP YoY
- ▲ 2.60%
- F500 in state
- 92
Industry mix (Fortune 500 HQ in NY)
| Industry | F500 HQs | Revenue |
|---|---|---|
| Financial Services | 10 | $950B |
|
||
| Consumer Goods | 9 | $162B |
|
||
| Insurance | 4 | $225B |
|
||
| Telecommunications | 2 | $144B |
|
||
| Pharmaceuticals | 2 | $112B |
|
||
| Media / Entertainment | 2 | $69B |
|
||
Price history
-4.4% since first listed4 events — show timeline
- 2026-05-28 Coming Soon $1,300,000 OneKey® MLS as Distributed by MLS Grid
- 2005-11-25 Sold (Public Records) $412,000 Public Records
- 1994-12-09 Sold (Public Records) $216,000 Public Records
- 1992-05-20 Sold (Public Records) $1,359,434 Public Records
Property tax history
+3.8%/yrLatest (2025): $7,523 · +6.0% YoY. Source: county tax records.
Cash-flow waterfall
monthlySold comps — $/sqft
last 12 mo · ≤1 miLoading sold comps…