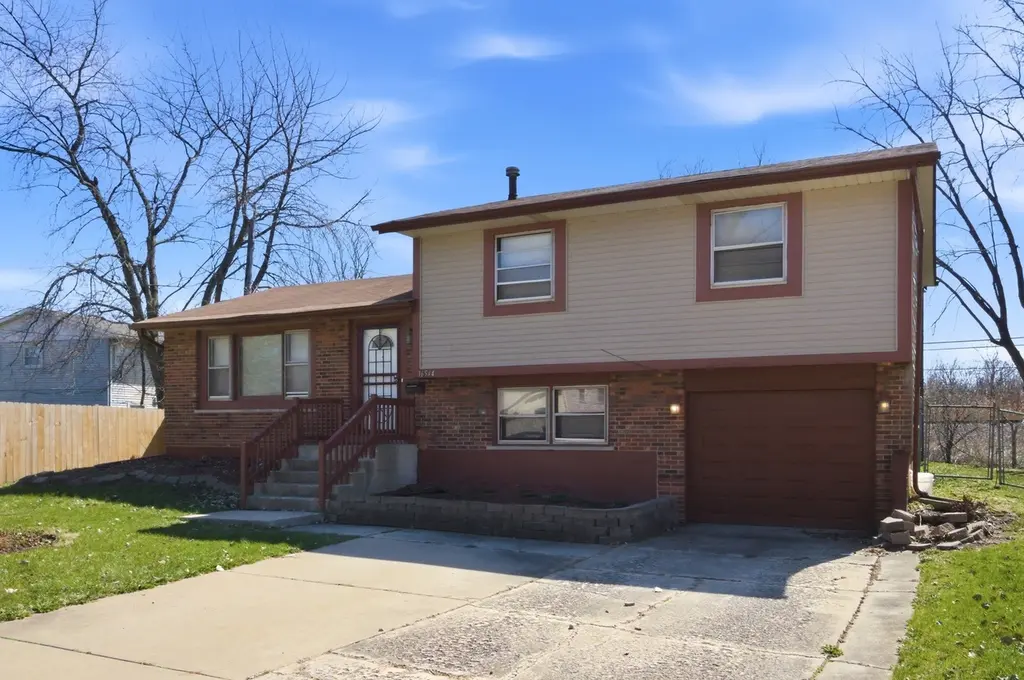
16544 Prairie Ave · South Holland, IL
Flood risk 5/10 · Moderate
- FEMA flood zone
- X (unshaded)
- Chance of flooding over 30 yrs
- 0.67%
- Est. flood insurance / yr
- $473 – $860
Fire risk 1/10 · Minimal
- Est. fire insurance / yr
- $804 – $1,492
Heat risk 3/10 · Minor
- Hot days now (above 102°F)
- 7 days/yr
- Hot days in 30 yrs
- 15 days/yr
Wind risk 2/10 · Minimal
- Chance of severe wind over 30 yrs
- —
Air-quality risk 4/10 · Minor
- Unhealthy air days now
- 4 days/yr
- Unhealthy air days in 30 yrs
- 5 days/yr
Risk factors via First Street. Map © Google.
Why this score? — see what drove the C grade
The composite is a weighted blend of 9 inputs, each scored 0–100. Each bar is that input's sub-score; the figure is the points it added to the 100-point composite (weight × sub-score).
- Cash flow +22.0/30.0
- 1% rule +8.6/10.0
- ARV discount +8.5/15.0
- DSCR +7.0/10.0
- Livability +3.9/5.0
- Rent growth +2.5/5.0
- Condition / age +2.5/5.0
- Schools +0.7/10.0
- Appreciation +0.0/10.0
$212,500
🖨 Deal sheet (PDF) 📄 Offer letter ✓ Due diligence
Listing remarks MLS
3 bedroom 1.5 bath tri-level. VACANT & EASY TO SHOW. Bank Owned, sold as-is where-is. NO DISCLOSURES/NO SURVEYS / NO TERMITE PROVIDED BY SELLER. BUYER RESPONSIBLE FOR ALL CITY AND COUNTY INSPECTIONS, REPAIRS AND ESCROWS AS NEEDED. ALL OFFERS MUST BE FAXED WITH PRE-QUAL OR POF TO LO. WITH ADDENDUMS. BUYER TO VERIFY RM COUNT & DIM. EM MUST BE CASHIERS CK. ALLOW TIME FOR RESPONSE.
Key facts
- Newer kitchen
- Newer siding
- Espresso cabinets
Tags
Property features AI
Finance
- Other: Located in the Hollandale subdivision of South Holland, Thornton township
- HOA & community: No master association fee required; Community features include curbs, sidewalks, street lights and paved streets
Exterior
- Parking: Attached garage (owned) with concrete surface — 1 garage space, 1 total parking space
- Utilities: Water source: Lake Michigan; Public sewer; Electric service with circuit breakers
- Home design: Detached single-family home; Tri-level / split-level layout; Fee simple ownership; Built before 1978
- Construction: Brick and cedar exterior; Asphalt roof; Concrete perimeter foundation; Estimated age 51–60 years
- Exterior features: Deck; Fenced yard; Lot dimensions approximately 53 x 90 x 85 x 118
Interior
- Kitchen: Kitchen with eating area / table space; Ceramic tile flooring in kitchen
- Bedrooms: 3 bedrooms (master and two additional bedrooms on the second level)
- Flooring: Hardwood flooring in living room, dining room and bedrooms; Wood laminate flooring in family room; Ceramic tile in kitchen; Other flooring in laundry
- Bathrooms: 1 full bathroom; 1 half bathroom; Whirlpool in bath
- Heating & cooling: Natural gas forced-air heating; Central air conditioning
- Interior features: 7 total rooms; L-shaped dining room
- Laundry & utility: Laundry room on lower level (8 x 7)
Neighborhood map
What this means for you Summary
Snapshot
- This is a 3-bed/1.5-bath single-family listed at $212k.
Deal economics
- At list price, monthly cash flow is $338 ($4k/yr) — positive.
- The deal already cash-flows at list — no discount required.
- Meets the 1% rule at list price ($3k rent vs $212k).
- Recommended offer: $206k (3.0% below list) — sets the bar for market timing.
Location & tenants
- Location reads 77/100 on livability (#167 in IL, #3,071 nationally) — a middle-class / working-renter tenant base. Strengths: commute A+, housing A+, cost of living A; Watch: crime C-, amenities C-, schools D+.
- Thornton Twp Hsd 205 (suburban): math 7% / reading 8% proficiency, ranked #594 of 620 in IL (top 96%) — low school quality limits family demand, transient renter base, plan for 1-2y turnover.
- Market conditions: 135 active listings in the ZIP; 4 comparable units currently listed for rent nearby; rentals at typical pace (median 26d on market — plan ~3-4 weeks tenant-placement turnaround); 6,272 units permitted in Cook County in 2024 (4,658 in 5+ unit buildings).
Forward outlook
- Local home prices are declining (-3.0%/yr); year-one equity from $1k of loan paydown is wiped out by about $6k of value loss. Plan a longer hold.
Negotiation context
- It's been on market 31 days — a 3% lower offer ($206k) is reasonable based on typical stale-listing flexibility.
- 3 sale attempts since 17y ago with the ask held roughly flat each time — persistent listings suggest the price (not the market) is what's stuck; bring a comps-based counter.
Risks & watch-outs
- Watch-outs: property tax is 4.2% of price.
- Climate carrying-cost: moderate flood risk — expect insurance premiums to compound above CPI over the hold.
Questions for the listing agent
- It's been on market 31 days. Have you received any prior offers? Is the seller open to a 3% concession, seller financing, or rate buy-down credit?
- Built in 1973 — when were the roof, HVAC, electrical panel, plumbing, and water heater last replaced?
- Property tax is high relative to price — has the assessment been appealed recently, and will the sale trigger a re-assessment?
- Is there a deadline driving the sale (1031 exchange, divorce, estate, relocation)? That informs how much negotiation room exists.
- Schools are D-rated, which usually means shorter tenancies and higher turnover. Who's the typical renter profile here, and what's been the actual vacancy rate?
- What's the average days-on-market for RENTAL listings here right now (not sales)? A rising rental-DOM trend means longer vacancies and softer asking-rent achievability than the comps imply.
- What's the recent tenant-quality profile in this submarket — average credit score on applications, eviction rate, late-payment / NSF rate, and stable-employment percentage? A property-management company in the area should have these aggregated.
- How much new for-sale + rental construction is in the pipeline within 1–3 miles? Heavy new supply typically softens prices + rents 12–24 months out; constrained supply supports both.
Investment metrics
- 1% rule
- 1.36% ✓
- Cap rate
- 8.20%
- Cash-on-cash
- 6.82%
- DSCR
- 1.30
- GRM
- 6.1
CMA / ARV
- ARV (on-the-fly)
- $217,200
- Comps found
- 12
Show comp detail 12 sales within ~0.75 mi
| Address | Dist | Beds/Ba | Sqft | Sold | Price | $/sf | Match |
|---|---|---|---|---|---|---|---|
| 1 E 164th St | 0.27mi | 3/2.0 | 1,255 (+5%) | 5mo | $195,000 | $155 | 74 |
| 16811 Wausau Ave | 0.33mi | 3/2.0 | 1,145 (-5%) | 3mo | $245,000 | $214 | 72 |
| 535 E 166th Pl | 0.52mi | 2/1.5 (-1) | 1,200 (0%) | 2mo | $156,500 | $130 | 69 |
| 16417 Claire Ln | 0.55mi | 3/2.5 | 1,209 (+1%) | 2mo | $254,995 | $211 | 68 |
| 16728 School St | 0.62mi | 3/1.5 | 1,170 (-2%) | 2mo | $196,000 | $168 | 65 |
| 16815 Wausau Ave | 0.34mi | 3/2.0 | 1,076 (-10%) | 2mo | $151,000 | $140 | 63 |
| 16550 Elm Ct | 0.38mi | 4/2.5 (+1) | 1,144 (-5%) | 4mo | $252,000 | $220 | 62 |
| 459 E 166th St | 0.44mi | 4/2.0 (+1) | 1,300 (+8%) | 1mo | $235,000 | $181 | 58 |
| 509 E 161st Pl | 0.72mi | 3/2.0 | 1,176 (-2%) | 4mo | $182,000 | $155 | 57 |
| 112 E 160th Pl | 0.68mi | 3/2.0 | 1,141 (-5%) | 2mo | $210,000 | $184 | 57 |
| 16914 Parkside Ave | 0.70mi | 4/2.0 (+1) | 1,187 (-1%) | 3mo | $224,700 | $189 | 56 |
| 16721 School St | 0.64mi | 3/1.5 | 1,344 (+12%) | 3mo | $102,000 | $76 | 48 |
Match score weights: distance 35% · size 25% · config 20% · recency 20%. Top-matched comps best support the ARV.
Projected returns pro-forma
-3.0% appreciation · 3.0% rent growth · sell at horizon
- IRR
- -5.7%
- Equity multiple
- 0.79×
- Total profit
- $-12,551
- Equity at exit
- $31,684
- IRR
- 4.2%
- Equity multiple
- 1.31×
- Total profit
- $18,177
- Equity at exit
- $18,373
Cash invested: $59,500 (down + closing). Projections, not guarantees.
Landlord ↔ Tenant lean methodology
- Overall (STATE)
- 43 Moderately Tenant-Leaning
- State Illinois
- 43 Moderately Tenant-Leaning · D+7
- County
- — inherits STATE
- City
- — inherits STATE
ZIP-level market 60473
- Active inventory
- 135
- Price-to-rent
- 6.1×
Monthly cashflow live
- Estimated rent
- $2,887 medium interval (Pro) →
- Mortgage (P&I)
- −$1,114
- Tax from tax record
- −$739 /mo · $8,869/yr
- Insurance
- −$89
- HOA
- −$0
- Vacancy / Maint / Mgmt
- −$606
- Net cashflow
- $338
Break-even live
Sensitivity live
| Price | -10% $459 | -5% $398 | +0% $338 | +5% $278 | +10% $218 |
|---|---|---|---|---|---|
| Rent | -10% $110 | -5% $224 | +0% $338 | +5% $452 | +10% $566 |
| Rate | -1.0pp $445 | -0.5pp $392 | base $338 | +0.5pp $283 | +1.0pp $227 |
UW: 25.0% down · 7.5% · 30yr · 1.5% tax · 5.0% vac · 8.0% maint · 8.0% mgmt
Financing live
Cash to close
- Down payment
- $53,125
- Closing costs
- $6,375
- Reserves months
- —
- Total cash needed
- —
Loan-product check · same deal, 3 products live
Conventional
25% down · 7.5% · 30yr
- Down + closing
- —
- Monthly P&I
- —
- Monthly cashflow
- —
- DSCR
- —
- Eligible?
- —
Personal DTI + credit; lowest rate.
DSCR
20% down · 8.5% · 30yr
- Down + closing
- —
- Monthly P&I
- —
- Monthly cashflow
- —
- DSCR
- —
- Eligible?
- —
No personal income docs; deal must DSCR.
Hard money
10% down · 12.0% · 12mo
- Down + closing
- —
- Monthly P&I
- —
- Monthly cashflow
- —
- DSCR
- —
- Eligible?
- —
Short-term bridge; refi at stabilization.
Rent comps 4 comps
| Address | Beds | Baths | Sqft | Rent | $/sqft | DOM | Units | Dist |
|---|---|---|---|---|---|---|---|---|
| 16246 Dobson Ave South Holland, IL | 3.0 | 2.0 | 1250 | $3,170 | $2.54 | 2d | 1 | 1.18mi |
| 16048 Halsted St Unit 2 Harvey, IL | 3.0 | 1.0 | 1091 | $1,650 | $1.51 | 25d | 1 | 1.20mi |
| 15509 Park Ln South Holland, IL | 4.0 | 1.5 | 1200 | $3,400 | $2.83 | 25d | 1 | 1.46mi |
| 15509 Park Ln South Holland, IL | 4.0 | 1.5 | 1200 | $3,400 | $2.83 | 8d | 1 | 1.46mi |
Listing history 29 events
-
2026-06-18days on market $212,500 Active 31 DOM
-
2026-06-17days on market $212,500 Active 30 DOM
-
2026-06-16days on market $212,500 Active 29 DOM
-
2026-06-15days on market $212,500 Active 28 DOM
-
2026-06-13days on market $212,500 Active 26 DOM
-
2026-06-13pricedays on market $212,500 Active 25 DOM
-
2026-06-09days on market $219,900 Active 22 DOM
-
2026-06-08days on market $219,900 Active 21 DOM
-
2026-06-07days on market $219,900 Active 20 DOM
-
2026-06-04days on market $219,900 Active 17 DOM
-
2026-06-03days on market $219,900 Active 16 DOM
-
2026-06-02days on market $219,900 Active 15 DOM
-
2026-06-01days on market $219,900 Active 14 DOM
-
2026-05-31days on market $219,900 Active 13 DOM
-
2026-05-18$219,900 Active
-
2026-05-18historical
-
2026-05-11price
-
2026-04-28price
-
2026-04-10status Active
-
2026-04-09historical
-
2017-05-26soldstatus $935,000
-
2010-04-14soldstatus $65,500 Closed Sale 393-char remark
Show marketing remark (393 chars)
3 bedroom 1.5 bath tri-level. VACANT & EASY TO SHOW. Bank Owned, sold as-is where-is. NO DISCLOSURES/NO SURVEYS / NO TERMITE PROVIDED BY SELLER. BUYER RESPONSIBLE FOR ALL CITY AND COUNTY INSPECTIONS, REPAIRS AND ESCROWS AS NEEDED. ALL OFFERS MUST BE FAXED WITH PRE-QUAL OR POF TO LO. WITH ADDENDUMS. BUYER TO VERIFY RM COUNT & DIM. EM MUST BE CASHIERS CK. ALLOW TIME FOR RESPONSE.
-
2010-03-09status Pending 393-char remark
Show marketing remark (393 chars)
3 bedroom 1.5 bath tri-level. VACANT & EASY TO SHOW. Bank Owned, sold as-is where-is. NO DISCLOSURES/NO SURVEYS / NO TERMITE PROVIDED BY SELLER. BUYER RESPONSIBLE FOR ALL CITY AND COUNTY INSPECTIONS, REPAIRS AND ESCROWS AS NEEDED. ALL OFFERS MUST BE FAXED WITH PRE-QUAL OR POF TO LO. WITH ADDENDUMS. BUYER TO VERIFY RM COUNT & DIM. EM MUST BE CASHIERS CK. ALLOW TIME FOR RESPONSE.
-
2010-02-10price $65,000 Price Change 393-char remark
Show marketing remark (393 chars)
3 bedroom 1.5 bath tri-level. VACANT & EASY TO SHOW. Bank Owned, sold as-is where-is. NO DISCLOSURES/NO SURVEYS / NO TERMITE PROVIDED BY SELLER. BUYER RESPONSIBLE FOR ALL CITY AND COUNTY INSPECTIONS, REPAIRS AND ESCROWS AS NEEDED. ALL OFFERS MUST BE FAXED WITH PRE-QUAL OR POF TO LO. WITH ADDENDUMS. BUYER TO VERIFY RM COUNT & DIM. EM MUST BE CASHIERS CK. ALLOW TIME FOR RESPONSE.
-
2010-01-11price $70,100 Price Change 393-char remark
Show marketing remark (393 chars)
3 bedroom 1.5 bath tri-level. VACANT & EASY TO SHOW. Bank Owned, sold as-is where-is. NO DISCLOSURES/NO SURVEYS / NO TERMITE PROVIDED BY SELLER. BUYER RESPONSIBLE FOR ALL CITY AND COUNTY INSPECTIONS, REPAIRS AND ESCROWS AS NEEDED. ALL OFFERS MUST BE FAXED WITH PRE-QUAL OR POF TO LO. WITH ADDENDUMS. BUYER TO VERIFY RM COUNT & DIM. EM MUST BE CASHIERS CK. ALLOW TIME FOR RESPONSE.
-
2009-12-09price $79,900 Price Change 393-char remark
Show marketing remark (393 chars)
3 bedroom 1.5 bath tri-level. VACANT & EASY TO SHOW. Bank Owned, sold as-is where-is. NO DISCLOSURES/NO SURVEYS / NO TERMITE PROVIDED BY SELLER. BUYER RESPONSIBLE FOR ALL CITY AND COUNTY INSPECTIONS, REPAIRS AND ESCROWS AS NEEDED. ALL OFFERS MUST BE FAXED WITH PRE-QUAL OR POF TO LO. WITH ADDENDUMS. BUYER TO VERIFY RM COUNT & DIM. EM MUST BE CASHIERS CK. ALLOW TIME FOR RESPONSE.
-
2009-11-14$89,900 New 393-char remark
Show marketing remark (393 chars)
3 bedroom 1.5 bath tri-level. VACANT & EASY TO SHOW. Bank Owned, sold as-is where-is. NO DISCLOSURES/NO SURVEYS / NO TERMITE PROVIDED BY SELLER. BUYER RESPONSIBLE FOR ALL CITY AND COUNTY INSPECTIONS, REPAIRS AND ESCROWS AS NEEDED. ALL OFFERS MUST BE FAXED WITH PRE-QUAL OR POF TO LO. WITH ADDENDUMS. BUYER TO VERIFY RM COUNT & DIM. EM MUST BE CASHIERS CK. ALLOW TIME FOR RESPONSE.
-
1994-10-11soldstatus $85,000
-
1977-02-16soldstatus $45,000
ⓘ Source: listings_history table (triggers on properties + properties_extension) + one-shot
backfill from property_details.listing_events for pre-trigger history.
Tax reassessment forecast IL · Partial reset (capped growth)
- Current annual tax
- $8,869 · $739/mo
- Projected year-2 tax
- $8,869 · $739/mo
- Expected delta
- $0/yr ($0/mo · 0.0%)
ⓘ Screening estimate from a state-policy table — verify with the county assessor before closing.
Climate risk First Street
- Flood 5/10 Major FEMA zone X (unshaded) · 67% chance over 30 yrs
- Wildfire 1/10 Low
- Heat 3/10 Moderate 7 d/yr ≥102°F today · 15 d/yr by 30 yrs out
- Wind 2/10 Low
- Air quality 4/10 Moderate 4 unhealthy d/yr today · 5 by 30 yrs out
Nearby sold comps map
Loading sold comps map…
Walkable amenities ~0.75 mi
Loading nearby amenities…
Taxation est. · year 1
- Rental income
- $34,638
- − Mortgage interest
- −$11,903
- − Property taxes
- −$8,869
- − Insurance
- −$1,062
- − Repairs & maintenance
- −$2,771
- − Management
- −$2,771
- − Depreciation
- −$6,182
- Taxable income
- $1,079
- Est. tax owed @ 24.0%
- −$259
- After-tax cash flow
- $3,801/yr
For passive investors: Depreciation is non-cash, so a rental often shows a tax loss while cash-flowing — sheltering income. Rental losses are passive: they offset passive income freely, and up to $25,000/yr can offset ordinary (W-2) income if you actively participate and your MAGI is under $100k (phasing out to $0 by $150k); unused losses carry forward. On sale, claimed depreciation is recaptured at up to 25%, and gains may owe capital-gains tax (a 1031 exchange can defer both). Figures are a year-1 estimate at your 24.0% rate — not tax advice; consult a CPA.
Schools (NCES district)
- District
- Thornton Twp Hsd 205
- NCES district ID
- 1738970
- Math proficiency
- 7% ▬ 0.00%
- Reading proficiency
- 8% ▼ -2.00%
- Median HH income
- $43,392
- Composite
- 6.92/100
- National rank
- #9976
- State rank
- #594 of 620 in IL
Livability — South Holland
- Score
- 77/100
- State rank
- #167
- US rank
- #3071
Category grades
Schools grade is shown separately in the Schools card above.
Census & demographics
- Census place
- South Holland, IL
- City population
- 23,066
- Population (ZIP)
- 21,407
Population outlook (Cook County) Hauer SSP2
- Today (2025)
- 5,347,519 people
- By 2030
- 5,357,703 · +0.2%
- By 2040
- 5,324,924 · -0.4%
- By 2050
- 5,230,762 · -2.2%
- By 2075
- 4,785,735 · -10.5%
- By 2100
- 4,188,836 · -21.7%
Race, ethnicity, and origin ACS 2023
- Neighborhood character
- Predominantly Black (75%)
- Race & ethnicity
- Black 75% White 10% Hispanic / Latino 10% Two or more races 3% Asian 1%
- Hispanic origin (detail)
- Mexican 9% Puerto Rican 1%
- Common ancestry
- Iranian 3% Romanian 2%
- Foreign-born
- 6% · Canada, China
- Languages at home
- 87% English-only · Spanish 8% Other Asian/Pacific 1% Russian/Polish/Slavic 1%
Political lean MEDSL · Cook
- 2024 margin
- Solid D (+42.0) · D 70.4% · R 28.4% · Other 1.2%
- 2008→2024 swing
- -11.4pp toward R · 2008: 53.4pp · 2024: 42.0pp
- All cycles
- 2024: D+42.0 2020: D+50.3 2016: D+53.0 2012: D+49.4 2008: D+53.4
Not yet ingested
- Civics
- —
Market trends
- HPI YoY
- ▼ -114.36%
- Current HPI
- 201.2479
- Rent YoY
- —
- Metro
- —
- State GDP YoY
- ▲ 1.59%
- F500 in state
- 60
Industry mix (Fortune 500 HQ in IL)
| Industry | F500 HQs | Revenue |
|---|---|---|
| Insurance | 4 | $201B |
|
||
| Consumer Goods | 4 | $87B |
|
||
| Industrial Machinery | 3 | $64B |
|
||
| Healthcare | 2 | $55B |
|
||
| Retail / Pharmacy | 1 | $148B |
|
||
| Agriculture / Food | 1 | $86B |
|
||
Price history
+388.7% since first listed15 events — show timeline
- 2026-05-18 Listing Removed — MRED as Distributed by MLS Grid
- 2026-05-18 Listed $219,900 MRED as Distributed by MLS Grid
- 2026-05-11 Price Changed — MRED as Distributed by MLS Grid
- 2026-04-28 Price Changed — MRED as Distributed by MLS Grid
- 2026-04-10 Relisted — MRED as Distributed by MLS Grid
- 2026-04-09 Listing Removed — MRED as Distributed by MLS Grid
- 2017-05-26 Sold (Public Records) $935,000 Public Records
- 2010-04-14 Sold (MLS) $65,500 MRED as Distributed by MLS Grid
- 2010-03-09 Pending — MRED as Distributed by MLS Grid
- 2010-02-10 Price Changed $65,000 MRED as Distributed by MLS Grid
- 2010-01-11 Price Changed $70,100 MRED as Distributed by MLS Grid
- 2009-12-09 Price Changed $79,900 MRED as Distributed by MLS Grid
- 2009-11-14 Listed $89,900 MRED as Distributed by MLS Grid
- 1994-10-11 Sold (Public Records) $85,000 Public Records
- 1977-02-16 Sold (Public Records) $45,000 Public Records
Property tax history
+3.4%/yrLatest (2023): $8,869 · +8.0% YoY. Source: county tax records.
Cash-flow waterfall
monthlySold comps — $/sqft
last 12 mo · ≤1 miLoading sold comps…