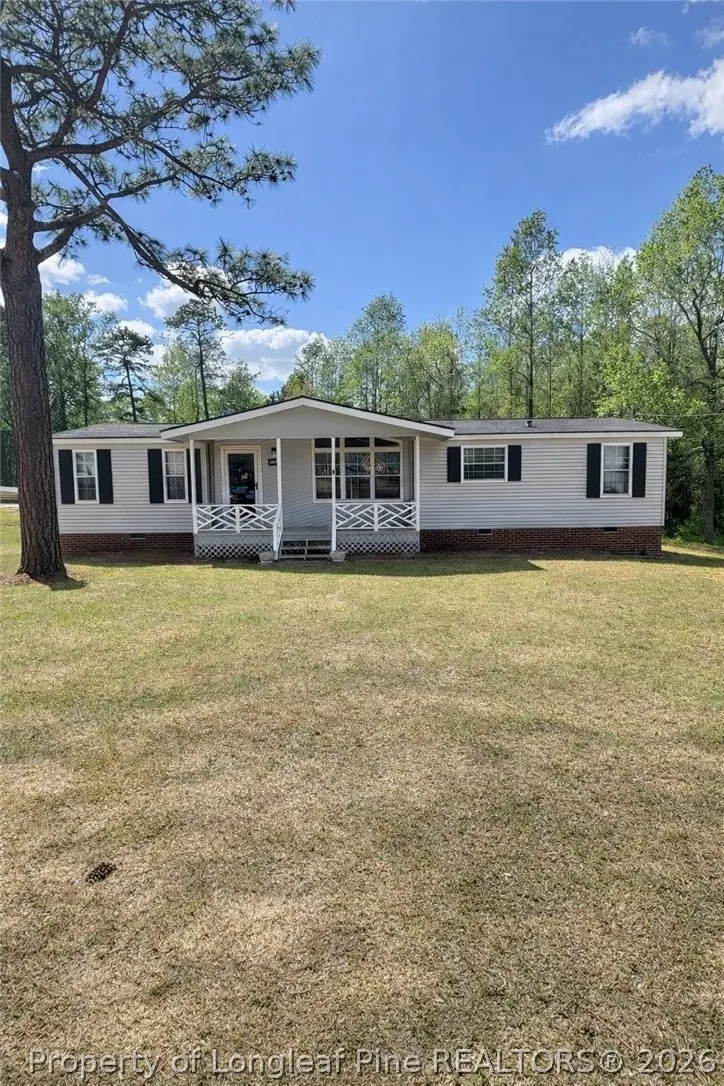
6740 Pine Lane Ln · Hope Mills, NC
Flood risk No data
- FEMA flood zone
- —
- Chance of flooding over 30 yrs
- —
- Est. flood insurance / yr
- —
Fire risk No data
- Est. fire insurance / yr
- —
Heat risk No data
- Hot days now (above threshold)
- —
- Hot days in 30 yrs
- —
Wind risk No data
- Chance of severe wind over 30 yrs
- —
Air-quality risk No data
- Unhealthy air days now
- —
- Unhealthy air days in 30 yrs
- —
Risk factors via First Street. Map © Google.
Why this score? — see what drove the B+ grade
The composite is a weighted blend of 9 inputs, each scored 0–100. Each bar is that input's sub-score; the figure is the points it added to the 100-point composite (weight × sub-score).
- Cash flow +30.0/30.0
- DSCR +10.0/10.0
- Appreciation +10.0/10.0
- 1% rule +9.3/10.0
- ARV discount +7.5/15.0
- Livability +3.4/5.0
- Schools +3.1/10.0
- Rent growth +2.5/5.0
- Condition / age +2.5/5.0
$182,000
🖨 Deal sheet 📄 Offer letter ✓ Due diligence
Listing remarks
Fully Renovated 3BR/2BA with 1880 square feet of living — Move-In Ready or Perfect Investment Opportunity Step into this beautifully updated 3-bedroom, 2-bath home that feels brand new from top to bottom. Every detail has been thoughtfully upgraded to offer comfort, style, and functionality. Property Highlights: Fully renovated interior, Whole house freshly painted, Brand-new carpet and modern flooring throughout, New stainless-steel appliances, Fresh cabinets with a clean, contemporary look, Spacious bedrooms with ceiling fans in every room, Huge primary suite featuring a separate shower, soaking tub, and generous layout, Bright, open living spaces perfect for relaxing or enterta
Key facts
- Large back deck
- Huge primary suite
- Fresh cabinets
Tags
Neighborhood map
What this means for you Summary
Snapshot
- This is a 3-bed/2.0-bath manufactured listed at $182k.
Deal economics
- At list price, monthly cash flow is $875 ($10k/yr) — positive.
- The deal already cash-flows at list — no discount required.
- Meets the 1% rule at list price ($3k rent vs $182k).
- Recommended offer: $179k (1.5% below list) — sets the bar for market timing.
- Cap rate 12.1% vs local median 4.8% in Hope Mills — top-decile yield for the area; either an underpriced asset or a hidden risk that comps aren't pricing in. Stress-test before assuming the spread holds.
Location & tenants
- Location reads 67/100 on livability (#234 in NC) — a middle-class / working-renter tenant base. Strengths: cost of living A+, housing A+, health & safety B+; Watch: crime D-, amenities F, commute F.
- Cumberland County Schools (urban): math 32% / reading 41% proficiency, ranked #126 of 178 in NC (top 71%) — families likely to look elsewhere, expect single-tenant / working-renter base with shorter leases.
- Zoned schools: Hope Mills Middle (math 27% / reading 34%, grade F, #331 of 475 statewide, top 70%, 514 students, 99% FRL); South View High (math 60% / reading 43%, grade D+, #299 of 535 statewide, top 56%, 1,502 students, 66% FRL) — zoned schools average 83% FRL vs 55% district-wide (28 pts higher); higher-poverty schools than district average — tighter screening recommended.
- Market conditions: 44 active listings in the ZIP; 4 comparable units currently listed for rent nearby; rentals at typical pace (median 24d on market — plan ~3-4 weeks tenant-placement turnaround); 1,125 units permitted in Cumberland County in 2024 (104 in 5+ unit buildings).
Forward outlook
- In year one you build about $19k of equity ($1k loan paydown + $18k appreciation (10.0% local appreciation)).
- At projected returns (10.0% appreciation + 3.0% rent growth), your $51k cash investment doubles in ~2 years — after that, you're playing with house money.
- By year 2, paydown + projected appreciation supports a ~$31k cash-out refi (75% LTV) — recoverable capital for the next deal without selling this one.
Negotiation context
- It's been on market 16 days — a 2% lower offer ($179k) is reasonable based on typical stale-listing flexibility.
- Current owner paid $70k; list at $182k implies a 158% gain — meaningful room to come down on a strong offer.
Questions for the listing agent
- Is there a deadline driving the sale (1031 exchange, divorce, estate, relocation)? That informs how much negotiation room exists.
- Schools are D-rated, which usually means shorter tenancies and higher turnover. Who's the typical renter profile here, and what's been the actual vacancy rate?
- Crime grade is D in this area — have there been break-ins, vandalism, or insurance claims at this property in the last 3 years? What carrier currently insures it and at what premium?
- What's the average days-on-market for RENTAL listings here right now (not sales)? A rising rental-DOM trend means longer vacancies and softer asking-rent achievability than the comps imply.
- What's the recent tenant-quality profile in this submarket — average credit score on applications, eviction rate, late-payment / NSF rate, and stable-employment percentage? A property-management company in the area should have these aggregated.
- How much new for-sale + rental construction is in the pipeline within 1–3 miles? Heavy new supply typically softens prices + rents 12–24 months out; constrained supply supports both.
Investment metrics
- 1% rule
- 1.43% ✓
- Cap rate
- 12.06%
- Cash-on-cash
- 20.60%
- DSCR
- 1.92
- GRM
- 5.8
CMA / ARV
- ARV (on-the-fly)
- $182,069
- Comps found
- 1
Show comp detail 1 sale within ~0.75 mi
| Address | Dist | Beds/Ba | Sqft | Sold | Price | $/sf | Match |
|---|---|---|---|---|---|---|---|
| 4725 Star Rite Ln | 0.52mi | 3/2.5 | 1,782 (-5%) | 18mo | $173,000 | $97 | 51 |
Match score weights: distance 35% · size 25% · config 20% · recency 20%. Top-matched comps best support the ARV.
Projected returns pro-forma
10.0% appreciation · 3.0% rent growth · sell at horizon
- IRR
- 39.7%
- Equity multiple
- 4.04×
- Total profit
- $154,822
- Equity at exit
- $163,960
- IRR
- 34.2%
- Equity multiple
- 9.09×
- Total profit
- $412,107
- Equity at exit
- $353,586
Cash invested: $50,960 (down + closing). Projections, not guarantees.
Landlord ↔ Tenant lean methodology
- Overall (STATE)
- 85 Strongly Landlord-Friendly
- State North Carolina
- 85 Strongly Landlord-Friendly · R+3
- County
- — inherits STATE
- City
- — inherits STATE
ZIP-level market 28371
- Home prices YoY
- 5.0%
- Active inventory
- 44
- Price-to-rent
- 5.8×
Monthly cashflow live
- Estimated rent
- $2,606 medium interval (Pro) →
- Mortgage (P&I)
- −$954
- Tax from tax record
- −$154 /mo · $1,846/yr
- Insurance
- −$76
- HOA
- −$0
- Vacancy / Maint / Mgmt
- −$547
- Net cashflow
- $875
Break-even live
UW: 25.0% down · 7.5% · 30yr · 1.5% tax · 5.0% vac · 8.0% maint · 8.0% mgmt
Financing live
Cash to close
- Down payment
- $45,500
- Closing costs
- $5,460
- Reserves months
- —
- Total cash needed
- —
Loan-product check · same deal, 3 products live
Conventional
25% down · 7.5% · 30yr
- Down + closing
- —
- Monthly P&I
- —
- Monthly cashflow
- —
- DSCR
- —
- Eligible?
- —
Personal DTI + credit; lowest rate.
DSCR
20% down · 8.5% · 30yr
- Down + closing
- —
- Monthly P&I
- —
- Monthly cashflow
- —
- DSCR
- —
- Eligible?
- —
No personal income docs; deal must DSCR.
Hard money
10% down · 12.0% · 12mo
- Down + closing
- —
- Monthly P&I
- —
- Monthly cashflow
- —
- DSCR
- —
- Eligible?
- —
Short-term bridge; refi at stabilization.
Rent comps 4 comps
| Address | Beds | Baths | Sqft | Rent | $/sqft | DOM | Units | Dist |
|---|---|---|---|---|---|---|---|---|
| 101 Bayview Cir Parkton, NC | 3.0 | 2.0 | 1875 | $2,750 | $1.47 | 23d | 1 | 0.18mi |
| 4032 Newgate St Fayetteville, NC | 4.0 | 2.5 | 2209 | $2,750 | $1.24 | 23d | 1 | 1.15mi |
| 2827 Aristocrat Ln Fayetteville, NC | 3.0 | 2.0 | 1837 | $1,950 | $1.06 | 23d | 1 | 1.27mi |
| 3831 Queen Anne Loop Fayetteville, NC | 2.0–3.0 | 2.0 | 1274 | $1,743 | $1.37 | 14d | 7 | 1.43mi |
Listing history 4 events
-
2026-04-21status Pending
-
2026-04-16price $182,000
-
2026-04-04$184,999 Active
-
1993-11-24soldstatus $70,500
ⓘ Source: listings_history table (triggers on properties + properties_extension) + one-shot
backfill from property_details.listing_events for pre-trigger history.
Tax reassessment forecast NC · Resets to sale price
- Current annual tax
- $1,846 · $154/mo
- Projected year-2 tax
- $1,846 · $154/mo
- Expected delta
- $0/yr ($0/mo · 0.0%)
ⓘ Screening estimate from a state-policy table — verify with the county assessor before closing.
Nearby sold comps map
Loading sold comps map…
Walkable amenities ~0.75 mi
Loading nearby amenities…
Taxation est. · year 1
- Rental income
- $31,272
- − Mortgage interest
- −$10,195
- − Property taxes
- −$1,846
- − Insurance
- −$910
- − Repairs & maintenance
- −$2,502
- − Management
- −$2,502
- − Depreciation
- −$5,295
- Taxable income
- $8,023
- Est. tax owed @ 24.0%
- −$1,926
- After-tax cash flow
- $8,570/yr
For passive investors: Depreciation is non-cash, so a rental often shows a tax loss while cash-flowing — sheltering income. Rental losses are passive: they offset passive income freely, and up to $25,000/yr can offset ordinary (W-2) income if you actively participate and your MAGI is under $100k (phasing out to $0 by $150k); unused losses carry forward. On sale, claimed depreciation is recaptured at up to 25%, and gains may owe capital-gains tax (a 1031 exchange can defer both). Figures are a year-1 estimate at your 24.0% rate — not tax advice; consult a CPA.
Schools (NCES district)
- District
- Cumberland County Schools
- NCES district ID
- 3700011
- Math proficiency
- 32% ▼ -2.00%
- Reading proficiency
- 41% ▼ -1.00%
- Median HH income
- $44,168
- Composite
- 31.0/100
- National rank
- #6096
- State rank
- #126 of 178 in NC
Livability — Hope Mills
- Score
- 67/100
- State rank
- #234
- US rank
- #10761
Category grades
Schools grade is shown separately in the Schools card above.
Census & demographics
- City population
- 39,196
- Population (ZIP)
- 6,458
Population outlook (Cumberland County) Hauer SSP2
- Today (2025)
- 330,855 people
- By 2030
- 333,523 · +0.8%
- By 2040
- 335,583 · +1.4%
- By 2050
- 335,325 · +1.4%
- By 2075
- 342,853 · +3.6%
- By 2100
- 340,698 · +3.0%
Race, ethnicity, and origin ACS 2023
- Neighborhood character
- Diverse neighborhood (Simpson 0.69)
- Race & ethnicity
- White 42% Black 34% Hispanic / Latino 14% Two or more races 8% Native American 4%
- Hispanic origin (detail)
- Mexican 5% Puerto Rican 4%
- Common ancestry
- Serbian 3% Italian 2% Slovak 2%
- Foreign-born
- 6% · Canada, Vietnam
- Languages at home
- 91% English-only · Spanish 7% German/W. Germanic 1%
Political lean MEDSL · Cumberland
- 2024 margin
- D (+13.4) · D 56.1% · R 42.7% · Other 1.2%
- 2008→2024 swing
- -4.3pp toward R · 2008: 17.7pp · 2024: 13.4pp
- All cycles
- 2024: D+13.4 2020: D+16.6 2016: D+16.0 2012: D+19.7 2008: D+17.7
Not yet ingested
- Civics
- —
Market trends
- HPI YoY
- ▲ 15.91%
- Current HPI
- 330.85
- Rent YoY
- —
- Metro
- —
- State GDP YoY
- ▲ 3.28%
- F500 in state
- 26
Industry mix (Fortune 500 HQ in NC)
| Industry | F500 HQs | Revenue |
|---|---|---|
| Financial Services | 2 | $213B |
|
||
| Retail | 2 | $95B |
|
||
| Industrial Conglomerate | 1 | $38B |
|
||
| Metals / Steel | 1 | $35B |
|
||
| Utilities | 1 | $30B |
|
||
| Industrial Machinery | 1 | $19B |
|
||
Price history
+158.2% since first listed4 events — show timeline
- 2026-04-21 Pending — LPRMLS
- 2026-04-16 Price Changed $182,000 LPRMLS
- 2026-04-04 Listed $184,999 LPRMLS
- 1993-11-24 Sold (Public Records) $70,500 Public Records
Property tax history
+8.3%/yrLatest (2024): $1,846 · +10.8% YoY. Source: county tax records.
Cash-flow waterfall
monthlySold comps — $/sqft
last 12 mo · ≤1 miLoading sold comps…