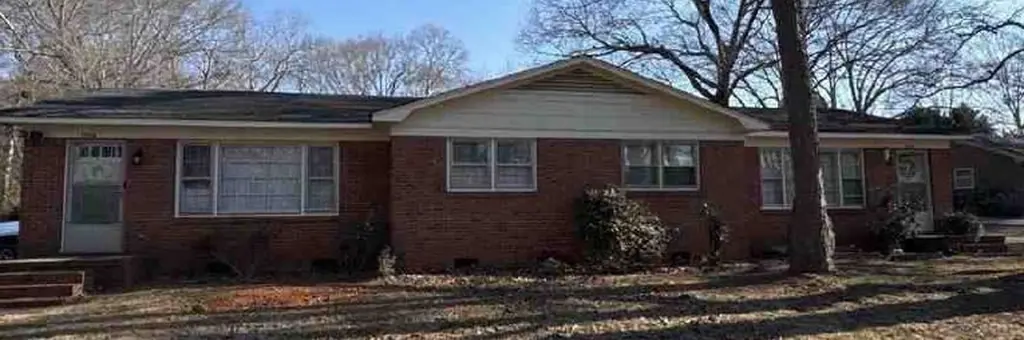
 Duplex
2056 Pineview Dr Unit *** · Spartanburg, SC
Flood risk 1/10 · Minimal
- FEMA flood zone
- X (unshaded)
- Chance of flooding over 30 yrs
- 0.0%
- Est. flood insurance / yr
- $507 – $1,088
Fire risk 4/10 · Minor
- Est. fire insurance / yr
- $783 – $1,453
Heat risk 5/10 · Moderate
- Hot days now (above 105°F)
- 7 days/yr
- Hot days in 30 yrs
- 16 days/yr
Wind risk 2/10 · Minimal
- Chance of severe wind over 30 yrs
- 2.0%
Air-quality risk 4/10 · Minor
- Unhealthy air days now
- 4 days/yr
- Unhealthy air days in 30 yrs
- 4 days/yr
Risk factors via First Street. Map © Google.
Why this score? — see what drove the D grade
The composite is a weighted blend of 9 inputs, each scored 0–100. Each bar is that input's sub-score; the figure is the points it added to the 100-point composite (weight × sub-score).
- Cash flow +15.3/30.0
- ARV discount +7.5/15.0
- DSCR +4.7/10.0
- 1% rule +4.2/10.0
- Livability +3.8/5.0
- Schools +3.1/10.0
- Rent growth +2.7/5.0
- Condition / age +2.2/5.0
- Appreciation +0.0/10.0
$245,000
🖨 Deal sheet (PDF) 📄 Offer letter ✓ Due diligence
Multi-family units
County records classify this as Multi-Family (5+ Unit). Listing-text estimate: 2 units. estimate disagrees with records
5+ unit building — per-unit beds/baths from public records are typically unavailable; the breakdown below (if shown) is an estimate from the listing text.
Listing remarks
Investor Opportunity – Turnkey Duplex! Welcome to 2056-2058 Pineview Drive in Spartanburg— a well-maintained duplex. Each unit features 2 bedrooms and 1 full bathroom with approximately 972 square feet per side, providing comfortable and functional living space for tenants. Unit’s features include: central heat and air, dishwasher, range, refrigerator, storage, washer & dryer connections. Whether you're looking to expand your rental portfolio or step into your first investment property, this duplex offers strong income potential in a high-demand Spartanburg Eastside rental area. Don’t miss your chance to own a great multi-family property in Spartanburg conveni
Key facts
- Storage
- Turnkey duplex
- Central heat and air
Tags
Property features AI
Exterior
- Utilities: Public water; Septic sewer
- Home design: Duplex residential income property; One story
- Construction: Brick veneer exterior
- Exterior features: Composition roof; Lot approximately 1.18 acres; Irregular lot dimensions
Interior
- Heating & cooling: Heat pump; Forced air heating; Ceiling heating; Electric cooling
- Interior features: Electric water heater
Neighborhood map
What this means for you Summary
Snapshot
- This is a 2 × 2-bed/1-bath units multifamily listed at $245k. Condition is rated fair.
Deal economics
- At list price, monthly cash flow is $88 ($1k/yr) — positive. Per door: $44/mo.
- The deal already cash-flows at list — no discount required.
- To meet the 1% rule (rent ≥ 1% of price), the offer needs to be $226k (8.0% below list).
- Recommended offer: $226k (8.0% below list) — sets the bar for 1% rule.
- Cap rate 6.7% vs local median 3.9% in Spartanburg — top-decile yield for the area; either an underpriced asset or a hidden risk that comps aren't pricing in. Stress-test before assuming the spread holds.
Location & tenants
- Location reads 76/100 on livability (#24 in SC, #3,679 nationally) — a middle-class / working-renter tenant base. Strengths: amenities A+, commute A+, cost of living A+; Watch: crime F, employment F.
- Spartanburg 07 (urban): math 34% / reading 41% proficiency, ranked #39 of 80 in SC (top 49%) — families likely to look elsewhere, expect single-tenant / working-renter base with shorter leases; 62% free/reduced lunch — lower-income household profile, screen leases tightly.
- Zoned schools: Jesse Boyd Elementary (math 52% / reading 57%, grade C, #123 of 597 statewide, top 22%, 495 students, 57% FRL); Mccracken Middle (math 41% / reading 49%, grade D, #48 of 229 statewide, top 22%, 926 students, 78% FRL); Spartanburg High (math 67% / reading 79%, grade B+, #44 of 196 statewide, top 23%, 2,056 students, 85% FRL).
- Zoned-school proficiency averages 58% at this address vs 38% district-wide (+20 pts) — the actual schools serving this property are materially stronger than the Spartanburg 07 average implies; a family-tenant draw the district grade alone would hide.
- Market conditions: Rents flat; 276 active listings in the ZIP; 2 comparable units currently listed for rent nearby; 3,129 units permitted in Spartanburg County in 2024 (40 in 5+ unit buildings).
- This rent runs 41% of the median local income ($66k/yr) — at the standard rent-burdened threshold; future hikes will face affordability resistance.
Forward outlook
- Local home prices are declining (-3.0%/yr); year-one equity from $2k of loan paydown is wiped out by about $7k of value loss. Plan a longer hold.
- Spartanburg County population projected at +18% by 2050 — long-run rental-demand tailwind backs the buy-and-hold thesis.
Negotiation context
- It's been on market 25 days — a 2% lower offer ($241k) is reasonable based on typical stale-listing flexibility.
- 2 sale attempts; this cycle's ask has dropped $15k (6%) from the opening price — seller is motivated, your offer sets the floor, not the list.
Risks & watch-outs
- Climate carrying-cost: extreme-heat days projected 7→16/yr by 2055 (HVAC capex compounding) — expect insurance premiums to compound above CPI over the hold.
Questions for the listing agent
- Can we see the unit-by-unit rent roll, current vacancy, and any below-market leases? What's the average tenancy length?
- What capital expenditures (roof, boiler, parking lot, exteriors) have been made in the last 5 years, and what's planned in the next 2?
- Have any recent inspections been done? Can we get a copy of the seller's disclosures and any deferred-maintenance estimates?
- Built in 1974 — when were the roof, HVAC, electrical panel, plumbing, and water heater last replaced?
- Is there a deadline driving the sale (1031 exchange, divorce, estate, relocation)? That informs how much negotiation room exists.
- Schools are D-rated, which usually means shorter tenancies and higher turnover. Who's the typical renter profile here, and what's been the actual vacancy rate?
- Crime grade is F in this area — have there been break-ins, vandalism, or insurance claims at this property in the last 3 years? What carrier currently insures it and at what premium?
- The area grade is low — what's the realistic commute time and amenity access for the typical tenant pool here? Any planned neighborhood developments (good or bad) we should know about?
- What's the average days-on-market for RENTAL listings here right now (not sales)? A rising rental-DOM trend means longer vacancies and softer asking-rent achievability than the comps imply.
- What's the recent tenant-quality profile in this submarket — average credit score on applications, eviction rate, late-payment / NSF rate, and stable-employment percentage? A property-management company in the area should have these aggregated.
- How much new apartment / multifamily construction is in the pipeline within 1–3 miles? Heavy new supply (>2% of stock underway) typically softens rents 12–24 months out; light construction supports rent growth.
Investment metrics
- 1% rule
- 0.92% ✗
- Cap rate
- 6.73%
- Cash-on-cash
- 1.54%
- DSCR
- 1.07
- GRM
- 9.1
CMA / ARV
No comps found within radius.
Projected returns pro-forma
-3.0% appreciation · 0.64% rent growth · sell at horizon
- IRR
- -16.5%
- Equity multiple
- 0.43×
- Total profit
- $-39,274
- Equity at exit
- $36,530
- IRR
- -13.2%
- Equity multiple
- 0.31×
- Total profit
- $-47,293
- Equity at exit
- $21,183
Cash invested: $68,600 (down + closing). Projections, not guarantees.
Landlord ↔ Tenant lean methodology
- Overall (STATE)
- 90 Strongly Landlord-Friendly
- State South Carolina
- 90 Strongly Landlord-Friendly · R+6
- County
- — inherits STATE
- City
- — inherits STATE
ZIP-level market 29307
- Home prices YoY
- -17.7%
- Rents YoY
- 0.6%
- Active inventory
- 276
- Price-to-rent
- 18.1×
Monthly cashflow live
- Estimated rent
- $2,255 medium interval (Pro) →
- Mortgage (P&I)
- −$1,285
- Tax est. 1.5%
- −$306 /mo · $3,675/yr
- Insurance
- −$102
- HOA
- −$0
- Vacancy / Maint / Mgmt
- −$474
- Net cashflow
- $88
Break-even live
Sensitivity live
| Price | -10% $258 | -5% $173 | +0% $88 | +5% $4 | +10% $-81 |
|---|---|---|---|---|---|
| Rent | -10% $-90 | -5% $-1 | +0% $88 | +5% $177 | +10% $266 |
| Rate | -1.0pp $212 | -0.5pp $151 | base $88 | +0.5pp $25 | +1.0pp $-40 |
2-unit breakdown (identical units grouped — click to expand)
| Units | Beds | Baths | Est. rent |
|---|---|---|---|
| 2× units | 2 | 1 | $2,254 |
| #1 | 2 | 1 | $1,127 |
| #2 | 2 | 1 | $1,127 |
| Total (2 units) | $2,255 | ||
UW: 25.0% down · 7.5% · 30yr · 1.5% tax · 5.0% vac · 8.0% maint · 8.0% mgmt
Financing live
Cash to close
- Down payment
- $61,250
- Closing costs
- $7,350
- Reserves months
- —
- Total cash needed
- —
Loan-product check · same deal, 3 products live
Conventional
25% down · 7.5% · 30yr
- Down + closing
- —
- Monthly P&I
- —
- Monthly cashflow
- —
- DSCR
- —
- Eligible?
- —
Personal DTI + credit; lowest rate.
DSCR
20% down · 8.5% · 30yr
- Down + closing
- —
- Monthly P&I
- —
- Monthly cashflow
- —
- DSCR
- —
- Eligible?
- —
No personal income docs; deal must DSCR.
Hard money
10% down · 12.0% · 12mo
- Down + closing
- —
- Monthly P&I
- —
- Monthly cashflow
- —
- DSCR
- —
- Eligible?
- —
Short-term bridge; refi at stabilization.
Rent comps 2 comps
| Address | Beds | Baths | Sqft | Rent | $/sqft | DOM | Units | Dist |
|---|---|---|---|---|---|---|---|---|
| 231 Broadway St Glendale, SC | 3.0 | 2.0 | 1799 | $2,200 | $1.22 | 15d | 1 | 0.74mi |
| 1631 Fernwood Glendale Rd Spartanburg, SC | 2.0–3.0 | 1.5 | 1100 | $1,045 | $0.95 | 15d | 1 | 1.45mi |
Listing history 19 events
-
2026-06-21days on market $245,000 Active 25 DOM
-
2026-06-18price $245,000 Active 22 DOM
-
2026-06-18days on market $260,000 Active 22 DOM
-
2026-06-17days on market $260,000 Active 21 DOM
-
2026-06-16days on market $260,000 Active 20 DOM
-
2026-06-15days on market $260,000 Active 19 DOM
-
2026-06-14days on market $260,000 Active 17 DOM
-
2026-06-13days on market $260,000 Active 16 DOM
-
2026-06-10days on market $260,000 Active 14 DOM
-
2026-06-09days on market $260,000 Active 13 DOM
-
2026-06-08days on market $260,000 Active 12 DOM
-
2026-06-07days on market $260,000 Active 11 DOM
-
2026-06-02days on market $260,000 Active 6 DOM
-
2026-06-01days on market $260,000 Active 5 DOM
-
2026-05-31days on market $260,000 Active 4 DOM
-
2026-05-30days on market $260,000 Active 3 DOM
-
2026-05-27$260,000 Active
-
2025-02-07historical $750
-
2025-02-03$750
ⓘ Source: listings_history table (triggers on properties + properties_extension) + one-shot
backfill from property_details.listing_events for pre-trigger history.
Climate risk First Street
- Flood 1/10 Low FEMA zone X (unshaded) · 0% chance over 30 yrs
- Wildfire 4/10 Moderate
- Heat 5/10 Major 7 d/yr ≥105°F today · 16 d/yr by 30 yrs out
- Wind 2/10 Low 2% chance of damaging wind over 30 yrs
- Air quality 4/10 Moderate 4 unhealthy d/yr today · 4 by 30 yrs out
Nearby sold comps map
Loading sold comps map…
Walkable amenities ~0.75 mi
Loading nearby amenities…
Taxation est. · year 1
- Rental income
- $27,060
- − Mortgage interest
- −$13,724
- − Property taxes
- −$3,675
- − Insurance
- −$1,225
- − Repairs & maintenance
- −$2,165
- − Management
- −$2,165
- − Depreciation
- −$7,127
- Taxable loss
- −$3,021
- Est. tax savings @ 24.0%
- +$725
- After-tax cash flow
- $1,785/yr
For passive investors: Depreciation is non-cash, so a rental often shows a tax loss while cash-flowing — sheltering income. Rental losses are passive: they offset passive income freely, and up to $25,000/yr can offset ordinary (W-2) income if you actively participate and your MAGI is under $100k (phasing out to $0 by $150k); unused losses carry forward. On sale, claimed depreciation is recaptured at up to 25%, and gains may owe capital-gains tax (a 1031 exchange can defer both). Figures are a year-1 estimate at your 24.0% rate — not tax advice; consult a CPA.
Condition & rehab AI · 12 photos
This well-maintained but dated duplex requires moderate renovations to improve its curb appeal and interior aesthetics, enhancing both resale and rental value.
Repairs flagged
- Moderate Brick siding — Weathered and in need of repainting
- Moderate Roof — Aged and may need replacement
- Moderate Hardwood flooring — Worn and may need refinishing
- Moderate Paint — Faded and may need repainting
Value-add opportunities
- Both Painting and repainting — Enhances curb appeal and interior aesthetics
- Both Floor refinishing — Improves appearance and value
- Both HVAC replacement — Improves comfort and energy efficiency
- Both Kitchen and bathroom updates — Modernizes spaces and increases value
Renovation cost estimate screening
| Repair item | Severity | Est. cost |
|---|---|---|
| Brick siding · Weathered and in need of repainting | Moderate | $3,000–15,000 |
| Roof · Aged and may need replacement | Moderate | $3,000–15,000 |
| Hardwood flooring · Worn and may need refinishing | Moderate | $3,000–15,000 |
| Paint · Faded and may need repainting | Moderate | $3,000–15,000 |
| Total estimated repair cost · 4 items | $12,000–60,000 |
Value-add ROI direction
- Both Painting and repainting — Enhances curb appeal and interior aesthetics ↑
- Both Floor refinishing — Improves appearance and value ↑
- Both HVAC replacement — Improves comfort and energy efficiency ↑
- Both Kitchen and bathroom updates — Modernizes spaces and increases value ↑
ⓘ Cost ranges are severity-bucket heuristics (US national rule-of-thumb). Get contractor quotes + a written scope before underwriting a rehab budget.
Schools (NCES district)
- District
- Spartanburg 07
- NCES district ID
- 4503660
- Math proficiency
- 34% ▼ -1.00%
- Reading proficiency
- 41% ▼ -1.00%
- Median HH income
- $35,825
- Composite
- 31.04/100
- National rank
- #6087
- State rank
- #39 of 80 in SC
Livability — Spartanburg
- Score
- 76/100
- State rank
- #24
- US rank
- #3679
Category grades
Schools grade is shown separately in the Schools card above.
Census & demographics
- County
- Spartanburg County · 258,607 people
- City population
- 120,406
- Metro
- Spartanburg, SC
- Population (ZIP)
- 19,115
- Household income
- $65,850
- Rent vs Own
- Severe rent burden
- 438.0
Population outlook (Spartanburg County) Hauer SSP2
- Today (2025)
- 325,495 people
- By 2030
- 338,800 · +4.1%
- By 2040
- 363,471 · +11.7%
- By 2050
- 384,156 · +18.0%
- By 2075
- 430,137 · +32.1%
- By 2100
- 442,733 · +36.0%
Race, ethnicity, and origin ACS 2023
- Neighborhood character
- Predominantly White (74%)
- Race & ethnicity
- White 74% Black 20% Two or more races 4% Hispanic / Latino 3%
- Common ancestry
- Serbian 4% Slovak 2% Romanian 1%
- Foreign-born
- 4% · Canada, Jamaica
- Languages at home
- 91% English-only · Spanish 5% Russian/Polish/Slavic 1% Other Indo-European 1%
Political lean MEDSL · Spartanburg
- 2024 margin
- Solid R (+33.6) · D 32.6% · R 66.2% · Other 1.2%
- 2008→2024 swing
- -12.0pp toward R · 2008: -21.6pp · 2024: -33.6pp
- All cycles
- 2024: R+33.6 2020: R+27.3 2016: R+30.0 2012: R+23.1 2008: R+21.6
Not yet ingested
- Civics
- —
Market trends
- HPI YoY
- ▼ -52.58%
- Current HPI
- 244.9855
- Rent YoY
- ▲ 0.64%
- Metro
- Spartanburg, SC
- State GDP YoY
- ▲ 4.51%
- F500 in state
- 2
Industry mix (Fortune 500 HQ in SC)
| Industry | F500 HQs | Revenue |
|---|---|---|
| Packaging | 1 | $7B |
|
||
Price history
3 events — show timeline
- 2026-05-27 Listed $260,000 SPMLS
- 2025-02-07 Rental Removed $750 TURBOTENANT
- 2025-02-03 Listed for Rent $750 TURBOTENANT
Cash-flow waterfall
monthlySold comps — $/sqft
last 12 mo · ≤1 miLoading sold comps…