 5-Plex
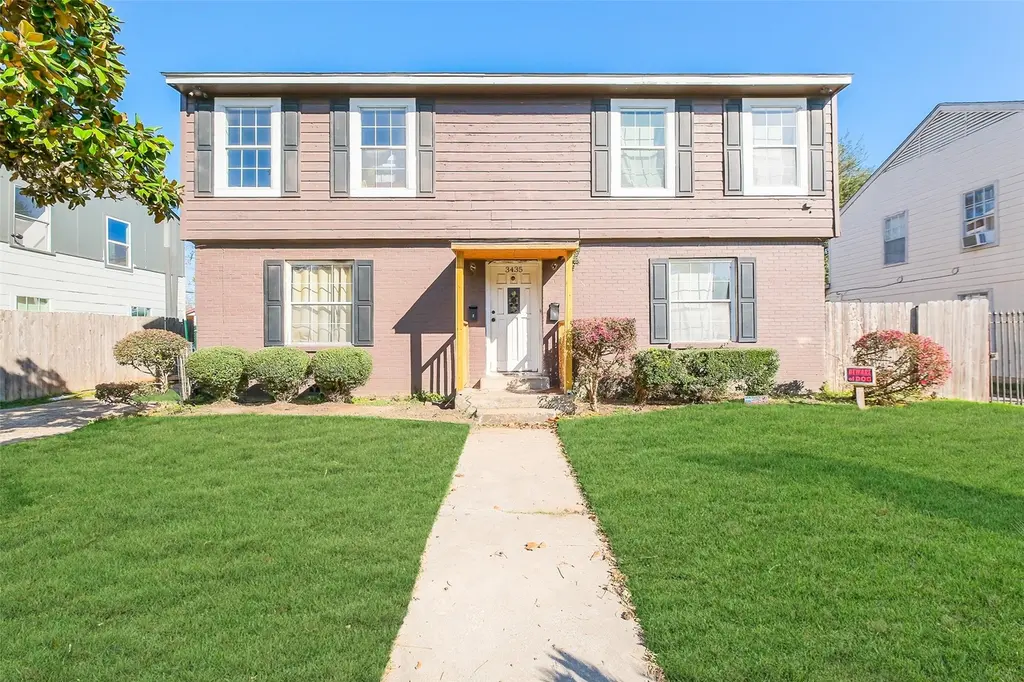
3435 Rosedale St · Houston, TX
Flood risk 1/10 · Minimal
- FEMA flood zone
- X (unshaded)
- Chance of flooding over 30 yrs
- 0.0%
- Est. flood insurance / yr
- $507 – $1,088
Fire risk 1/10 · Minimal
- Est. fire insurance / yr
- $1,222 – $2,270
Heat risk 9/10 · Severe
- Hot days now (above 109°F)
- 7 days/yr
- Hot days in 30 yrs
- 24 days/yr
Wind risk 9/10 · Severe
- Chance of severe wind over 30 yrs
- 99.0%
Air-quality risk 2/10 · Minimal
- Unhealthy air days now
- 2 days/yr
- Unhealthy air days in 30 yrs
- 2 days/yr
Risk factors via First Street. Map © Google.
Why this score? — see what drove the C+ grade
The composite is a weighted blend of 9 inputs, each scored 0–100. Each bar is that input's sub-score; the figure is the points it added to the 100-point composite (weight × sub-score).
- Cash flow +25.2/30.0
- ARV discount +8.7/15.0
- DSCR +8.3/10.0
- 1% rule +7.1/10.0
- Livability +3.7/5.0
- Schools +2.7/10.0
- Condition / age +2.5/5.0
- Rent growth +2.4/5.0
- Appreciation +0.0/10.0
$525,000
🖨 Deal sheet 📄 Offer letter ✓ Due diligence
Multi-family units
County records classify this as Multi-Family (2-4 Unit). Listing-text estimate: 5 units. estimate disagrees with records
Listing remarks MLS
Income-producing 5-plex located in the Haden Terrace subdivision. This multi-family property features three 1-bedroom/1-bath units and two 2-bedroom units, offering a desirable unit mix. Average rents are approximately $900 for the 1-bedroom units and $1,350 for the 2-bedroom units. Each unit showcases original hardwood floors, adding timeless character and durability. Ideally located near the University of Houston and Texas Southern University, providing strong rental demand. Convenient access to Hwy 288 and I-45 allows for easy commuting to Downtown Houston, the Medical Center, and surrounding areas. An excellent opportunity for investors seeking a well-located multi-family asset.
Key facts
- Access to i-45
- Access to hwy 288
- 6,600 sq ft lot
Tags
Neighborhood map
What this means for you Summary
Snapshot
- This is a 3×1bd/1ba + 2×2bd/1ba units multifamily listed at $525k.
Deal economics
- At list price, monthly cash flow is $1k ($14k/yr) — positive. Per door: $235/mo.
- The deal already cash-flows at list — no discount required.
- Meets the 1% rule at list price ($6k rent vs $525k).
- Recommended offer: $462k (12.0% below list) — sets the bar for market timing.
- Cap rate 9.0% vs local median 3.2% in Houston — top-decile yield for the area; either an underpriced asset or a hidden risk that comps aren't pricing in. Stress-test before assuming the spread holds.
Location & tenants
- Location reads 74/100 on livability (#184 in TX, #4,771 nationally) — a middle-class / working-renter tenant base. Strengths: amenities A+, cost of living A+, housing A+; Watch: schools D, crime F.
- Houston ISD (urban): math 27% / reading 35% proficiency, ranked #593 of 826 in TX (top 72%) — families likely to look elsewhere, expect single-tenant / working-renter base with shorter leases; 71% free/reduced lunch — lower-income household profile, screen leases tightly.
- Market conditions: Rents soft (-0.3%/yr); 581 active listings in the ZIP; 38 comparable units currently listed for rent nearby; rentals at typical pace (median 22d on market — plan ~3-4 weeks tenant-placement turnaround); 29,883 units permitted in Harris County in 2024 (8,621 in 5+ unit buildings).
- At $6,336/mo this rent would consume 107% of the median local household income ($71k/yr) (locally 3072% of renters already pay >50% of income on rent) — very limited rent-growth headroom before tenants either downsize or default.
Forward outlook
- Local home prices are declining (-3.0%/yr); year-one equity from $4k of loan paydown is wiped out by about $16k of value loss. Plan a longer hold.
- Harris County population projected at +47% by 2050 — long-run rental-demand tailwind backs the buy-and-hold thesis.
Negotiation context
- It's been on market 163 days — a 12% lower offer ($462k) is reasonable based on typical stale-listing flexibility.
- 6 sale attempts since 16y ago with the ask held roughly flat each time — persistent listings suggest the price (not the market) is what's stuck; bring a comps-based counter.
Risks & watch-outs
- Watch-outs: built in 1945 — expect roof / HVAC / electrical / plumbing capex.
- Climate carrying-cost: severe wind risk, 99% chance of damaging wind over 30y; extreme-heat days projected 7→24/yr by 2055 (HVAC capex compounding) — expect insurance premiums to compound above CPI over the hold.
Questions for the listing agent
- It's been on market 163 days. Have you received any prior offers? Is the seller open to a 12% concession, seller financing, or rate buy-down credit?
- Can we see the unit-by-unit rent roll, current vacancy, and any below-market leases? What's the average tenancy length?
- What capital expenditures (roof, boiler, parking lot, exteriors) have been made in the last 5 years, and what's planned in the next 2?
- Built in 1945 — when were the roof, HVAC, electrical panel, plumbing, and water heater last replaced?
- Why hasn't it sold? Are there any deal-killer items the seller is aware of (foundation, flood, title, zoning, code violations)?
- Is there a deadline driving the sale (1031 exchange, divorce, estate, relocation)? That informs how much negotiation room exists.
- Schools are D-rated, which usually means shorter tenancies and higher turnover. Who's the typical renter profile here, and what's been the actual vacancy rate?
- Crime grade is F in this area — have there been break-ins, vandalism, or insurance claims at this property in the last 3 years? What carrier currently insures it and at what premium?
- What's the average days-on-market for RENTAL listings here right now (not sales)? A rising rental-DOM trend means longer vacancies and softer asking-rent achievability than the comps imply.
- What's the recent tenant-quality profile in this submarket — average credit score on applications, eviction rate, late-payment / NSF rate, and stable-employment percentage? A property-management company in the area should have these aggregated.
- How much new apartment / multifamily construction is in the pipeline within 1–3 miles? Heavy new supply (>2% of stock underway) typically softens rents 12–24 months out; light construction supports rent growth.
Investment metrics
- 1% rule
- 1.21% ✓
- Cap rate
- 8.98%
- Cash-on-cash
- 9.59%
- DSCR
- 1.43
- GRM
- 6.9
CMA / ARV
- ARV (median comp)
- $539,066
- List price
- $525,000
- Delta
- -2.61%
- Verdict
- FAIR
- Comps
- 20 within 1.0 mi
Show comp detail 2 sales within ~0.75 mi
| Address | Dist | Beds/Ba | Sqft | Sold | Price | $/sf | Match |
|---|---|---|---|---|---|---|---|
| 2820 Blodgett St #3 | 0.63mi | 4/1.0 | 2,424 (-2%) | 20mo | $350,000 | $144 | 44 |
| 2903 Wichita St | 0.64mi | 4/2.0 | 2,660 (+8%) | 14mo | $550,000 | $207 | 41 |
Match score weights: distance 35% · size 25% · config 20% · recency 20%. Top-matched comps best support the ARV.
Projected returns pro-forma
-3.0% appreciation · 0.0% rent growth · sell at horizon
- IRR
- -5.4%
- Equity multiple
- 0.81×
- Total profit
- $-28,632
- Equity at exit
- $78,279
- IRR
- 0.1%
- Equity multiple
- 1.00×
- Total profit
- $507
- Equity at exit
- $45,392
Cash invested: $147,000 (down + closing). Projections, not guarantees.
Landlord ↔ Tenant lean methodology
- Overall (STATE)
- 87 Strongly Landlord-Friendly
- State Texas
- 87 Strongly Landlord-Friendly · R+5
- County
- — inherits STATE
- City
- — inherits STATE
ZIP-level market 77004
- Rents YoY
- -0.3%
- Active inventory
- 581
- Price-to-rent
- 36.2×
Monthly cashflow live
- Estimated rent
- $6,336 medium interval (Pro) →
- Mortgage (P&I)
- −$2,753
- Tax from tax record
- −$859 /mo · $10,311/yr
- Insurance
- −$219
- HOA
- −$0
- Vacancy / Maint / Mgmt
- −$1,331
- Net cashflow
- $1,174
Break-even live
5-unit breakdown (identical units grouped — click to expand)
| Units | Beds | Baths | Est. rent |
|---|---|---|---|
| 3× units | 1 | 1 | $3,624 |
| #1 | 1 | 1 | $1,208 |
| #2 | 1 | 1 | $1,208 |
| #3 | 1 | 1 | $1,208 |
| 2× units | 2 | 1 | $2,710 |
| #4 | 2 | 1 | $1,355 |
| #5 | 2 | 1 | $1,355 |
| Total (5 units) | $6,336 | ||
UW: 25.0% down · 7.5% · 30yr · 1.5% tax · 5.0% vac · 8.0% maint · 8.0% mgmt
Financing live
Cash to close
- Down payment
- $131,250
- Closing costs
- $15,750
- Reserves months
- —
- Total cash needed
- —
Loan-product check · same deal, 3 products live
Conventional
25% down · 7.5% · 30yr
- Down + closing
- —
- Monthly P&I
- —
- Monthly cashflow
- —
- DSCR
- —
- Eligible?
- —
Personal DTI + credit; lowest rate.
DSCR
20% down · 8.5% · 30yr
- Down + closing
- —
- Monthly P&I
- —
- Monthly cashflow
- —
- DSCR
- —
- Eligible?
- —
No personal income docs; deal must DSCR.
Hard money
10% down · 12.0% · 12mo
- Down + closing
- —
- Monthly P&I
- —
- Monthly cashflow
- —
- DSCR
- —
- Eligible?
- —
Short-term bridge; refi at stabilization.
Rent comps 38 comps
| Address | Beds | Baths | Sqft | Rent | $/sqft | DOM | Units | Dist |
|---|---|---|---|---|---|---|---|---|
| 3535 Wentworth St Houston, TX | 4.0 | 3.0 | 2600 | $2,650 | $1.02 | 22d | 1 | 0.17mi |
| 4306 Ennis St Houston, TX | 3.0 | 3.0 | 1989 | $2,500 | $1.26 | 43d | 1 | 0.61mi |
| 3507 Canfield St Houston, TX | 3.0 | 2.5 | 2200 | $2,350 | $1.07 | 24d | 1 | 0.71mi |
| 2703 Blodgett St Unit 1047952P Houston, TX | 1.0–5.0 | 1.5–5.5 | 2497 | $12,783 | $5.12 | 1d | 2 | 0.74mi |
| 3229 Holman St Houston, TX | 4.0 | 4.0 | 1632 | $1,200 | $0.74 | 43d | 1 | 0.76mi |
| 5505 Zoemark Ln Houston, TX | 3.0 | 3.5 | 2477 | $2,850 | $1.15 | 43d | 1 | 0.81mi |
| 2403 Arbor St Houston, TX | 3.0 | 2.5 | 2344 | $2,800 | $1.19 | 43d | 1 | 0.92mi |
| 2401 Eagle St Houston, TX | 4.0 | 4.0 | 1700 | $2,800 | $1.65 | 43d | 1 | 0.97mi |
| 2311 Eagle St Houston, TX | 3.0 | 4.0 | 1783 | $2,500 | $1.40 | 43d | 1 | 1.03mi |
| 3122 Lucinda St Houston, TX | 5.0 | 5.0 | 1984 | $999 | $0.50 | 24d | 1 | 1.08mi |
| 3719 Elgin St Houston, TX | 1.0–5.0 | 1.0–5.0 | 1241 | $1,636 | $1.32 | 24d | 14 | 1.09mi |
| 6334 Culberson St Houston, TX | 3.0 | 3.5 | 1822 | $2,311 | $1.27 | 2d | 1 | 1.10mi |
| 6336 Culberson St Houston, TX | 3.0 | 3.5 | 1822 | $2,361 | $1.30 | 5d | 1 | 1.11mi |
| 4135 DuPont St Houston, TX | 3.0 | 4.0 | 2395 | $2,499 | $1.04 | 43d | 1 | 1.11mi |
| 2209 Alabama St Unit B Houston, TX | 3.0 | 2.5 | 2074 | $2,350 | $1.13 | 43d | 1 | 1.15mi |
| 3518 Dennis St Unit 1387517P Houston, TX | 4.0 | 4.0 | 2271 | $5,110 | $2.25 | 14d | 1 | 1.22mi |
| 3731 Alsace St Unit 1560804P Houston, TX | 3.0 | 2.0 | 2002 | $3,387 | $1.69 | 3d | 1 | 1.24mi |
| 5927 Almeda Rd Unit AHP3 Houston, TX | 4.0 | 4.5 | 3055 | $7,635 | $2.50 | 4d | 1 | 1.25mi |
| 5927 Almeda Rd Houston, TX | 2.0–4.0 | 2.5–4.0 | 3055 | $7,635 | $2.50 | 1d | 3 | 1.26mi |
| 5927 Almeda Rd Houston, TX | 2.0–4.0 | 2.5–4.0 | 3055 | $7,635 | $2.50 | 12d | 2 | 1.26mi |
| 6318 Grand Blvd Houston, TX | 3.0 | 3.5 | 2325 | $2,999 | $1.29 | 4d | 1 | 1.26mi |
| 5927 Almeda Rd Houston, TX | 4.0 | 4.0 | 3055 | $7,635 | $2.50 | 43d | 1 | 1.27mi |
| 5927 Almeda Rd Houston, TX | 4.0 | 4.0 | 3055 | $7,635 | $2.50 | 24d | 1 | 1.27mi |
| 1910 Oakdale St Unit A Houston, TX | 3.0 | 3.5 | 2452 | $3,890 | $1.59 | 12d | 1 | 1.27mi |
| 3405 St Emanuel St Houston, TX | 4.0 | 5.0 | 2388 | $2,900 | $1.21 | 43d | 1 | 1.31mi |
| 5933 Almeda Rd Unit 2-1405 Houston, TX | 4.0 | 4.0 | 3055 | $7,442 | $2.44 | 43d | 1 | 1.31mi |
| 1818 Prospect St Houston, TX | 3.0 | 2.0 | 2923 | $3,400 | $1.16 | 4d | 1 | 1.32mi |
| 3213 Saint Emanuel St Houston, TX | 4.0 | 3.5 | 2100 | $3,300 | $1.57 | 17d | 1 | 1.35mi |
| 3517 McIlhenny St Houston, TX | 3.0 | 3.5 | 2000 | $3,200 | $1.60 | 3d | 1 | 1.39mi |
| 6735 Peerless St Unit CUNIT A Houston, TX | 3.0 | 3.5 | 1732 | $2,649 | $1.53 | 17d | 1 | 1.39mi |
| 6737 Peerless St Unit A Houston, TX | 3.0 | 3.5 | 1732 | $2,649 | $1.53 | 17d | 1 | 1.40mi |
| 30 Hermann Park Ct Houston, TX | 3.0 | 2.0 | 1655 | $2,605 | $1.57 | 43d | 1 | 1.40mi |
| 6301 Almeda Rd Unit 6334 Houston, TX | 3.0 | 2.0 | 1655 | $2,728 | $1.65 | 11d | 1 | 1.46mi |
| 6301 Almeda Rd Unit 3148 Houston, TX | 3.0 | 2.0 | 1655 | $2,696 | $1.63 | 3d | 1 | 1.46mi |
| 4908 Crawford St Houston, TX | 3.0 | 2.0 | 2526 | $3,250 | $1.29 | 43d | 1 | 1.46mi |
| 3311 Daphne St Unit 1255369P Houston, TX | 3.0 | 3.5 | 1797 | $6,544 | $3.64 | 2d | 1 | 1.47mi |
| 3311 Daphne St Unit 3311 Houston, TX | 3.0 | 3.5 | 1800 | $7,500 | $4.17 | 43d | 1 | 1.47mi |
| 4907 Culmore Dr Houston, TX | 4.0 | 2.0 | 1800 | $2,700 | $1.50 | 17d | 1 | 1.50mi |
Listing history 29 events
-
2026-06-18days on market $525,000 Active 163 DOM
-
2026-06-17days on market $525,000 Active 162 DOM
-
2026-06-16days on market $525,000 Active 161 DOM
-
2026-06-15days on market $525,000 Active 160 DOM
-
2026-06-13days on market $525,000 Active 158 DOM
-
2026-06-10days on market $525,000 Active 154 DOM
-
2026-06-08days on market $525,000 Active 153 DOM
-
2026-06-07days on market $525,000 Active 152 DOM
-
2026-06-04days on market $525,000 Active 149 DOM
-
2026-06-01days on market $525,000 Active 146 DOM
-
2026-05-31days on market $525,000 Active 145 DOM
-
2026-01-06$525,000 Active 691-char remark
Show marketing remark (691 chars)
Income-producing 5-plex located in the Haden Terrace subdivision. This multi-family property features three 1-bedroom/1-bath units and two 2-bedroom units, offering a desirable unit mix. Average rents are approximately $900 for the 1-bedroom units and $1,350 for the 2-bedroom units. Each unit showcases original hardwood floors, adding timeless character and durability. Ideally located near the University of Houston and Texas Southern University, providing strong rental demand. Convenient access to Hwy 288 and I-45 allows for easy commuting to Downtown Houston, the Medical Center, and surrounding areas. An excellent opportunity for investors seeking a well-located multi-family asset.
-
2024-11-30historical
-
2024-05-07price $624,999
-
2024-04-24$649,000 Active
-
2024-03-29historical
-
2023-10-11price $649,000
-
2023-10-06price $655,000
-
2023-09-08$695,000 Active
-
2013-09-06soldstatus
-
2012-03-02soldstatus
-
2012-03-02soldstatus
-
2012-02-28soldstatus
-
2012-02-20historical
-
2012-01-01$145,900
-
2011-12-31historical
-
2011-01-20$149,900
-
2010-12-22historical
-
2010-01-09$169,000
ⓘ Source: listings_history table (triggers on properties + properties_extension) + one-shot
backfill from property_details.listing_events for pre-trigger history.
Tax reassessment forecast TX · Resets to sale price
- Current annual tax
- $10,311 · $859/mo
- Projected year-2 tax
- $10,311 · $859/mo
- Expected delta
- $0/yr ($0/mo · 0.0%)
ⓘ Screening estimate from a state-policy table — verify with the county assessor before closing.
Climate risk First Street
- Flood 1/10 Low FEMA zone X (unshaded) · 0% chance over 30 yrs
- Wildfire 1/10 Low
- Heat 9/10 Extreme 7 d/yr ≥109°F today · 24 d/yr by 30 yrs out
- Wind 9/10 Extreme 99% chance of damaging wind over 30 yrs
- Air quality 2/10 Low 2 unhealthy d/yr today · 2 by 30 yrs out
Nearby sold comps map
Loading sold comps map…
Walkable amenities ~0.75 mi
Loading nearby amenities…
Taxation est. · year 1
- Rental income
- $76,032
- − Mortgage interest
- −$29,408
- − Property taxes
- −$10,311
- − Insurance
- −$2,625
- − Repairs & maintenance
- −$6,083
- − Management
- −$6,083
- − Depreciation
- −$15,273
- Taxable income
- $6,250
- Est. tax owed @ 24.0%
- −$1,500
- After-tax cash flow
- $12,591/yr
For passive investors: Depreciation is non-cash, so a rental often shows a tax loss while cash-flowing — sheltering income. Rental losses are passive: they offset passive income freely, and up to $25,000/yr can offset ordinary (W-2) income if you actively participate and your MAGI is under $100k (phasing out to $0 by $150k); unused losses carry forward. On sale, claimed depreciation is recaptured at up to 25%, and gains may owe capital-gains tax (a 1031 exchange can defer both). Figures are a year-1 estimate at your 24.0% rate — not tax advice; consult a CPA.
Schools (NCES district)
- District
- Houston ISD
- NCES district ID
- 4823640
- Math proficiency
- 27% ▼ -18.00%
- Reading proficiency
- 35% ▼ -6.00%
- Median HH income
- $46,054
- Composite
- 26.63/100
- National rank
- #7173
- State rank
- #593 of 826 in TX
Livability — Houston
- Score
- 74/100
- State rank
- #184
- US rank
- #4771
Category grades
Schools grade is shown separately in the Schools card above.
Census & demographics
- Census place
- Houston, TX
- County
- Harris County · 4,702,590 people
- City population
- 3,226,434
- Metro
- Houston-The Woodlands-Sugar Land, TX
- Population (ZIP)
- 35,997
- Household income
- $71,199
- Rent vs Own
- Severe rent burden
- 3072.0
Population outlook (Harris County) Hauer SSP2
- Today (2025)
- 5,571,493 people
- By 2030
- 6,089,821 · +9.3%
- By 2040
- 7,142,806 · +28.2%
- By 2050
- 8,185,864 · +46.9%
- By 2075
- 10,574,329 · +89.8%
- By 2100
- 12,109,958 · +117.4%
Race, ethnicity, and origin ACS 2023
- Neighborhood character
- Diverse neighborhood (Simpson 0.68)
- Race & ethnicity
- Black 48% White 27% Hispanic / Latino 13% Two or more races 11% Asian 8%
- Hispanic origin (detail)
- Mexican 9%
- Common ancestry
- Lithuanian 1% Romanian 1% Italian 1%
- Foreign-born
- 14% · Canada, China, South Korea
- Languages at home
- 82% English-only · Spanish 10% Chinese 2% Other Indo-European 2%
Political lean MEDSL · Harris
- 2024 margin
- Lean D (+5.5) · D 52.0% · R 46.4% · Other 1.6%
- 2008→2024 swing
- +3.9pp toward D · 2008: 1.6pp · 2024: 5.5pp
- All cycles
- 2024: D+5.5 2020: D+13.3 2016: D+12.4 2012: D+0.1 2008: D+1.6
Not yet ingested
- Civics
- —
Market trends
- HPI YoY
- ▼ -139.34%
- Current HPI
- 199.6066
- Rent YoY
- ▼ -0.32%
- Metro
- Houston-The Woodlands-Sugar Land, TX
- State GDP YoY
- ▲ 3.95%
- F500 in state
- 110
Industry mix (Fortune 500 HQ in TX)
| Industry | F500 HQs | Revenue |
|---|---|---|
| Energy | 16 | $1,198B |
|
||
| Technology | 5 | $198B |
|
||
| Engineering / Construction | 4 | $72B |
|
||
| Energy Services | 3 | $60B |
|
||
| Utilities | 3 | $41B |
|
||
| Healthcare | 2 | $330B |
|
||
Price history
+210.7% since first listed18 events — show timeline
- 2026-01-06 Listed $525,000 HARMLS
- 2024-11-30 Listing Removed — HARMLS
- 2024-05-07 Price Changed $624,999 HARMLS
- 2024-04-24 Listed $649,000 HARMLS
- 2024-03-29 Listing Removed — HARMLS
- 2023-10-11 Price Changed $649,000 HARMLS
- 2023-10-06 Price Changed $655,000 HARMLS
- 2023-09-08 Listed $695,000 HARMLS
- 2013-09-06 Sold (Public Records) — Public Records
- 2012-03-02 Sold (Public Records) — Public Records
- 2012-03-02 Sold (Public Records) — Public Records
- 2012-02-28 Sold (MLS) — HARMLS
- 2012-02-20 Listing Removed — HARMLS
- 2012-01-01 Listed $145,900 HARMLS
- 2011-12-31 Listing Removed — HARMLS
- 2011-01-20 Listed $149,900 HARMLS
- 2010-12-22 Listing Removed — HARMLS
- 2010-01-09 Listed $169,000 HARMLS
Property tax history
+9.1%/yrLatest (2025): $10,311 · -11.5% YoY. Source: county tax records.
Cash-flow waterfall
monthlySold comps — $/sqft
last 12 mo · ≤1 miLoading sold comps…