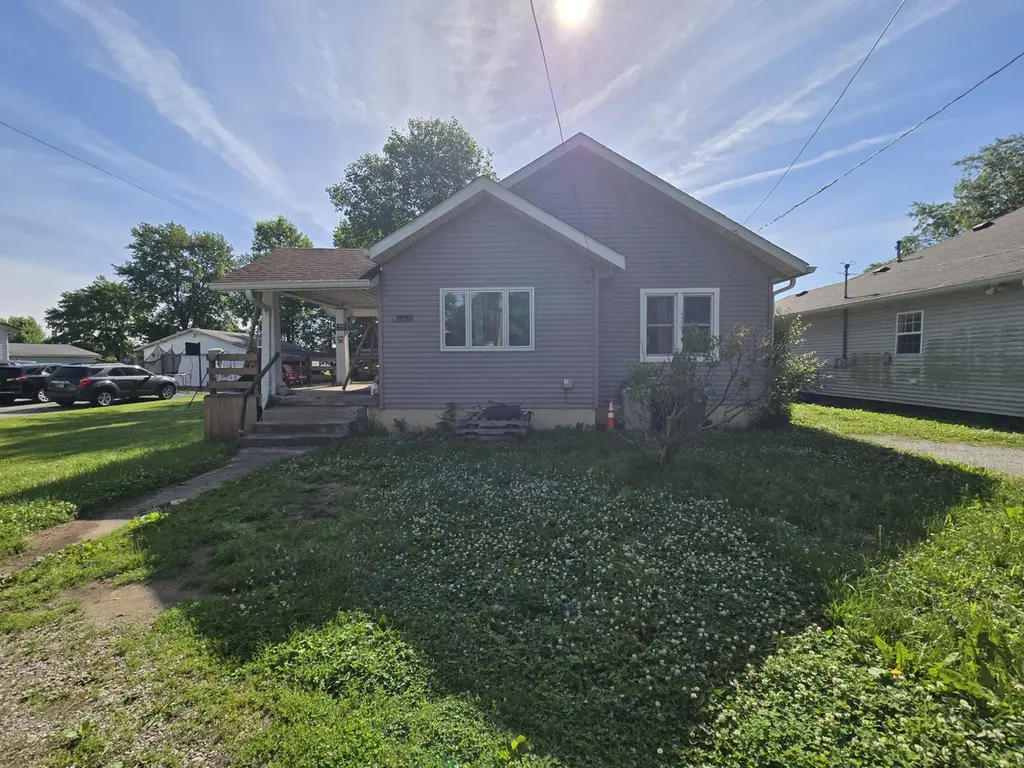
1628 S West St · Shelbyville, IN
Flood risk 6/10 · Moderate
- FEMA flood zone
- X (unshaded)
- Chance of flooding over 30 yrs
- 0.69%
- Est. flood insurance / yr
- $507 – $1,088
Fire risk 1/10 · Minimal
- Est. fire insurance / yr
- $717 – $1,331
Heat risk 4/10 · Minor
- Hot days now (above 102°F)
- 7 days/yr
- Hot days in 30 yrs
- 19 days/yr
Wind risk 2/10 · Minimal
- Chance of severe wind over 30 yrs
- 1.0%
Air-quality risk 2/10 · Minimal
- Unhealthy air days now
- 1 days/yr
- Unhealthy air days in 30 yrs
- 2 days/yr
Risk factors via First Street. Map © Google.
Why this score? — see what drove the B- grade
The composite is a weighted blend of 9 inputs, each scored 0–100. Each bar is that input's sub-score; the figure is the points it added to the 100-point composite (weight × sub-score).
- Cash flow +26.2/30.0
- ARV discount +15.0/15.0
- DSCR +8.9/10.0
- 1% rule +6.3/10.0
- Schools +3.4/10.0
- Livability +3.2/5.0
- Rent growth +2.5/5.0
- Condition / age +2.5/5.0
- Appreciation +0.0/10.0
$135,000
🖨 Deal sheet 📄 Offer letter ✓ Due diligence
Listing remarks MLS
Move-in ready, Off street Parking. Hardwood floors, 3 Bedrooms, 2 Baths. fenced in Yard. Double Hung Windows. Covered Porch
Key facts
- 9,350 sq ft lot
- Built 1927
- Listed 15 days
Property features AI
Exterior
- Utilities: Public water; Public sewer
- Home design: One-story home; Built in 1927
- Construction: Estimated above-grade finished living area: 1,492
- Exterior features: Neighborhood view
Interior
- Kitchen: Dishwasher; Refrigerator; Microwave; Electric range; Gas water heater
- Bedrooms: Primary bedroom; Bedroom 2; Bedroom 3
- Bathrooms: 2 full bathrooms
- Heating & cooling: Forced air heating; Central air conditioning; Ceiling fans
- Interior features: No notable built-in interior features listed; Crawl space basement
- Laundry & utility: Laundry on main level
Neighborhood map
What this means for you Summary
Snapshot
- This is a 3-bed/2.0-bath single-family listed at $135k.
Deal economics
- At list price, monthly cash flow is $344 ($4k/yr) — positive.
- The deal already cash-flows at list — no discount required.
- Meets the 1% rule at list price ($2k rent vs $135k).
- Recommended offer: $133k (1.5% below list) — sets the bar for market timing.
- Cap rate 9.3% vs local median 4.3% in Shelbyville — top-decile yield for the area; either an underpriced asset or a hidden risk that comps aren't pricing in. Stress-test before assuming the spread holds.
Location & tenants
- Location reads 63/100 on livability (#450 in IN) — a middle-class / working-renter tenant base. Strengths: cost of living A+, housing A+, crime B; Watch: employment C-, schools D+, amenities F.
- Shelbyville Central Schools (town): math 40% / reading 39% proficiency, ranked #148 of 301 in IN (top 49%) — families likely to look elsewhere, expect single-tenant / working-renter base with shorter leases.
- Market conditions: 229 active listings in the ZIP; 5 comparable units currently listed for rent nearby; rentals leasing fast (median 8d on market — plan ~1-2 weeks tenant-placement turnaround); 285 units permitted in Shelby County in 2024 (147 in 5+ unit buildings).
Forward outlook
- Local home prices are declining (-3.0%/yr); year-one equity from $933 of loan paydown is wiped out by about $4k of value loss. Plan a longer hold.
- Shelby County population projected to shrink 6% by 2050 — rents likely to lag national; underwrite the cash flow, not the appreciation.
- At projected returns (-3.0% appreciation + 3.0% rent growth), your $38k cash investment doubles in ~10 years — after that, you're playing with house money.
Negotiation context
- It's been on market 15 days — a 2% lower offer ($133k) is reasonable based on typical stale-listing flexibility.
- 4 sale attempts since 22y ago with the ask held roughly flat each time — persistent listings suggest the price (not the market) is what's stuck; bring a comps-based counter.
- Current owner paid $91k; 48% above their basis — modest negotiation headroom, anchor on the comps not their cost.
Risks & watch-outs
- Watch-outs: built in 1927 — expect roof / HVAC / electrical / plumbing capex.
- Climate carrying-cost: major flood risk — expect insurance premiums to compound above CPI over the hold.
Questions for the listing agent
- Built in 1927 — when were the roof, HVAC, electrical panel, plumbing, and water heater last replaced?
- Is there a deadline driving the sale (1031 exchange, divorce, estate, relocation)? That informs how much negotiation room exists.
- Schools are D-rated, which usually means shorter tenancies and higher turnover. Who's the typical renter profile here, and what's been the actual vacancy rate?
- What's the average days-on-market for RENTAL listings here right now (not sales)? A rising rental-DOM trend means longer vacancies and softer asking-rent achievability than the comps imply.
- What's the recent tenant-quality profile in this submarket — average credit score on applications, eviction rate, late-payment / NSF rate, and stable-employment percentage? A property-management company in the area should have these aggregated.
- How much new for-sale + rental construction is in the pipeline within 1–3 miles? Heavy new supply typically softens prices + rents 12–24 months out; constrained supply supports both.
Investment metrics
- 1% rule
- 1.13% ✓
- Cap rate
- 9.35%
- Cash-on-cash
- 10.91%
- DSCR
- 1.49
- GRM
- 7.4
CMA / ARV
- ARV (on-the-fly)
- $174,680
- Comps found
- 12
Show comp detail 12 sales within ~0.75 mi
| Address | Dist | Beds/Ba | Sqft | Sold | Price | $/sf | Match |
|---|---|---|---|---|---|---|---|
| 771 Doran Ave | 0.31mi | 4/1.5 (+1) | 1,564 (-2%) | 9mo | $225,000 | $144 | 68 |
| 1003 S Shelby St | 0.37mi | 2/1.0 (-1) | 1,536 (-3%) | 0mo | $143,000 | $93 | 68 |
| 1122 Shelby St | 0.27mi | 3/2.0 | 1,376 (-13%) | 9mo | $229,000 | $166 | 58 |
| 525 Third St | 0.35mi | 2/1.5 (-1) | 1,732 (+9%) | 5mo | $161,000 | $93 | 57 |
| 1101 S Shelby St | 0.32mi | 2/1.0 (-1) | 1,728 (+9%) | 6mo | $133,000 | $77 | 56 |
| 1237 Elm St | 0.26mi | 2/1.0 (-1) | 1,744 (+10%) | 8mo | $158,000 | $91 | 56 |
| 607 4th St | 0.32mi | 2/1.0 (-1) | 1,768 (+11%) | 2mo | $195,000 | $110 | 55 |
| 113 1st St | 0.53mi | 2/1.0 (-1) | 1,611 (+1%) | 12mo | $179,500 | $111 | 53 |
| 217 Howard St | 0.70mi | 2/1.0 (-1) | 1,410 (-11%) | 2mo | $160,000 | $113 | 38 |
| 2130 Theobald St | 0.62mi | 3/1.5 | 1,804 (+14%) | 12mo | $218,000 | $121 | 36 |
| 265 W South St | 0.73mi | 3/1.5 | 1,811 (+14%) | 6mo | $65,000 | $36 | 36 |
| 618 Miller Ave | 0.69mi | 3/1.0 | 1,792 (+13%) | 12mo | $175,000 | $98 | 32 |
Match score weights: distance 35% · size 25% · config 20% · recency 20%. Top-matched comps best support the ARV.
Projected returns pro-forma
-3.0% appreciation · 3.0% rent growth · sell at horizon
- IRR
- -0.0%
- Equity multiple
- 1.00×
- Total profit
- $-14
- Equity at exit
- $20,129
- IRR
- 9.6%
- Equity multiple
- 1.74×
- Total profit
- $28,076
- Equity at exit
- $11,672
Cash invested: $37,800 (down + closing). Projections, not guarantees.
Landlord ↔ Tenant lean methodology
- Overall (STATE)
- 90 Strongly Landlord-Friendly
- State Indiana
- 90 Strongly Landlord-Friendly · R+11
- County
- — inherits STATE
- City
- — inherits STATE
ZIP-level market 46176
- Home prices YoY
- -33.9%
- Active inventory
- 229
- Price-to-rent
- 7.4×
Monthly cashflow live
- Estimated rent
- $1,523 medium interval (Pro) →
- Mortgage (P&I)
- −$708
- Tax from tax record
- −$95 /mo · $1,142/yr
- Insurance
- −$56
- HOA
- −$0
- Vacancy / Maint / Mgmt
- −$320
- Net cashflow
- $344
Break-even live
UW: 25.0% down · 7.5% · 30yr · 1.5% tax · 5.0% vac · 8.0% maint · 8.0% mgmt
Financing live
Cash to close
- Down payment
- $33,750
- Closing costs
- $4,050
- Reserves months
- —
- Total cash needed
- —
Loan-product check · same deal, 3 products live
Conventional
25% down · 7.5% · 30yr
- Down + closing
- —
- Monthly P&I
- —
- Monthly cashflow
- —
- DSCR
- —
- Eligible?
- —
Personal DTI + credit; lowest rate.
DSCR
20% down · 8.5% · 30yr
- Down + closing
- —
- Monthly P&I
- —
- Monthly cashflow
- —
- DSCR
- —
- Eligible?
- —
No personal income docs; deal must DSCR.
Hard money
10% down · 12.0% · 12mo
- Down + closing
- —
- Monthly P&I
- —
- Monthly cashflow
- —
- DSCR
- —
- Eligible?
- —
Short-term bridge; refi at stabilization.
Rent comps 5 comps
| Address | Beds | Baths | Sqft | Rent | $/sqft | DOM | Units | Dist |
|---|---|---|---|---|---|---|---|---|
| 1021 Amos Rd Shelbyville, IN | 3.0 | 1.5 | 1476 | $1,635 | $1.11 | 7d | 1 | 1.05mi |
| 425 N Harrison St Shelbyville, IN | 3.0 | 1.0–2.0 | 909 | $1,882 | $2.07 | 2d | 7 | 1.31mi |
| 713 Indiana Ave Shelbyville, IN | 2.0 | 1.0 | 1077 | $1,100 | $1.02 | 44d | 1 | 1.37mi |
| 809 Indiana Ave Unit 809 Shelbyville, IN | 2.0 | 2.0 | 1456 | $850 | $0.58 | 10d | 1 | 1.40mi |
| 1008 Balto Dr Shelbyville, IN | 3.0 | 2.5 | 1942 | $1,900 | $0.98 | 2d | 1 | 1.40mi |
Listing history 10 events
-
2026-06-18days on market $135,000 Active 15 DOM
-
2026-06-17days on market $135,000 Active 14 DOM
-
2026-06-16days on market $135,000 Active 13 DOM
-
2026-06-15days on market $135,000 Active 12 DOM
-
2026-06-13days on market $135,000 Active 10 DOM
-
2026-06-13days on market $135,000 Active 9 DOM
-
2026-06-09days on market $135,000 Active 6 DOM
-
2026-06-08days on market $135,000 Active 5 DOM
-
2026-06-07remarks 325-char remark
-
2026-06-07$135,000 Active 4 DOM
ⓘ Source: listings_history table (triggers on properties + properties_extension) + one-shot
backfill from property_details.listing_events for pre-trigger history.
Tax reassessment forecast IN · Partial reset (capped growth)
- Current annual tax
- $1,142 · $95/mo
- Projected year-2 tax
- $1,145 · $95/mo
- Expected delta
- +$3/yr ($0/mo · 0.2%)
ⓘ Screening estimate from a state-policy table — verify with the county assessor before closing.
Climate risk First Street
- Flood 6/10 Major FEMA zone X (unshaded) · 69% chance over 30 yrs
- Wildfire 1/10 Low
- Heat 4/10 Moderate 7 d/yr ≥102°F today · 19 d/yr by 30 yrs out
- Wind 2/10 Low 100% chance of damaging wind over 30 yrs
- Air quality 2/10 Low 1 unhealthy d/yr today · 2 by 30 yrs out
Nearby sold comps map
Loading sold comps map…
Walkable amenities ~0.75 mi
Loading nearby amenities…
Taxation est. · year 1
- Rental income
- $18,273
- − Mortgage interest
- −$7,562
- − Property taxes
- −$1,142
- − Insurance
- −$675
- − Repairs & maintenance
- −$1,462
- − Management
- −$1,462
- − Depreciation
- −$3,927
- Taxable income
- $2,043
- Est. tax owed @ 24.0%
- −$490
- After-tax cash flow
- $3,633/yr
For passive investors: Depreciation is non-cash, so a rental often shows a tax loss while cash-flowing — sheltering income. Rental losses are passive: they offset passive income freely, and up to $25,000/yr can offset ordinary (W-2) income if you actively participate and your MAGI is under $100k (phasing out to $0 by $150k); unused losses carry forward. On sale, claimed depreciation is recaptured at up to 25%, and gains may owe capital-gains tax (a 1031 exchange can defer both). Figures are a year-1 estimate at your 24.0% rate — not tax advice; consult a CPA.
Schools (NCES district)
- District
- Shelbyville Central Schools
- NCES district ID
- 1810140
- Math proficiency
- 40% ▼ -10.00%
- Reading proficiency
- 39% ▼ -9.00%
- Median HH income
- $45,199
- Composite
- 33.63/100
- National rank
- #5402
- State rank
- #148 of 301 in IN
Livability — Shelbyville
- Score
- 63/100
- State rank
- #450
- US rank
- #16051
Category grades
Schools grade is shown separately in the Schools card above.
Census & demographics
- Census place
- Shelbyville, IN
- County
- Shelby County · 28,782 people
- City population
- 28,782
- Metro
- Indianapolis-Carmel-Anderson, IN
- Population (ZIP)
- 28,782
- Household income
- $65,182
- Rent vs Own
- Severe rent burden
- 921.0
Population outlook (Shelby County) Hauer SSP2
- Today (2025)
- 45,020 people
- By 2030
- 44,962 · -0.1%
- By 2040
- 44,126 · -2.0%
- By 2050
- 42,110 · -6.5%
- By 2075
- 37,131 · -17.5%
- By 2100
- 29,714 · -34.0%
Race, ethnicity, and origin ACS 2023
- Neighborhood character
- Predominantly White (88%)
- Race & ethnicity
- White 88% Hispanic / Latino 7% Two or more races 4% Black 2% Asian 1%
- Hispanic origin (detail)
- Mexican 5%
- Common ancestry
- Italian 2% Slovak 1% Lithuanian 1%
- Foreign-born
- 5% · Canada
- Languages at home
- 92% English-only · Spanish 5% German/W. Germanic 1% Other Asian/Pacific 1%
Political lean MEDSL · Shelby
- 2024 margin
- Solid R (+48.0) · D 25.1% · R 73.1% · Other 1.8%
- 2008→2024 swing
- -29.0pp toward R · 2008: -19.0pp · 2024: -48.0pp
- All cycles
- 2024: R+48.0 2020: R+47.7 2016: R+47.2 2012: R+33.5 2008: R+19.0
Not yet ingested
- Civics
- —
Market trends
- HPI YoY
- ▼ -116.59%
- Current HPI
- 227.6747
- Rent YoY
- —
- Metro
- Indianapolis-Carmel-Anderson, IN
- State GDP YoY
- ▲ 2.90%
- F500 in state
- 18
Industry mix (Fortune 500 HQ in IN)
| Industry | F500 HQs | Revenue |
|---|---|---|
| Industrial Machinery | 2 | $37B |
|
||
| Healthcare | 1 | $177B |
|
||
| Pharmaceuticals | 1 | $45B |
|
||
| Metals / Steel | 1 | $18B |
|
||
| Agriculture | 1 | $17B |
|
||
| Packaging | 1 | $12B |
|
||
Price history
+50.2% since first listed9 events — show timeline
- 2026-06-03 Listed $135,000 NIRA MLS as Distributed by MLS Grid
- 2019-02-20 Sold (MLS) $91,000 MIBOR as Distributed by MLS Grid
- 2018-12-03 Pending — MIBOR as Distributed by MLS Grid
- 2018-11-09 Price Changed $95,000 MIBOR as Distributed by MLS Grid
- 2018-10-18 Listed $99,999 MIBOR as Distributed by MLS Grid
- 2012-10-01 Listing Removed — MIBOR as Distributed by MLS Grid
- 2012-06-04 Listed $89,999 MIBOR as Distributed by MLS Grid
- 2004-10-15 Sold (MLS) $83,000 MIBOR as Distributed by MLS Grid
- 2004-03-10 Listed $89,900 MIBOR as Distributed by MLS Grid
Property tax history
+5.2%/yrLatest (2025): $1,142 · -7.2% YoY. Source: county tax records.
Cash-flow waterfall
monthlySold comps — $/sqft
last 12 mo · ≤1 miLoading sold comps…