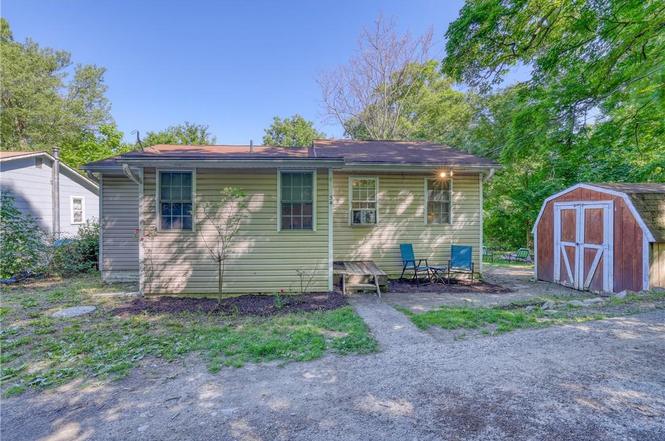
34 Laurel Trl · Mountain Lodge Park, NY
Flood risk 1/10 · Minimal
- FEMA flood zone
- X (unshaded)
- Chance of flooding over 30 yrs
- 0.0%
- Est. flood insurance / yr
- $473 – $860
Fire risk 5/10 · Moderate
- Est. fire insurance / yr
- $691 – $1,283
Heat risk 4/10 · Minor
- Hot days now (above 96°F)
- 7 days/yr
- Hot days in 30 yrs
- 16 days/yr
Wind risk 4/10 · Minor
- Chance of severe wind over 30 yrs
- 15.0%
Air-quality risk 2/10 · Minimal
- Unhealthy air days now
- 1 days/yr
- Unhealthy air days in 30 yrs
- 2 days/yr
Risk factors via First Street. Map © Google.
Why this score? — see what drove the C+ grade
The composite is a weighted blend of 9 inputs, each scored 0–100. Each bar is that input's sub-score; the figure is the points it added to the 100-point composite (weight × sub-score).
- Cash flow +22.1/30.0
- ARV discount +15.0/15.0
- DSCR +7.1/10.0
- 1% rule +6.9/10.0
- Schools +4.8/10.0
- Livability +3.7/5.0
- Rent growth +2.9/5.0
- Condition / age +2.5/5.0
- Appreciation +0.0/10.0
$223,500
🖨 Deal sheet 📄 Offer letter ✓ Due diligence
Listing remarks
Blooming Grove! SELLER IS VERY MOTIVATED. THE OWNER IS SEEKING A QUICK CLOSING. THIS PRESENTS AN EXCELLENT OPPORTUNITY FOR A GREAT DEAL. Fully available!! Affordable ranch with ADJOING LOT INCLLUDED! Great ranch featuring a welcoming interior and a good-sized living room. Very good condition with fresh paint. Eat in kitchen with door leading to the back deck. Other features: central air, shed, furnace replaced in 2014. Short ride to public transportation or Metro North Station with major highways and Stewart Airport only a few miles away. Award winning Washingtonville School District. Won't last!
Key facts
- Furnace replaced
- Eat in kitchen
- Back deck
Tags
Neighborhood map
What this means for you Summary
Snapshot
- This is a 3-bed/1.0-bath single-family listed at $224k.
Deal economics
- At list price, monthly cash flow is $358 ($4k/yr) — positive.
- The deal already cash-flows at list — no discount required.
- Meets the 1% rule at list price ($3k rent vs $224k).
- Recommended offer: $210k (6.0% below list) — sets the bar for market timing.
- Cap rate 8.2% vs local median 5.3% in Mountain Lodge Park — top-decile yield for the area; either an underpriced asset or a hidden risk that comps aren't pricing in. Stress-test before assuming the spread holds.
Location & tenants
- Location reads 73/100 on livability (#308 in NY) — a middle-class / working-renter tenant base. Strengths: employment A+, housing A+, health & safety A+; Watch: amenities F, commute F.
- Washingtonville Central School District (suburban): math 44% / reading 60% proficiency, ranked #288 of 590 in NY (top 49%) — acceptable for families but not a draw, mixed tenant base, ~2y average lease; only 16% free/reduced lunch — higher-income household profile.
- Zoned schools: Round Hill Elementary School (math 27% / reading 52%, grade F, #1,444 of 2,108 statewide, top 71%, 653 students, 38% FRL); Washingtonville Middle School (math 21% / reading 50%, grade F, #473 of 729 statewide, top 66%, 900 students, 35% FRL); Washingtonville Senior High School (math 92% / reading 89%, grade A+, #231 of 1,100 statewide, top 21%, 1,318 students, 29% FRL) — zoned schools average 34% FRL vs 16% district-wide (18 pts higher); higher-poverty schools than district average — tighter screening recommended.
- Market conditions: Rents rising (+1.5%/yr); 316 active listings in the ZIP; 8 comparable units currently listed for rent nearby; rentals at typical pace (median 14d on market — plan ~3-4 weeks tenant-placement turnaround); solid renter incomes; 1,746 units permitted in Orange County in 2024 (1,265 in 5+ unit buildings).
- This rent runs 40% of the median local income ($79k/yr) — at the standard rent-burdened threshold; future hikes will face affordability resistance.
Forward outlook
- Local home prices are declining (-3.0%/yr); year-one equity from $2k of loan paydown is wiped out by about $7k of value loss. Plan a longer hold.
Negotiation context
- It's been on market 64 days — a 6% lower offer ($210k) is reasonable based on typical stale-listing flexibility.
- 8 sale attempts since 15y ago with the ask held roughly flat each time — persistent listings suggest the price (not the market) is what's stuck; bring a comps-based counter.
Risks & watch-outs
- Watch-outs: property tax is 2.5% of price.
- Climate carrying-cost: moderate wildfire risk — expect insurance premiums to compound above CPI over the hold.
Questions for the listing agent
- It's been on market 64 days. Have you received any prior offers? Is the seller open to a 6% concession, seller financing, or rate buy-down credit?
- Built in 1960 — when were the roof, HVAC, electrical panel, plumbing, and water heater last replaced?
- Property tax is high relative to price — has the assessment been appealed recently, and will the sale trigger a re-assessment?
- Why hasn't it sold? Are there any deal-killer items the seller is aware of (foundation, flood, title, zoning, code violations)?
- Is there a deadline driving the sale (1031 exchange, divorce, estate, relocation)? That informs how much negotiation room exists.
- Schools are F-rated, which usually means shorter tenancies and higher turnover. Who's the typical renter profile here, and what's been the actual vacancy rate?
- What's the average days-on-market for RENTAL listings here right now (not sales)? A rising rental-DOM trend means longer vacancies and softer asking-rent achievability than the comps imply.
- What's the recent tenant-quality profile in this submarket — average credit score on applications, eviction rate, late-payment / NSF rate, and stable-employment percentage? A property-management company in the area should have these aggregated.
- How much new for-sale + rental construction is in the pipeline within 1–3 miles? Heavy new supply typically softens prices + rents 12–24 months out; constrained supply supports both.
Investment metrics
- 1% rule
- 1.19% ✓
- Cap rate
- 8.22%
- Cash-on-cash
- 6.87%
- DSCR
- 1.31
- GRM
- 7.0
CMA / ARV
- ARV (on-the-fly)
- $302,400
- Comps found
- 12
Show comp detail 12 sales within ~0.75 mi
| Address | Dist | Beds/Ba | Sqft | Sold | Price | $/sf | Match |
|---|---|---|---|---|---|---|---|
| 39 Hillcrest Trl | 0.03mi | 2/1.0 (-1) | 1,000 (+4%) | 6mo | $295,000 | $295 | 82 |
| 5 Orchard Trl | 0.33mi | 2/1.0 (-1) | 963 (+0%) | 6mo | $264,500 | $275 | 74 |
| 59 Orchard Trl | 0.12mi | 2/1.0 (-1) | 850 (-12%) | 8mo | $217,500 | $256 | 64 |
| 15 Herbst Dr | 0.37mi | 2/1.0 (-1) | 876 (-9%) | 2mo | $339,000 | $387 | 62 |
| 15 Arcadian Trl | 0.46mi | 2/2.0 (-1) | 1,008 (+5%) | 0mo | $162,000 | $161 | 61 |
| 19 Grandview Trl | 0.38mi | 3/2.0 | 1,050 (+9%) | 2mo | $375,000 | $357 | 60 |
| 15 Claremont Trl | 0.54mi | 2/1.0 (-1) | 980 (+2%) | 8mo | $265,000 | $270 | 60 |
| 5 Beverly Trl | 0.61mi | 3/2.0 | 900 (-6%) | 3mo | $315,000 | $350 | 54 |
| 20 Windsor Rd | 0.61mi | 3/1.0 | 900 (-6%) | 9mo | $284,000 | $316 | 54 |
| 9 Ludwig Dr | 0.38mi | 2/1.0 (-1) | 838 (-13%) | 2mo | $285,000 | $340 | 54 |
| 27 Revere Rd | 0.58mi | 3/2.0 | 1,048 (+9%) | 9mo | $330,000 | $315 | 46 |
| 22 Claremont Trl | 0.50mi | 2/1.0 (-1) | 836 (-13%) | 10mo | $250,000 | $299 | 42 |
Match score weights: distance 35% · size 25% · config 20% · recency 20%. Top-matched comps best support the ARV.
Projected returns pro-forma
-3.0% appreciation · 1.5% rent growth · sell at horizon
- IRR
- -7.6%
- Equity multiple
- 0.73×
- Total profit
- $-17,183
- Equity at exit
- $33,325
- IRR
- -0.2%
- Equity multiple
- 0.99×
- Total profit
- $-635
- Equity at exit
- $19,324
Cash invested: $62,580 (down + closing). Projections, not guarantees.
Landlord ↔ Tenant lean methodology
- Overall (STATE)
- 15 Strongly Tenant-Friendly
- State New York
- 15 Strongly Tenant-Friendly · D+10
- County
- — inherits STATE
- City
- — inherits STATE
ZIP-level market 10950
- Rents YoY
- 1.5%
- Active inventory
- 316
- Price-to-rent
- 7.0×
Monthly cashflow live
- Estimated rent
- $2,651 high interval (Pro) →
- Mortgage (P&I)
- −$1,172
- Tax from tax record
- −$471 /mo · $5,647/yr
- Insurance
- −$93
- HOA
- −$0
- Vacancy / Maint / Mgmt
- −$557
- Net cashflow
- $358
Break-even live
UW: 25.0% down · 7.5% · 30yr · 1.5% tax · 5.0% vac · 8.0% maint · 8.0% mgmt
Financing live
Cash to close
- Down payment
- $55,875
- Closing costs
- $6,705
- Reserves months
- —
- Total cash needed
- —
Loan-product check · same deal, 3 products live
Conventional
25% down · 7.5% · 30yr
- Down + closing
- —
- Monthly P&I
- —
- Monthly cashflow
- —
- DSCR
- —
- Eligible?
- —
Personal DTI + credit; lowest rate.
DSCR
20% down · 8.5% · 30yr
- Down + closing
- —
- Monthly P&I
- —
- Monthly cashflow
- —
- DSCR
- —
- Eligible?
- —
No personal income docs; deal must DSCR.
Hard money
10% down · 12.0% · 12mo
- Down + closing
- —
- Monthly P&I
- —
- Monthly cashflow
- —
- DSCR
- —
- Eligible?
- —
Short-term bridge; refi at stabilization.
Rent comps 8 comps
| Address | Beds | Baths | Sqft | Rent | $/sqft | DOM | Units | Dist |
|---|---|---|---|---|---|---|---|---|
| 66 Higgins Trl Blooming Grove, NY | 2.0 | 1.5 | 800 | $1,700 | $2.12 | 14d | 1 | 0.19mi |
| 12 Utopian Trl Monroe, NY | 2.0 | 1.0 | 850 | $2,150 | $2.53 | 14d | 1 | 0.23mi |
| 32 Cedar Trl Monroe, NY | 3.0 | 1.0 | 825 | $2,200 | $2.67 | 23d | 1 | 0.25mi |
| 357 Mountain Lodge Rd Monroe, NY | 2.0 | 1.0 | 760 | $2,000 | $2.63 | 14d | 1 | 0.30mi |
| 14 Woodland Cir S Monroe, NY | 3.0 | 1.0 | 750 | $2,100 | $2.80 | 14d | 1 | 0.32mi |
| 25 Gloria Trl Monroe, NY | 3.0 | 1.0 | 835 | $2,200 | $2.63 | 14d | 1 | 0.34mi |
| 26 Oakwood Trl S Monroe, NY | 2.0 | 1.0 | 696 | $1,750 | $2.51 | 14d | 1 | 0.43mi |
| 2 Edgewood Trl Monroe, NY | 2.0 | 1.0 | 959 | $2,400 | $2.50 | 14d | 1 | 0.70mi |
Listing history 23 events
-
2025-12-24status Pending
-
2025-10-29price $223,500
-
2025-10-20$225,000 Active
-
2025-08-13historical
-
2025-07-22price $250,000
-
2025-07-09price $252,000
-
2025-05-22price $254,000
-
2025-05-14status Active
-
2025-05-02price $255,000
-
2025-05-02status Active
-
2025-02-16$260,000 Active
-
2024-05-27price $260,000
-
2024-05-27status Active
-
2024-04-03status Pending
-
2024-02-27$249,999 Active
-
2022-10-20soldstatus $250,000
-
2022-10-04soldstatus $250,000 Closed
-
2022-09-07status Pending
-
2022-07-25price $264,900
-
2022-07-01$299,900 Active
-
2022-06-24historical $299,900
-
2014-02-06historical
-
2011-09-29
ⓘ Source: listings_history table (triggers on properties + properties_extension) + one-shot
backfill from property_details.listing_events for pre-trigger history.
Tax reassessment forecast NY · Partial reset (capped growth)
- Current annual tax
- $5,647 · $471/mo
- Projected year-2 tax
- $5,647 · $471/mo
- Expected delta
- $0/yr ($0/mo · 0.0%)
ⓘ Screening estimate from a state-policy table — verify with the county assessor before closing.
Climate risk First Street
- Flood 1/10 Low FEMA zone X (unshaded) · 0% chance over 30 yrs
- Wildfire 5/10 Major
- Heat 4/10 Moderate 7 d/yr ≥96°F today · 16 d/yr by 30 yrs out
- Wind 4/10 Moderate 15% chance of damaging wind over 30 yrs
- Air quality 2/10 Low 1 unhealthy d/yr today · 2 by 30 yrs out
Nearby sold comps map
Loading sold comps map…
Walkable amenities ~0.75 mi
Loading nearby amenities…
Taxation est. · year 1
- Rental income
- $31,808
- − Mortgage interest
- −$12,519
- − Property taxes
- −$5,647
- − Insurance
- −$1,118
- − Repairs & maintenance
- −$2,545
- − Management
- −$2,545
- − Depreciation
- −$6,502
- Taxable income
- $933
- Est. tax owed @ 24.0%
- −$224
- After-tax cash flow
- $4,075/yr
For passive investors: Depreciation is non-cash, so a rental often shows a tax loss while cash-flowing — sheltering income. Rental losses are passive: they offset passive income freely, and up to $25,000/yr can offset ordinary (W-2) income if you actively participate and your MAGI is under $100k (phasing out to $0 by $150k); unused losses carry forward. On sale, claimed depreciation is recaptured at up to 25%, and gains may owe capital-gains tax (a 1031 exchange can defer both). Figures are a year-1 estimate at your 24.0% rate — not tax advice; consult a CPA.
Schools (NCES district)
- District
- Washingtonville Central School District
- NCES district ID
- 3630030
- Math proficiency
- 44% ▼ -13.00%
- Reading proficiency
- 60% ▲ 11.00%
- Median HH income
- $89,379
- Composite
- 48.15/100
- National rank
- #2178
- State rank
- #288 of 590 in NY
Livability — Mountain Lodge Park
- Score
- 73/100
- State rank
- #308
- US rank
- #5092
Category grades
Schools grade is shown separately in the Schools card above.
Census & demographics
- Census place
- Mountain Lodge Park, NY
- County
- Orange County · 267,004 people
- Metro
- Poughkeepsie-Newburgh-Middletown, NY
- Population (ZIP)
- 68,136
- Household income
- $78,931
- Rent vs Own
- Severe rent burden
- 3149.0
Population outlook (Orange County) Hauer SSP2
- Today (2025)
- 379,830 people
- By 2030
- 378,955 · -0.2%
- By 2040
- 375,444 · -1.2%
- By 2050
- 369,311 · -2.8%
- By 2075
- 354,233 · -6.7%
- By 2100
- 318,150 · -16.2%
Race, ethnicity, and origin ACS 2023
- Neighborhood character
- Predominantly White (81%)
- Race & ethnicity
- White 81% Hispanic / Latino 12% Two or more races 6% Black 3% Asian 1%
- Hispanic origin (detail)
- Puerto Rican 5% Dominican 2%
- Common ancestry
- Romanian 3% Scandinavian 2% Italian 2%
- Foreign-born
- 11% · Canada, Dominican Republic
- Languages at home
- 33% English-only · German/W. Germanic 52% Spanish 9% Russian/Polish/Slavic 1%
Political lean MEDSL · Orange
- 2024 margin
- Lean R (+8.4) · D 45.8% · R 54.2%
- 2008→2024 swing
- -12.5pp toward R · 2008: 4.1pp · 2024: -8.4pp
- All cycles
- 2024: R+8.4 2020: R+0.2 2016: R+6.5 2012: D+5.2 2008: D+4.1
Not yet ingested
- Civics
- —
Market trends
- HPI YoY
- ▼ -309.81%
- Current HPI
- 314.2081
- Rent YoY
- ▲ 1.50%
- Metro
- Poughkeepsie-Newburgh-Middletown, NY
- State GDP YoY
- ▲ 2.60%
- F500 in state
- 92
Industry mix (Fortune 500 HQ in NY)
| Industry | F500 HQs | Revenue |
|---|---|---|
| Financial Services | 10 | $950B |
|
||
| Consumer Goods | 9 | $162B |
|
||
| Insurance | 4 | $225B |
|
||
| Telecommunications | 2 | $144B |
|
||
| Pharmaceuticals | 2 | $112B |
|
||
| Media / Entertainment | 2 | $69B |
|
||
Price history
-25.5% since first listed23 events — show timeline
- 2025-12-24 Pending — OneKey® MLS as Distributed by MLS Grid
- 2025-10-29 Price Changed $223,500 OneKey® MLS as Distributed by MLS Grid
- 2025-10-20 Listed $225,000 OneKey® MLS as Distributed by MLS Grid
- 2025-08-13 Listing Removed — OneKey® MLS as Distributed by MLS Grid
- 2025-07-22 Price Changed $250,000 OneKey® MLS as Distributed by MLS Grid
- 2025-07-09 Price Changed $252,000 OneKey® MLS as Distributed by MLS Grid
- 2025-05-22 Price Changed $254,000 OneKey® MLS as Distributed by MLS Grid
- 2025-05-14 Relisted — OneKey® MLS as Distributed by MLS Grid
- 2025-05-02 Price Changed $255,000 OneKey® MLS as Distributed by MLS Grid
- 2025-05-02 Relisted — OneKey® MLS as Distributed by MLS Grid
- 2025-02-16 Listed $260,000 OneKey® MLS as Distributed by MLS Grid
- 2024-05-27 Price Changed $260,000 OneKey® MLS as Distributed by MLS Grid
- 2024-05-27 Relisted — OneKey® MLS as Distributed by MLS Grid
- 2024-04-03 Pending — OneKey® MLS as Distributed by MLS Grid
- 2024-02-27 Listed $249,999 OneKey® MLS as Distributed by MLS Grid
- 2022-10-20 Sold (Public Records) $250,000 Public Records
- 2022-10-04 Sold (MLS) $250,000 OneKey® MLS as Distributed by MLS Grid
- 2022-09-07 Pending — OneKey® MLS as Distributed by MLS Grid
- 2022-07-25 Price Changed $264,900 OneKey® MLS as Distributed by MLS Grid
- 2022-07-01 Listed $299,900 OneKey® MLS as Distributed by MLS Grid
- 2022-06-24 Coming Soon $299,900 OneKey® MLS as Distributed by MLS Grid
- 2014-02-06 Delisted — HGMLS
- 2011-09-29 Listed — HGMLS
Property tax history
+3.3%/yrLatest (2025): $5,647 · +1.0% YoY. Source: county tax records.
Cash-flow waterfall
monthlySold comps — $/sqft
last 12 mo · ≤1 miLoading sold comps…