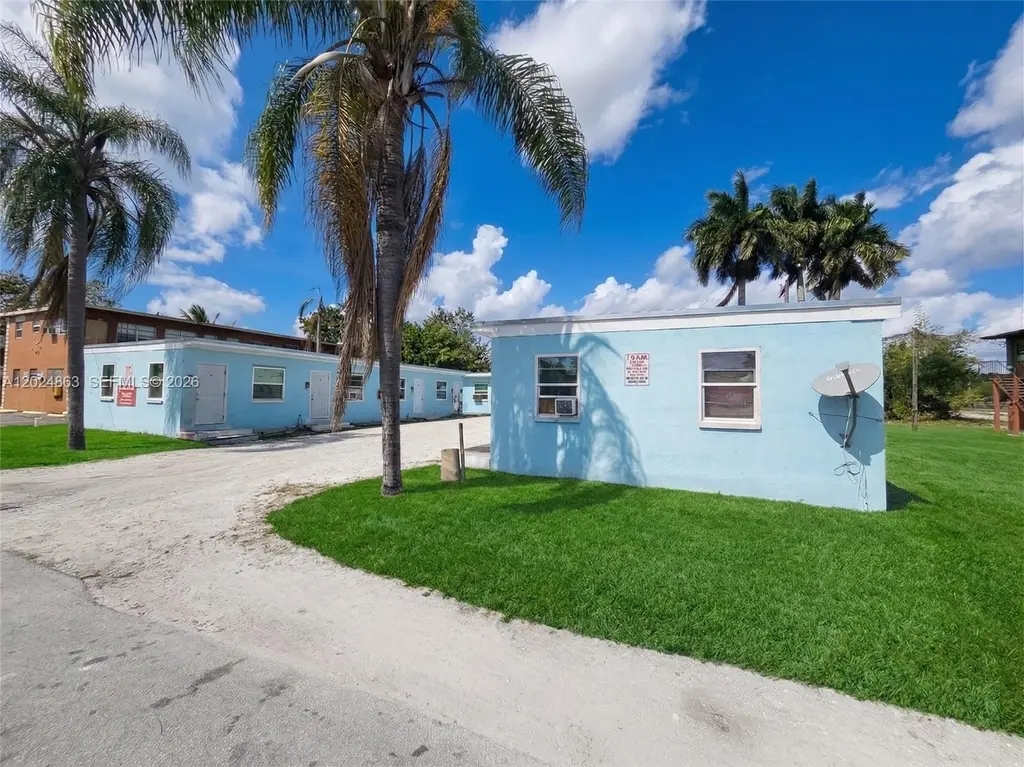
 12-Plex
625 W Avenue A · Belle Glade, FL
Flood risk 1/10 · Minimal
- FEMA flood zone
- X (unshaded)
- Chance of flooding over 30 yrs
- 0.0%
- Est. flood insurance / yr
- $507 – $1,088
Fire risk 1/10 · Minimal
- Est. fire insurance / yr
- $947 – $1,759
Heat risk 9/10 · Severe
- Hot days now (above 108°F)
- 7 days/yr
- Hot days in 30 yrs
- 29 days/yr
Wind risk 10/10 · Severe
- Chance of severe wind over 30 yrs
- 99.0%
Air-quality risk 2/10 · Minimal
- Unhealthy air days now
- 1 days/yr
- Unhealthy air days in 30 yrs
- 1 days/yr
Risk factors via First Street. Map © Google.
Why this score? — see what drove the B grade
The composite is a weighted blend of 9 inputs, each scored 0–100. Each bar is that input's sub-score; the figure is the points it added to the 100-point composite (weight × sub-score).
- Cash flow +30.0/30.0
- DSCR +10.0/10.0
- 1% rule +9.2/10.0
- ARV discount +7.5/15.0
- Schools +4.3/10.0
- Condition / age +3.8/5.0
- Livability +3.0/5.0
- Rent growth +2.5/5.0
- Appreciation +0.0/10.0
$700,000
🖨 Deal sheet 📄 Offer letter ✓ Due diligence
Multi-family units
County records classify this as Multi-Family (2-4 Unit). Listing-text estimate: 12 units. estimate disagrees with records
Listing remarks
Well-maintained 12-unit multifamily investment property located in Belle Glade. Strong income-producing asset with 11 of 12 units currently occupied and generating rental income, offering immediate cash flow for investors. One vacant unit provides opportunity for lease-up or value-add improvements. Property is well maintained and positioned for continued stable performance in a consistent rental market. Ideal for portfolio expansion or first-time multifamily investors seeking a turnkey income-producing asset.
Key facts
- 4 parking spots
- Built 1950
- Listed 24 days
Property features AI
Exterior
- Parking: 4 total parking spaces
- Utilities: Cable available; Public sewer
- Home design: Single-story; Block construction
- Construction: Block construction
- Exterior features: Lot smaller than a quarter acre; Zoned R3
Interior
- Heating & cooling: Wall/window air conditioning units
- Interior features: Ceramic tile flooring
Neighborhood map
What this means for you Summary
Snapshot
- This is a 12 × 1-bed/1-bath units multifamily listed at $700k. Condition is rated good.
Deal economics
- At list price, monthly cash flow is $3k ($36k/yr) — positive. Per door: $252/mo.
- The deal already cash-flows at list — no discount required.
- Meets the 1% rule at list price ($10k rent vs $700k).
- Recommended offer: $690k (1.5% below list) — sets the bar for market timing.
Location & tenants
- Location reads 59/100 on livability (#812 in FL) — a working-class tenant base; expect higher turnover. Strengths: cost of living A+, health & safety A+, housing A-; Watch: schools F, crime F, amenities F.
- Palm Beach (suburban): math 46% / reading 53% proficiency, ranked #34 of 73 in FL (top 47%) — families likely to look elsewhere, expect single-tenant / working-renter base with shorter leases.
- Market conditions: 37 active listings in the ZIP; 3,974 units permitted in Palm Beach County in 2024 (1,012 in 5+ unit buildings).
Forward outlook
- Local home prices are declining (-3.0%/yr); year-one equity from $5k of loan paydown is wiped out by about $21k of value loss. Plan a longer hold.
- Palm Beach County population projected at +30% by 2050 — long-run rental-demand tailwind backs the buy-and-hold thesis.
- At projected returns (-3.0% appreciation + 3.0% rent growth), your $196k cash investment doubles in ~7 years — after that, you're playing with house money.
Negotiation context
- It's been on market 24 days — a 2% lower offer ($690k) is reasonable based on typical stale-listing flexibility.
- 5 sale attempts since 10y ago with the ask held roughly flat each time — persistent listings suggest the price (not the market) is what's stuck; bring a comps-based counter.
Risks & watch-outs
- Watch-outs: built in 1950 — expect roof / HVAC / electrical / plumbing capex.
- Climate carrying-cost: severe wind risk, 99% chance of damaging wind over 30y; extreme-heat days projected 7→29/yr by 2055 (HVAC capex compounding) — expect insurance premiums to compound above CPI over the hold.
Questions for the listing agent
- Can we see the unit-by-unit rent roll, current vacancy, and any below-market leases? What's the average tenancy length?
- What capital expenditures (roof, boiler, parking lot, exteriors) have been made in the last 5 years, and what's planned in the next 2?
- Built in 1950 — when were the roof, HVAC, electrical panel, plumbing, and water heater last replaced?
- Is there a deadline driving the sale (1031 exchange, divorce, estate, relocation)? That informs how much negotiation room exists.
- Schools are F-rated, which usually means shorter tenancies and higher turnover. Who's the typical renter profile here, and what's been the actual vacancy rate?
- Crime grade is F in this area — have there been break-ins, vandalism, or insurance claims at this property in the last 3 years? What carrier currently insures it and at what premium?
- What's the average days-on-market for RENTAL listings here right now (not sales)? A rising rental-DOM trend means longer vacancies and softer asking-rent achievability than the comps imply.
- What's the recent tenant-quality profile in this submarket — average credit score on applications, eviction rate, late-payment / NSF rate, and stable-employment percentage? A property-management company in the area should have these aggregated.
- How much new apartment / multifamily construction is in the pipeline within 1–3 miles? Heavy new supply (>2% of stock underway) typically softens rents 12–24 months out; light construction supports rent growth.
Investment metrics
- 1% rule
- 1.42% ✓
- Cap rate
- 11.48%
- Cash-on-cash
- 18.51%
- DSCR
- 1.82
- GRM
- 5.9
CMA / ARV
No comps found within radius.
Projected returns pro-forma
-3.0% appreciation · 3.0% rent growth · sell at horizon
- IRR
- 10.2%
- Equity multiple
- 1.40×
- Total profit
- $79,304
- Equity at exit
- $104,372
- IRR
- 19.4%
- Equity multiple
- 2.62×
- Total profit
- $317,649
- Equity at exit
- $60,523
Cash invested: $196,000 (down + closing). Projections, not guarantees.
Landlord ↔ Tenant lean methodology
- Overall (STATE)
- 87 Strongly Landlord-Friendly
- State Florida
- 87 Strongly Landlord-Friendly · R+3
- County
- — inherits STATE
- City
- — inherits STATE
ZIP-level market 33430
- Home prices YoY
- -21.0%
- Active inventory
- 37
- Price-to-rent
- 70.3×
Monthly cashflow live
- Estimated rent
- $9,951 medium interval (Pro) →
- Mortgage (P&I)
- −$3,671
- Tax est. 1.5%
- −$875 /mo · $10,500/yr
- Insurance
- −$292
- HOA
- −$0
- Vacancy / Maint / Mgmt
- −$2,090
- Net cashflow
- $3,024
Break-even live
12-unit breakdown (identical units grouped — click to expand)
| Units | Beds | Baths | Est. rent |
|---|---|---|---|
| 12× units | 1 | 1 | $9,948 |
| #1 | 1 | 1 | $829 |
| #2 | 1 | 1 | $829 |
| #3 | 1 | 1 | $829 |
| #4 | 1 | 1 | $829 |
| #5 | 1 | 1 | $829 |
| #6 | 1 | 1 | $829 |
| #7 | 1 | 1 | $829 |
| #8 | 1 | 1 | $829 |
| #9 | 1 | 1 | $829 |
| #10 | 1 | 1 | $829 |
| #11 | 1 | 1 | $829 |
| #12 | 1 | 1 | $829 |
| Total (12 units) | $9,951 | ||
UW: 25.0% down · 7.5% · 30yr · 1.5% tax · 5.0% vac · 8.0% maint · 8.0% mgmt
Financing live
Cash to close
- Down payment
- $175,000
- Closing costs
- $21,000
- Reserves months
- —
- Total cash needed
- —
Loan-product check · same deal, 3 products live
Conventional
25% down · 7.5% · 30yr
- Down + closing
- —
- Monthly P&I
- —
- Monthly cashflow
- —
- DSCR
- —
- Eligible?
- —
Personal DTI + credit; lowest rate.
DSCR
20% down · 8.5% · 30yr
- Down + closing
- —
- Monthly P&I
- —
- Monthly cashflow
- —
- DSCR
- —
- Eligible?
- —
No personal income docs; deal must DSCR.
Hard money
10% down · 12.0% · 12mo
- Down + closing
- —
- Monthly P&I
- —
- Monthly cashflow
- —
- DSCR
- —
- Eligible?
- —
Short-term bridge; refi at stabilization.
Listing history 23 events
-
2026-06-18days on market $700,000 Active 24 DOM
-
2026-06-17pricedays on market $700,000 Active 23 DOM
-
2026-06-16days on market $720,000 Active 22 DOM
-
2026-06-15days on market $720,000 Active 21 DOM
-
2026-06-13days on market $720,000 Active 19 DOM
-
2026-06-09days on market $720,000 Active 15 DOM
-
2026-06-08days on market $720,000 Active 14 DOM
-
2026-06-07days on market $720,000 Active 13 DOM
-
2026-06-04days on market $720,000 Active 10 DOM
-
2026-06-03days on market $720,000 Active 9 DOM
-
2026-06-02days on market $720,000 Active 8 DOM
-
2026-06-01days on market $720,000 Active 7 DOM
-
2026-05-31days on market $720,000 Active 6 DOM
-
2026-05-25$720,000 Active
-
2024-06-05historical
-
2024-05-20status Active
-
2023-06-27status Pending
-
2022-09-17$725,000 Active
-
2022-05-27historical
-
2022-05-04price $725,000
-
2021-12-27$625,000 Active
-
2016-12-31historical
-
2016-06-08$340,000
ⓘ Source: listings_history table (triggers on properties + properties_extension) + one-shot
backfill from property_details.listing_events for pre-trigger history.
Climate risk First Street
- Flood 1/10 Low FEMA zone X (unshaded) · 0% chance over 30 yrs
- Wildfire 1/10 Low
- Heat 9/10 Extreme 7 d/yr ≥108°F today · 29 d/yr by 30 yrs out
- Wind 10/10 Extreme 99% chance of damaging wind over 30 yrs
- Air quality 2/10 Low 1 unhealthy d/yr today · 1 by 30 yrs out
Nearby sold comps map
Loading sold comps map…
Walkable amenities ~0.75 mi
Loading nearby amenities…
Taxation est. · year 1
- Rental income
- $119,412
- − Mortgage interest
- −$39,211
- − Property taxes
- −$10,500
- − Insurance
- −$3,500
- − Repairs & maintenance
- −$9,553
- − Management
- −$9,553
- − Depreciation
- −$20,364
- Taxable income
- $26,732
- Est. tax owed @ 24.0%
- −$6,416
- After-tax cash flow
- $29,869/yr
For passive investors: Depreciation is non-cash, so a rental often shows a tax loss while cash-flowing — sheltering income. Rental losses are passive: they offset passive income freely, and up to $25,000/yr can offset ordinary (W-2) income if you actively participate and your MAGI is under $100k (phasing out to $0 by $150k); unused losses carry forward. On sale, claimed depreciation is recaptured at up to 25%, and gains may owe capital-gains tax (a 1031 exchange can defer both). Figures are a year-1 estimate at your 24.0% rate — not tax advice; consult a CPA.
Condition & rehab AI · 12 photos
This 12-unit multifamily property is well-maintained and ready for immediate occupancy, with minor cosmetic updates to enhance its curb appeal and value.
Value-add opportunities
- Both Paint exterior siding — Enhances curb appeal and property value.
- Both Replace light fixture in kitchen — Improves kitchen aesthetics and functionality.
Renovation cost estimate screening
Value-add ROI direction
- Both Paint exterior siding — Enhances curb appeal and property value. ↑
- Both Replace light fixture in kitchen — Improves kitchen aesthetics and functionality. ↑
ⓘ Cost ranges are severity-bucket heuristics (US national rule-of-thumb). Get contractor quotes + a written scope before underwriting a rehab budget.
Schools (NCES district)
- District
- Palm Beach
- NCES district ID
- 1201500
- Math proficiency
- 46% ▼ -16.00%
- Reading proficiency
- 53% ▼ -4.00%
- Median HH income
- $53,943
- Composite
- 42.72/100
- National rank
- #3160
- State rank
- #34 of 73 in FL
Livability — Belle Glade
- Score
- 59/100
- State rank
- #812
- US rank
- #19736
Category grades
Schools grade is shown separately in the Schools card above.
Census & demographics
- Census place
- Belle Glade, FL
- Population (ZIP)
- 19,773
Population outlook (Palm Beach County) Hauer SSP2
- Today (2025)
- 1,637,487 people
- By 2030
- 1,743,255 · +6.5%
- By 2040
- 1,948,712 · +19.0%
- By 2050
- 2,132,979 · +30.3%
- By 2075
- 2,530,027 · +54.5%
- By 2100
- 2,706,979 · +65.3%
Race, ethnicity, and origin ACS 2023
- Neighborhood character
- Diverse neighborhood (Simpson 0.61)
- Race & ethnicity
- Black 53% Hispanic / Latino 31% Two or more races 13% White 12% Asian 1%
- Hispanic origin (detail)
- Mexican 22% Puerto Rican 1% Cuban 4%
- Common ancestry
- Hispanic 13%
- Foreign-born
- 28% · Canada, Guatemala
- Languages at home
- 56% English-only · Spanish 27% French/Haitian/Cajun 13% Arabic 3%
Political lean MEDSL · Palm Beach
- 2024 margin
- Toss-up / Even · D 50.0% · R 49.2%
- 2008→2024 swing
- -22.1pp toward R · 2008: 22.9pp · 2024: 0.8pp
- All cycles
- 2024: D+0.8 2020: D+12.8 2016: D+15.3 2012: D+17.0 2008: D+22.9
Not yet ingested
- Civics
- —
Market trends
- HPI YoY
- ▼ -76.12%
- Current HPI
- 286.6788
- Rent YoY
- —
- Metro
- —
- State GDP YoY
- ▲ 3.28%
- F500 in state
- 36
Industry mix (Fortune 500 HQ in FL)
| Industry | F500 HQs | Revenue |
|---|---|---|
| Industrial Technology | 2 | $29B |
|
||
| Insurance | 2 | $17B |
|
||
| Retail | 1 | $60B |
|
||
| Technology Distribution | 1 | $58B |
|
||
| Homebuilding | 1 | $35B |
|
||
| Technology Manufacturing | 1 | $35B |
|
||
Price history
+111.8% since first listed10 events — show timeline
- 2026-05-25 Listed $720,000 MARMLS
- 2024-06-05 Listing Removed — MARMLS
- 2024-05-20 Relisted — MARMLS
- 2023-06-27 Pending — MARMLS
- 2022-09-17 Listed $725,000 MARMLS
- 2022-05-27 Listing Removed — MARMLS
- 2022-05-04 Price Changed $725,000 MARMLS
- 2021-12-27 Listed $625,000 MARMLS
- 2016-12-31 Listing Removed — MARMLS
- 2016-06-08 Listed $340,000 MARMLS
Cash-flow waterfall
monthlySold comps — $/sqft
last 12 mo · ≤1 miLoading sold comps…