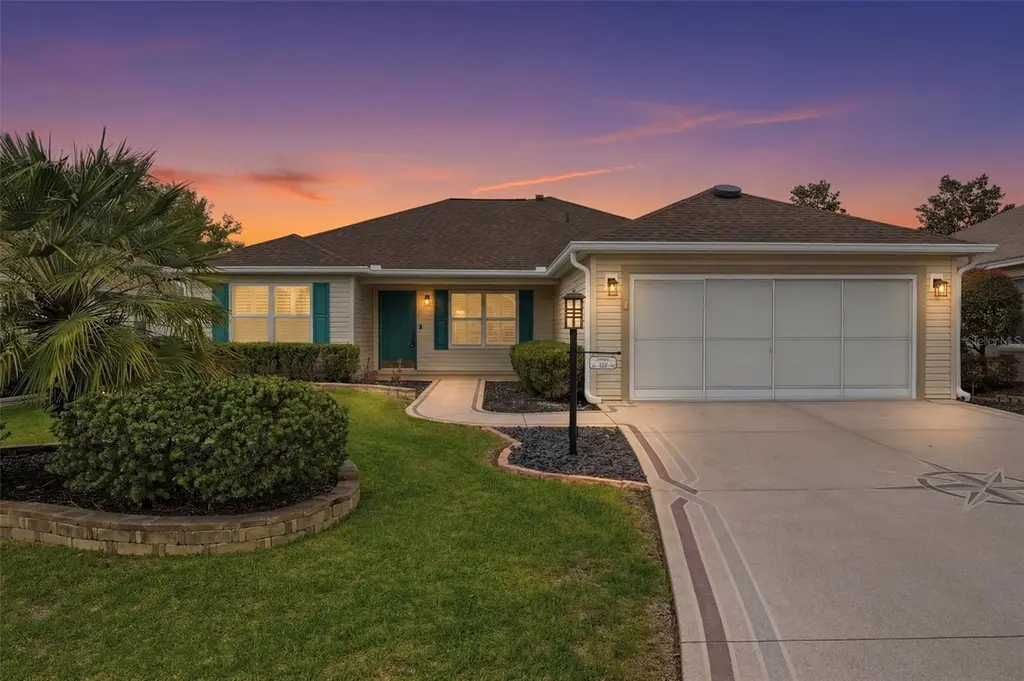
519 Weston Manor Dr · The Villages, FL
Flood risk 1/10 · Minimal
- FEMA flood zone
- X (unshaded)
- Chance of flooding over 30 yrs
- 0.0%
- Est. flood insurance / yr
- $507 – $1,088
Fire risk 4/10 · Minor
- Est. fire insurance / yr
- $947 – $1,759
Heat risk 9/10 · Severe
- Hot days now (above 109°F)
- 7 days/yr
- Hot days in 30 yrs
- 22 days/yr
Wind risk 9/10 · Severe
- Chance of severe wind over 30 yrs
- 99.0%
Air-quality risk 3/10 · Minor
- Unhealthy air days now
- 2 days/yr
- Unhealthy air days in 30 yrs
- 3 days/yr
Risk factors via First Street. Map © Google.
Why this score? — see what drove the C- grade
The composite is a weighted blend of 9 inputs, each scored 0–100. Each bar is that input's sub-score; the figure is the points it added to the 100-point composite (weight × sub-score).
- Cash flow +19.7/30.0
- DSCR +6.2/10.0
- ARV discount +6.2/15.0
- Schools +5.2/10.0
- 1% rule +4.5/10.0
- Rent growth +3.5/5.0
- Livability +3.5/5.0
- Condition / age +2.5/5.0
- Appreciation +0.0/10.0
$374,900
🖨 Deal sheet 📄 Offer letter ✓ Due diligence
Listing remarks
One or more photo(s) has been virtually staged. Welcome to this beautifully updated Bougainvilla Designer home (floor plan in attachments) situated between 466 and 466a, located in the sought-after Village of Bonnie Brook, a well-established designer neighborhood in The Villages. This 3-bedroom, 2-bath home with a 2-car garage offers the perfect blend of comfort, style, and peace of mind. Built in 2003 and completely remodeled in 2022, this home features major upgrades including a new roof, HVAC system, and gas hot water heater, giving you confidence for years to come. Inside, you’ll find engineered wood flooring and luxury vinyl tile throughout, complemented by granite countertops, n
Key facts
- Gas hot water heater
- Completely remodeled
- Hvac system
Tags
Neighborhood map
What this means for you Summary
Snapshot
- This is a 3-bed/2.0-bath single-family listed at $375k.
Deal economics
- At list price, monthly cash flow is $442 ($5k/yr) — positive.
- The deal already cash-flows at list — no discount required.
- To meet the 1% rule (rent ≥ 1% of price), the offer needs to be $357k (4.8% below list).
- Recommended offer: $357k (4.8% below list) — sets the bar for 1% rule.
- Cap rate 7.7% vs local median 5.0% in The Villages — top-decile yield for the area; either an underpriced asset or a hidden risk that comps aren't pricing in. Stress-test before assuming the spread holds.
Location & tenants
- Location reads 70/100 on livability (#431 in FL) — a middle-class / working-renter tenant base. Strengths: schools A+, crime A+, housing A; Watch: amenities F, commute F, health & safety F.
- Sumter (rural): math 61% / reading 61% proficiency, ranked #11 of 73 in FL (top 15%) — acceptable for families but not a draw, mixed tenant base, ~2y average lease.
- Market conditions: Rents rising (+3.9%/yr); 550 active listings in the ZIP; 22 comparable units currently listed for rent nearby; rentals at typical pace (median 21d on market — plan ~3-4 weeks tenant-placement turnaround); 3,961 units permitted in Sumter County in 2024 (248 in 5+ unit buildings).
- At $3,567/mo this rent would consume 58% of the median local household income ($74k/yr) (locally 987% of renters already pay >50% of income on rent) — very limited rent-growth headroom before tenants either downsize or default.
Forward outlook
- Local home prices are declining (-3.0%/yr); year-one equity from $3k of loan paydown is wiped out by about $11k of value loss. Plan a longer hold.
- Sumter County population projected at +45% by 2050 — long-run rental-demand tailwind backs the buy-and-hold thesis.
Negotiation context
- It's been on market 23 days — a 2% lower offer ($369k) is reasonable based on typical stale-listing flexibility.
- 2 sale attempts with the ask held roughly flat each time — persistent listings suggest the price (not the market) is what's stuck; bring a comps-based counter.
- Current owner paid $218k; list at $375k implies a 72% gain — meaningful room to come down on a strong offer.
Risks & watch-outs
- Climate carrying-cost: severe wind risk, 99% chance of damaging wind over 30y; extreme-heat days projected 7→22/yr by 2055 (HVAC capex compounding) — expect insurance premiums to compound above CPI over the hold.
Questions for the listing agent
- Is there a deadline driving the sale (1031 exchange, divorce, estate, relocation)? That informs how much negotiation room exists.
- Schools are A-rated — typically a magnet for longer-tenancy family renters. What's the average tenant stay here, and is there a school-zone premium baked into asking?
- What's the average days-on-market for RENTAL listings here right now (not sales)? A rising rental-DOM trend means longer vacancies and softer asking-rent achievability than the comps imply.
- What's the recent tenant-quality profile in this submarket — average credit score on applications, eviction rate, late-payment / NSF rate, and stable-employment percentage? A property-management company in the area should have these aggregated.
- How much new for-sale + rental construction is in the pipeline within 1–3 miles? Heavy new supply typically softens prices + rents 12–24 months out; constrained supply supports both.
Investment metrics
- 1% rule
- 0.95% ✗
- Cap rate
- 7.71%
- Cash-on-cash
- 5.06%
- DSCR
- 1.22
- GRM
- 8.8
CMA / ARV
- ARV (on-the-fly)
- $364,210
- Comps found
- 12
Show comp detail 12 sales within ~0.75 mi
| Address | Dist | Beds/Ba | Sqft | Sold | Price | $/sf | Match |
|---|---|---|---|---|---|---|---|
| 519 Weston Manor Dr | 0.00mi | 3/2.0 | 1,505 (0%) | 1mo | $374,900 | $249 | 99 |
| 1867 Treadwell Ter | 0.33mi | 3/2.0 | 1,572 (+4%) | 1mo | $325,000 | $207 | 77 |
| 871 Castleberry Cir | 0.33mi | 3/2.0 | 1,572 (+4%) | 2mo | $390,750 | $249 | 76 |
| 2104 Callaway Dr | 0.23mi | 3/2.0 | 1,392 (-8%) | 2mo | $310,000 | $223 | 75 |
| 1981 Anniston Dr | 0.15mi | 3/2.0 | 1,685 (+12%) | 2mo | $428,500 | $254 | 72 |
| 2297 Welcome Way | 0.41mi | 3/2.0 | 1,392 (-8%) | 0mo | $330,000 | $237 | 68 |
| 1932 Alistar Ct | 0.24mi | 3/2.0 | 1,695 (+13%) | 1mo | $335,000 | $198 | 67 |
| 3189 Atwell Ave | 0.73mi | 3/2.0 | 1,477 (-2%) | 0mo | $315,000 | $213 | 63 |
| 604 Hartley Pl | 0.42mi | 3/2.0 | 1,658 (+10%) | 1mo | $409,000 | $247 | 63 |
| 3249 Mansfield St | 0.74mi | 3/2.0 | 1,527 (+2%) | 1mo | $336,000 | $220 | 62 |
| 610 Danbury St | 0.59mi | 3/2.0 | 1,407 (-6%) | 1mo | $340,000 | $242 | 60 |
| 2000 Ardmore Way | 0.48mi | 3/2.0 | 1,695 (+13%) | 2mo | $475,900 | $281 | 54 |
Match score weights: distance 35% · size 25% · config 20% · recency 20%. Top-matched comps best support the ARV.
Projected returns pro-forma
-3.0% appreciation · 3.92% rent growth · sell at horizon
- IRR
- -7.5%
- Equity multiple
- 0.72×
- Total profit
- $-29,332
- Equity at exit
- $55,899
- IRR
- 3.1%
- Equity multiple
- 1.23×
- Total profit
- $24,338
- Equity at exit
- $32,415
Cash invested: $104,972 (down + closing). Projections, not guarantees.
Landlord ↔ Tenant lean methodology
- Overall (STATE)
- 87 Strongly Landlord-Friendly
- State Florida
- 87 Strongly Landlord-Friendly · R+3
- County
- — inherits STATE
- City
- — inherits STATE
ZIP-level market 32162
- Home prices YoY
- -6.9%
- Rents YoY
- 3.9%
- Active inventory
- 550
- Price-to-rent
- 8.8×
Monthly cashflow live
- Estimated rent
- $3,567 high interval (Pro) →
- Mortgage (P&I)
- −$1,966
- Tax from tax record
- −$254 /mo · $3,044/yr
- Insurance
- −$156
- HOA
- −$0
- Vacancy / Maint / Mgmt
- −$749
- Net cashflow
- $442
Break-even live
UW: 25.0% down · 7.5% · 30yr · 1.5% tax · 5.0% vac · 8.0% maint · 8.0% mgmt
Financing live
Cash to close
- Down payment
- $93,725
- Closing costs
- $11,247
- Reserves months
- —
- Total cash needed
- —
Loan-product check · same deal, 3 products live
Conventional
25% down · 7.5% · 30yr
- Down + closing
- —
- Monthly P&I
- —
- Monthly cashflow
- —
- DSCR
- —
- Eligible?
- —
Personal DTI + credit; lowest rate.
DSCR
20% down · 8.5% · 30yr
- Down + closing
- —
- Monthly P&I
- —
- Monthly cashflow
- —
- DSCR
- —
- Eligible?
- —
No personal income docs; deal must DSCR.
Hard money
10% down · 12.0% · 12mo
- Down + closing
- —
- Monthly P&I
- —
- Monthly cashflow
- —
- DSCR
- —
- Eligible?
- —
Short-term bridge; refi at stabilization.
Rent comps 22 comps
| Address | Beds | Baths | Sqft | Rent | $/sqft | DOM | Units | Dist |
|---|---|---|---|---|---|---|---|---|
| 424 Bowman Ter The Villages, FL | 3.0 | 2.0 | 2000 | $5,400 | $2.70 | 21d | 1 | 0.23mi |
| 650 Richland Rd The Villages, FL | 2.0 | 2.0 | 1188 | $4,500 | $3.79 | 21d | 1 | 0.29mi |
| 2111 Thornton Ter The Villages, FL | 2.0 | 2.0 | 1156 | $4,400 | $3.81 | 21d | 1 | 0.30mi |
| 3292 Riverton Rd The Villages, FL | 2.0 | 2.0 | 1143 | $2,100 | $1.84 | 21d | 1 | 0.68mi |
| 6367 NE 118th Ave The Villages, FL | 3.0–4.0 | 2.0–2.5 | 1645 | $1,925 | $1.17 | 21d | 10 | 0.70mi |
| 3260 Atwell Ave The Villages, FL | 3.0 | 2.0 | 1392 | $2,500 | $1.80 | 21d | 1 | 0.79mi |
| 2340 Pickens Pl The Villages, FL | 2.0 | 2.0 | 1156 | $1,900 | $1.64 | 21d | 1 | 0.87mi |
| 3207 Woodridge Dr The Villages, FL | 2.0 | 2.0 | 1148 | $4,200 | $3.66 | 21d | 1 | 0.88mi |
| 2390 Southern Oak St The Villages, FL | 2.0 | 2.0 | 1156 | $5,300 | $4.58 | 21d | 1 | 0.91mi |
| 3301 Archer Ave The Villages, FL | 2.0 | 2.0 | 2117 | $5,000 | $2.36 | 21d | 1 | 0.95mi |
| 3489 Cambria Cir The Villages, FL | 2.0 | 2.0 | 1188 | $1,745 | $1.47 | 21d | 1 | 1.03mi |
| 888 Radclife Berea Pl The Villages, FL | 2.0 | 2.0 | 1288 | $4,200 | $3.26 | 21d | 1 | 1.07mi |
| 5308 Bowline Ct Oxford, FL | 3.0 | 2.0 | 1402 | $1,800 | $1.28 | 21d | 1 | 1.12mi |
| 971 Kingmont Ter The Villages, FL | 3.0 | 2.0 | 1392 | $3,400 | $2.44 | 21d | 1 | 1.17mi |
| 2685 Craven Way The Villages, FL | 2.0 | 2.0 | 1156 | $4,600 | $3.98 | 21d | 1 | 1.17mi |
| 2738 Morven Park Way The Villages, FL | 2.0 | 2.0 | 2175 | $4,000 | $1.84 | 21d | 1 | 1.17mi |
| 5336 Edgewater Way Unit 5336 Oxford, FL | 3.0 | 2.0 | 1291 | $2,000 | $1.55 | 21d | 1 | 1.22mi |
| 3545 Idlewood Loop The Villages, FL | 2.0 | 2.0 | 1240 | $4,500 | $3.63 | 21d | 1 | 1.26mi |
| 10339 Addison Shore Way Oxford, FL | 3.0 | 2.0 | 1969 | $2,700 | $1.37 | 21d | 1 | 1.27mi |
| 2864 Leicester Ter Unit 1525680P The Villages, FL | 2.0 | 2.0 | 1130 | $2,090 | $1.85 | 21d | 1 | 1.35mi |
| 12020 Brush Hill Rd Oxford, FL | 1.0–3.0 | 1.0–2.0 | 947 | $2,295 | $2.42 | 21d | 15 | 1.38mi |
| 12362 NE 50th Vw Oxford, FL | 4.0 | 4.0 | 1929 | $2,300 | $1.19 | 21d | 1 | 1.40mi |
Listing history 5 events
-
2026-04-20status Pending
-
2026-03-30status Active
-
2026-03-28status Pending
-
2026-03-26$374,900 Active
-
2011-03-10soldstatus $217,500
ⓘ Source: listings_history table (triggers on properties + properties_extension) + one-shot
backfill from property_details.listing_events for pre-trigger history.
Tax reassessment forecast FL · Resets to sale price
- Current annual tax
- $3,044 · $254/mo
- Projected year-2 tax
- $3,112 · $259/mo
- Expected delta
- +$68/yr (+$6/mo · 2.2%)
ⓘ Screening estimate from a state-policy table — verify with the county assessor before closing.
Climate risk First Street
- Flood 1/10 Low FEMA zone X (unshaded) · 0% chance over 30 yrs
- Wildfire 4/10 Moderate
- Heat 9/10 Extreme 7 d/yr ≥109°F today · 22 d/yr by 30 yrs out
- Wind 9/10 Extreme 99% chance of damaging wind over 30 yrs
- Air quality 3/10 Moderate 2 unhealthy d/yr today · 3 by 30 yrs out
Nearby sold comps map
Loading sold comps map…
Walkable amenities ~0.75 mi
Loading nearby amenities…
Taxation est. · year 1
- Rental income
- $42,806
- − Mortgage interest
- −$21,000
- − Property taxes
- −$3,044
- − Insurance
- −$1,874
- − Repairs & maintenance
- −$3,424
- − Management
- −$3,424
- − Depreciation
- −$10,906
- Taxable loss
- −$867
- Est. tax savings @ 24.0%
- +$208
- After-tax cash flow
- $5,515/yr
For passive investors: Depreciation is non-cash, so a rental often shows a tax loss while cash-flowing — sheltering income. Rental losses are passive: they offset passive income freely, and up to $25,000/yr can offset ordinary (W-2) income if you actively participate and your MAGI is under $100k (phasing out to $0 by $150k); unused losses carry forward. On sale, claimed depreciation is recaptured at up to 25%, and gains may owe capital-gains tax (a 1031 exchange can defer both). Figures are a year-1 estimate at your 24.0% rate — not tax advice; consult a CPA.
Schools (NCES district)
- District
- Sumter
- NCES district ID
- 1201800
- Math proficiency
- 61% ▼ -4.00%
- Reading proficiency
- 61% ▼ -2.00%
- Median HH income
- $48,240
- Composite
- 51.74/100
- National rank
- #1682
- State rank
- #11 of 73 in FL
Livability — The Villages
- Score
- 70/100
- State rank
- #431
- US rank
- #7363
Category grades
Schools grade is shown separately in the Schools card above.
Census & demographics
- Census place
- The Villages, FL
- County
- Sumter County · 110,591 people
- City population
- 83,973
- Metro
- The Villages, FL
- Population (ZIP)
- 55,424
- Household income
- $74,119
- Rent vs Own
- Severe rent burden
- 987.0
Population outlook (Sumter County) Hauer SSP2
- Today (2025)
- 161,172 people
- By 2030
- 180,083 · +11.7%
- By 2040
- 209,892 · +30.2%
- By 2050
- 234,186 · +45.3%
- By 2075
- 284,602 · +76.6%
- By 2100
- 317,039 · +96.7%
Race, ethnicity, and origin ACS 2023
- Neighborhood character
- Predominantly White (95%)
- Race & ethnicity
- White 95% Two or more races 2% Hispanic / Latino 2% Asian 1% Black 1%
- Common ancestry
- Romanian 7% Slovak 4% Lithuanian 4%
- Foreign-born
- 5% · Canada
- Languages at home
- 96% English-only · Spanish 1% Tagalog/Filipino 1%
Political lean MEDSL · Sumter
- 2024 margin
- Solid R (+37.6) · D 30.9% · R 68.6%
- 2008→2024 swing
- -10.6pp toward R · 2008: -27.0pp · 2024: -37.6pp
- All cycles
- 2024: R+37.6 2020: R+36.1 2016: R+39.2 2012: R+34.9 2008: R+27.0
Not yet ingested
- Civics
- —
Market trends
- HPI YoY
- ▼ -16.16%
- Current HPI
- 218.1956
- Rent YoY
- ▲ 3.92%
- Metro
- The Villages, FL
- State GDP YoY
- ▲ 3.28%
- F500 in state
- 36
Industry mix (Fortune 500 HQ in FL)
| Industry | F500 HQs | Revenue |
|---|---|---|
| Industrial Technology | 2 | $29B |
|
||
| Insurance | 2 | $17B |
|
||
| Retail | 1 | $60B |
|
||
| Technology Distribution | 1 | $58B |
|
||
| Homebuilding | 1 | $35B |
|
||
| Technology Manufacturing | 1 | $35B |
|
||
Price history
+72.4% since first listed5 events — show timeline
- 2026-04-20 Pending — Stellar MLS as Distributed by MLS Grid
- 2026-03-30 Relisted — Stellar MLS as Distributed by MLS Grid
- 2026-03-28 Pending — Stellar MLS as Distributed by MLS Grid
- 2026-03-26 Listed $374,900 Stellar MLS as Distributed by MLS Grid
- 2011-03-10 Sold (Public Records) $217,500 Public Records
Property tax history
-0.0%/yrLatest (2025): $3,044 · +0.9% YoY. Source: county tax records.
Cash-flow waterfall
monthlySold comps — $/sqft
last 12 mo · ≤1 miLoading sold comps…