 Duplex
120-122 Firglade Ave · Springfield, MA
Flood risk No data
- FEMA flood zone
- —
- Chance of flooding over 30 yrs
- —
- Est. flood insurance / yr
- —
Fire risk No data
- Est. fire insurance / yr
- —
Heat risk No data
- Hot days now (above threshold)
- —
- Hot days in 30 yrs
- —
Wind risk No data
- Chance of severe wind over 30 yrs
- —
Air-quality risk No data
- Unhealthy air days now
- —
- Unhealthy air days in 30 yrs
- —
Risk factors via First Street. Map © Google.
Why this score? — see what drove the C grade
The composite is a weighted blend of 9 inputs, each scored 0–100. Each bar is that input's sub-score; the figure is the points it added to the 100-point composite (weight × sub-score).
- Cash flow +22.1/30.0
- ARV discount +11.1/15.0
- DSCR +7.1/10.0
- 1% rule +5.8/10.0
- Condition / age +3.8/5.0
- Livability +3.7/5.0
- Rent growth +2.5/5.0
- Schools +1.6/10.0
- Appreciation +0.0/10.0
$494,900
🖨 Deal sheet 📄 Offer letter ✓ Due diligence
Multi-family units
County records classify this as Multi-Family (2-4 Unit). Listing-text estimate: 2 units. confirmed
Listing remarks
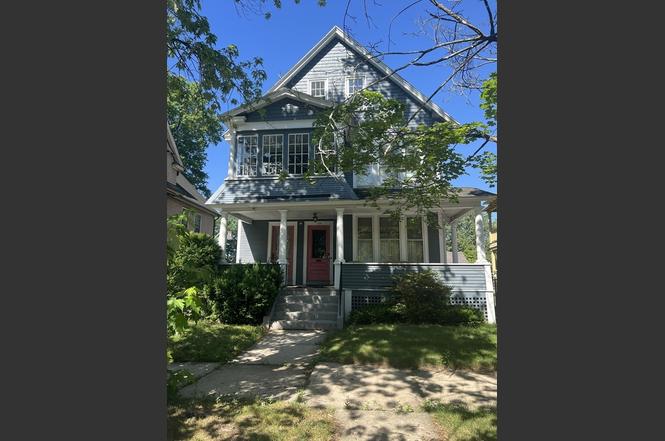
Imagine the possibilities at 120-122 Firglade Ave in Springfield, MA, an owner occupied distinguished Historical multi-family property built in 1908. With a generous 3381 square feet of living space, this residence presents an exceptional opportunity for diversified living and investment. This expansive property offers a remarkable ten bedrooms, providing ample private retreats for multiple households or creative configurations. Complementing these living quarters are two full bathrooms, thoughtfully designed to accommodate the needs of its occupants. Spanning two stories, the architecture provides a sense of grandeur and separation. A single garage space offers convenient parking or additi
Key facts
- 6,251 sq ft lot
- Garage
- Built 1908
Property features AI
Finance
- Other: Building area approximately 3,381 total above-grade square footage; Lot size approximately 0.14 acres
Exterior
- Parking: Garage (1 covered space); 4 open parking spaces; Total 5 parking spaces; Paved driveway, off-street parking
- Security: Security system
- Utilities: Public water; Public sewer; Electric service with circuit breakers; Gas connections suitable for range, oven, and dryer
- Home design: Multifamily property; 3 stories; Blue exterior
- Construction: Frame construction; Brick/mortar foundation; Shingle roof; Built (year per public records)
- Exterior features: Porch; Paved road frontage; Publicly maintained road; Public transportation and sidewalks nearby; Nearby shopping, parks, tennis courts, golf, highway access and houses of worship
Interior
- Kitchen: Range; Dishwasher; Disposal; Refrigerator; Wine refrigerator
- Flooring: Wood; Tile; Carpet; Laminate
- Bathrooms: 2 full bathrooms
- Heating & cooling: Natural gas heating; Central air conditioning
- Interior features: Upgraded cabinets and countertops; Bathroom with tub and shower; Living room; Dining room; Kitchen; Open living/dining room layout; 16 total rooms
- Laundry & utility: Washer; Dryer; Washer hookup; Gas dryer hookup
Neighborhood map
What this means for you Summary
Snapshot
- This is a 2 × 5.0-bed/1.0-bath units multifamily listed at $495k. Condition is rated good.
Deal economics
- At list price, monthly cash flow is $794 ($10k/yr) — positive. Per door: $397/mo.
- The deal already cash-flows at list — no discount required.
- Meets the 1% rule at list price ($5k rent vs $495k).
- Cap rate 8.2% vs local median 5.1% in Springfield — top-decile yield for the area; either an underpriced asset or a hidden risk that comps aren't pricing in. Stress-test before assuming the spread holds.
Location & tenants
- Location reads 73/100 on livability (#97 in MA) — a middle-class / working-renter tenant base. Strengths: commute A+, health & safety A+, amenities A; Watch: schools D, crime F, employment D-.
- Springfield (urban): math 13% / reading 25% proficiency, ranked #296 of 302 in MA (top 98%) — low school quality limits family demand, transient renter base, plan for 1-2y turnover; 81% free/reduced lunch — lower-income household profile, screen leases tightly.
- Market conditions: 43 active listings in the ZIP; 453 units permitted in Hampden County in 2024 (116 in 5+ unit buildings).
- At $5,334/mo this rent would consume 126% of the median local household income ($51k/yr) (locally 2272% of renters already pay >50% of income on rent) — very limited rent-growth headroom before tenants either downsize or default.
Forward outlook
- Local home prices are declining (-3.0%/yr); year-one equity from $3k of loan paydown is wiped out by about $15k of value loss. Plan a longer hold.
- Hampden County population projected at +5% by 2050 — modest demand growth; plan on rents tracking national, not racing it.
Negotiation context
- Only 4 days on market — expect competitive offers; lowballing is unlikely to land.
Risks & watch-outs
- Watch-outs: built in 1908 — expect roof / HVAC / electrical / plumbing capex.
Questions for the listing agent
- Can we see the unit-by-unit rent roll, current vacancy, and any below-market leases? What's the average tenancy length?
- What capital expenditures (roof, boiler, parking lot, exteriors) have been made in the last 5 years, and what's planned in the next 2?
- Built in 1908 — when were the roof, HVAC, electrical panel, plumbing, and water heater last replaced?
- Is there a deadline driving the sale (1031 exchange, divorce, estate, relocation)? That informs how much negotiation room exists.
- Schools are D-rated, which usually means shorter tenancies and higher turnover. Who's the typical renter profile here, and what's been the actual vacancy rate?
- Crime grade is F in this area — have there been break-ins, vandalism, or insurance claims at this property in the last 3 years? What carrier currently insures it and at what premium?
- What's the average days-on-market for RENTAL listings here right now (not sales)? A rising rental-DOM trend means longer vacancies and softer asking-rent achievability than the comps imply.
- What's the recent tenant-quality profile in this submarket — average credit score on applications, eviction rate, late-payment / NSF rate, and stable-employment percentage? A property-management company in the area should have these aggregated.
- How much new apartment / multifamily construction is in the pipeline within 1–3 miles? Heavy new supply (>2% of stock underway) typically softens rents 12–24 months out; light construction supports rent growth.
Investment metrics
- 1% rule
- 1.08% ✓
- Cap rate
- 8.22%
- Cash-on-cash
- 6.87%
- DSCR
- 1.31
- GRM
- 7.7
CMA / ARV
- ARV (on-the-fly)
- $537,579
- Comps found
- 4
Show comp detail 4 sales within ~0.75 mi
| Address | Dist | Beds/Ba | Sqft | Sold | Price | $/sf | Match |
|---|---|---|---|---|---|---|---|
| 89 Firglade Ave | 0.07mi | 9/3.0 (-1) | 3,248 (-4%) | 9mo | $517,500 | $159 | 74 |
| 21-23 Continental St | 0.58mi | 9/2.0 (-1) | 3,096 (-8%) | 1mo | $500,000 | $161 | 53 |
| 58-60 Virginia St | 0.71mi | 9/3.0 (-1) | 3,300 (-2%) | 10mo | $460,000 | $139 | 46 |
| 367-369 E Columbus Ave | 0.65mi | 9/3.0 (-1) | 3,516 (+4%) | 16mo | $410,000 | $117 | 41 |
Match score weights: distance 35% · size 25% · config 20% · recency 20%. Top-matched comps best support the ARV.
Projected returns pro-forma
-3.0% appreciation · 3.0% rent growth · sell at horizon
- IRR
- -5.7%
- Equity multiple
- 0.79×
- Total profit
- $-29,562
- Equity at exit
- $73,791
- IRR
- 3.9%
- Equity multiple
- 1.29×
- Total profit
- $39,679
- Equity at exit
- $42,790
Cash invested: $138,572 (down + closing). Projections, not guarantees.
Landlord ↔ Tenant lean methodology
- Overall (STATE)
- 20 Strongly Tenant-Friendly
- State Massachusetts
- 20 Strongly Tenant-Friendly · D+15
- County
- — inherits STATE
- City
- — inherits STATE
ZIP-level market 01108
- Home prices YoY
- -23.0%
- Active inventory
- 43
- Price-to-rent
- 15.5×
Monthly cashflow live
- Estimated rent
- $5,334 medium interval (Pro) →
- Mortgage (P&I)
- −$2,595
- Tax est. 1.5%
- −$619 /mo · $7,424/yr
- Insurance
- −$206
- HOA
- −$0
- Vacancy / Maint / Mgmt
- −$1,120
- Net cashflow
- $794
Break-even live
2-unit breakdown (identical units grouped — click to expand)
| Units | Beds | Baths | Est. rent |
|---|---|---|---|
| 2× units | 5.0 | 1 | $5,334 |
| #1 | 5.0 | 1 | $2,667 |
| #2 | 5.0 | 1 | $2,667 |
| Total (2 units) | $5,334 | ||
UW: 25.0% down · 7.5% · 30yr · 1.5% tax · 5.0% vac · 8.0% maint · 8.0% mgmt
Financing live
Cash to close
- Down payment
- $123,725
- Closing costs
- $14,847
- Reserves months
- —
- Total cash needed
- —
Loan-product check · same deal, 3 products live
Conventional
25% down · 7.5% · 30yr
- Down + closing
- —
- Monthly P&I
- —
- Monthly cashflow
- —
- DSCR
- —
- Eligible?
- —
Personal DTI + credit; lowest rate.
DSCR
20% down · 8.5% · 30yr
- Down + closing
- —
- Monthly P&I
- —
- Monthly cashflow
- —
- DSCR
- —
- Eligible?
- —
No personal income docs; deal must DSCR.
Hard money
10% down · 12.0% · 12mo
- Down + closing
- —
- Monthly P&I
- —
- Monthly cashflow
- —
- DSCR
- —
- Eligible?
- —
Short-term bridge; refi at stabilization.
Listing history 5 events
-
2026-06-18statusdays on market $494,900 Active 4 DOM
-
2026-06-17days on market $494,900 New 3 DOM
-
2026-06-16days on market $494,900 New 2 DOM
-
2026-06-15remarks 699-char remark
-
2026-06-15$494,900 New 1 DOM
ⓘ Source: listings_history table (triggers on properties + properties_extension) + one-shot
backfill from property_details.listing_events for pre-trigger history.
Nearby sold comps map
Loading sold comps map…
Walkable amenities ~0.75 mi
Loading nearby amenities…
Taxation est. · year 1
- Rental income
- $64,008
- − Mortgage interest
- −$27,722
- − Property taxes
- −$7,424
- − Insurance
- −$2,474
- − Repairs & maintenance
- −$5,121
- − Management
- −$5,121
- − Depreciation
- −$14,397
- Taxable income
- $1,750
- Est. tax owed @ 24.0%
- −$420
- After-tax cash flow
- $9,105/yr
For passive investors: Depreciation is non-cash, so a rental often shows a tax loss while cash-flowing — sheltering income. Rental losses are passive: they offset passive income freely, and up to $25,000/yr can offset ordinary (W-2) income if you actively participate and your MAGI is under $100k (phasing out to $0 by $150k); unused losses carry forward. On sale, claimed depreciation is recaptured at up to 25%, and gains may owe capital-gains tax (a 1031 exchange can defer both). Figures are a year-1 estimate at your 24.0% rate — not tax advice; consult a CPA.
Condition & rehab AI · 12 photos
This multi-family property in Springfield, MA, offers a good condition with potential for cosmetic updates to enhance its resale and rental value.
Value-add opportunities
- Resale paint exterior — enhances curb appeal
- Both update flooring — improves aesthetics and value
- Both update bathrooms — modernizes and increases value
Renovation cost estimate screening
Value-add ROI direction
- Resale paint exterior — enhances curb appeal ↑
- Both update flooring — improves aesthetics and value ↑
- Both update bathrooms — modernizes and increases value ↑
ⓘ Cost ranges are severity-bucket heuristics (US national rule-of-thumb). Get contractor quotes + a written scope before underwriting a rehab budget.
Schools (NCES district)
- District
- Springfield
- NCES district ID
- 2511130
- Math proficiency
- 13% ▼ -12.00%
- Reading proficiency
- 25% ▼ -5.00%
- Median HH income
- $34,938
- Composite
- 15.6/100
- National rank
- #9293
- State rank
- #296 of 302 in MA
Livability — Springfield
- Score
- 73/100
- State rank
- #97
- US rank
- #5195
Category grades
Schools grade is shown separately in the Schools card above.
Census & demographics
- Census place
- Springfield, MA
- County
- Hampden County · 230,965 people
- City population
- 61,006
- Metro
- Springfield, MA
- Population (ZIP)
- 27,405
- Household income
- $50,661
- Rent vs Own
- Severe rent burden
- 2272.0
Population outlook (Hampden County) Hauer SSP2
- Today (2025)
- 485,646 people
- By 2030
- 491,517 · +1.2%
- By 2040
- 500,539 · +3.1%
- By 2050
- 508,827 · +4.8%
- By 2075
- 539,167 · +11.0%
- By 2100
- 545,698 · +12.4%
Race, ethnicity, and origin ACS 2023
- Neighborhood character
- Diverse neighborhood (Simpson 0.69)
- Race & ethnicity
- Hispanic / Latino 41% White 31% Two or more races 20% Black 19% Asian 7%
- Hispanic origin (detail)
- Puerto Rican 30% Dominican 7%
- Common ancestry
- Lithuanian 3% Romanian 1% Hispanic 1%
- Foreign-born
- 16% · Canada, Vietnam, India
- Languages at home
- 60% English-only · Spanish 26% Vietnamese 4% Other Indo-European 4%
Political lean MEDSL · Hampden
- 2024 margin
- Lean D (+8.9) · D 53.4% · R 44.5% · Other 2.1%
- 2008→2024 swing
- -16.4pp toward R · 2008: 25.3pp · 2024: 8.9pp
- All cycles
- 2024: D+8.9 2020: D+17.7 2016: D+16.0 2012: D+25.4 2008: D+25.3
Not yet ingested
- Civics
- —
Market trends
- HPI YoY
- ▼ -96.40%
- Current HPI
- 322.6677
- Rent YoY
- —
- Metro
- Springfield, MA
- State GDP YoY
- ▲ 2.28%
- F500 in state
- 38
Industry mix (Fortune 500 HQ in MA)
| Industry | F500 HQs | Revenue |
|---|---|---|
| Technology | 3 | $17B |
|
||
| Insurance | 2 | $84B |
|
||
| Retail | 2 | $76B |
|
||
| Life Sciences | 1 | $43B |
|
||
| Energy Technology | 1 | $31B |
|
||
| Aerospace / Defense | 1 | $18B |
|
||
Price history
1 event — show timeline
- 2026-06-14 Listed $494,900 MLS PIN
Cash-flow waterfall
monthlySold comps — $/sqft
last 12 mo · ≤1 miLoading sold comps…