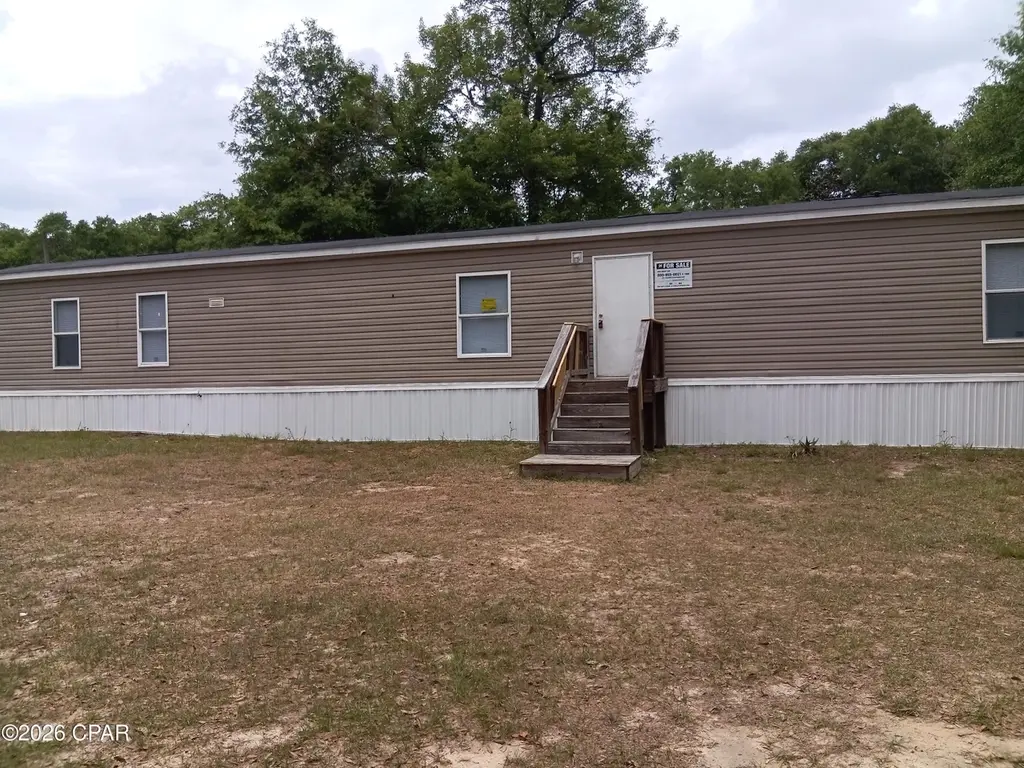
380 Charlie Harris Loop · Quincy, FL
Flood risk 1/10 · Minimal
- FEMA flood zone
- X (unshaded)
- Chance of flooding over 30 yrs
- 0.0%
- Est. flood insurance / yr
- $507 – $1,088
Fire risk 5/10 · Moderate
- Est. fire insurance / yr
- $947 – $1,759
Heat risk 8/10 · Major
- Hot days now (above 107°F)
- 7 days/yr
- Hot days in 30 yrs
- 19 days/yr
Wind risk 9/10 · Severe
- Chance of severe wind over 30 yrs
- 99.0%
Air-quality risk 4/10 · Minor
- Unhealthy air days now
- 6 days/yr
- Unhealthy air days in 30 yrs
- 6 days/yr
Risk factors via First Street. Map © Google.
Why this score? — see what drove the C+ grade
The composite is a weighted blend of 9 inputs, each scored 0–100. Each bar is that input's sub-score; the figure is the points it added to the 100-point composite (weight × sub-score).
- Cash flow +20.5/30.0
- ARV discount +15.0/15.0
- DSCR +6.5/10.0
- Appreciation +5.3/10.0
- 1% rule +4.9/10.0
- Livability +3.3/5.0
- Schools +2.6/10.0
- Rent growth +2.5/5.0
- Condition / age +2.5/5.0
$114,900
🖨 Deal sheet 📄 Offer letter ✓ Due diligence
Listing remarks
Updated, 3 Bedroom 2 Bath Home in Quincy! This home sits on just under an acre, on a gorgeous lot! This split floorplan singlewide has just recently has new carpet, cabinets, and appliances installed, and is move in ready! This one is priced to sell, so schedule your showing on this little gem before it is too late!
Key facts
- New carpet
- Gorgeous lot
- New cabinets
Tags
Property features AI
Finance
- Other: Zoned for county, mobile home, and single-family residential use; Lot dimensions approximately 270 x 145 feet (0.9 acre)
Exterior
- Utilities: Electricity available
- Home design: Single-wide mobile home
- Construction: Vinyl siding; Pillar/post/pier foundation
- Exterior features: Paved lot
Interior
- Kitchen: Electric range
- Bedrooms: Multiple bedrooms on the first level (including a primary bedroom)
- Bathrooms: 2 full bathrooms
- Heating & cooling: Central heating (electric); Central air conditioning; Ceiling fans
- Interior features: Total of 8 rooms; Laundry on the first level
- Laundry & utility: Electric water heater; First-level laundry room
Neighborhood map
What this means for you Summary
Snapshot
- This is a 3-bed/2.0-bath manufactured listed at $115k.
Deal economics
- At list price, monthly cash flow is $152 ($2k/yr) — positive.
- The deal already cash-flows at list — no discount required.
- To meet the 1% rule (rent ≥ 1% of price), the offer needs to be $114k (1.2% below list).
- Recommended offer: $111k (3.0% below list) — sets the bar for market timing.
- Cap rate 7.9% vs local median 3.9% in Quincy — top-decile yield for the area; either an underpriced asset or a hidden risk that comps aren't pricing in. Stress-test before assuming the spread holds.
Location & tenants
- Location reads 66/100 on livability (#588 in FL) — a middle-class / working-renter tenant base. Strengths: cost of living A+, health & safety B+; Watch: amenities F, commute F, employment F.
- Gadsden (rural): math 31% / reading 31% proficiency, ranked #70 of 73 in FL (top 96%) — families likely to look elsewhere, expect single-tenant / working-renter base with shorter leases; 83% free/reduced lunch — lower-income household profile, screen leases tightly.
- Market conditions: 22 active listings in the ZIP; 107 units permitted in Gadsden County in 2024 (36 in 5+ unit buildings).
Forward outlook
- In year one you build about $2k of equity ($794 loan paydown + $799 appreciation (0.7% local appreciation)).
- Gadsden County population projected at -27% by 2050 — secular population decline; favor cash flow + early exit over multi-decade hold.
- At projected returns (0.7% appreciation + 3.0% rent growth), your $32k cash investment doubles in ~8 years — after that, you're playing with house money.
Negotiation context
- It's been on market 48 days — a 3% lower offer ($111k) is reasonable based on typical stale-listing flexibility.
- 2 sale attempts since 2y ago with the ask held roughly flat each time — persistent listings suggest the price (not the market) is what's stuck; bring a comps-based counter.
Risks & watch-outs
- Climate carrying-cost: severe wind risk, 99% chance of damaging wind over 30y; moderate wildfire risk; extreme-heat days projected 7→19/yr by 2055 (HVAC capex compounding) — expect insurance premiums to compound above CPI over the hold.
Questions for the listing agent
- It's been on market 48 days. Have you received any prior offers? Is the seller open to a 3% concession, seller financing, or rate buy-down credit?
- Is there a deadline driving the sale (1031 exchange, divorce, estate, relocation)? That informs how much negotiation room exists.
- What's the average days-on-market for RENTAL listings here right now (not sales)? A rising rental-DOM trend means longer vacancies and softer asking-rent achievability than the comps imply.
- What's the recent tenant-quality profile in this submarket — average credit score on applications, eviction rate, late-payment / NSF rate, and stable-employment percentage? A property-management company in the area should have these aggregated.
- How much new for-sale + rental construction is in the pipeline within 1–3 miles? Heavy new supply typically softens prices + rents 12–24 months out; constrained supply supports both.
Investment metrics
- 1% rule
- 0.99% ✗
- Cap rate
- 7.88%
- Cash-on-cash
- 5.66%
- DSCR
- 1.25
- GRM
- 8.4
CMA / ARV
- ARV (median comp)
- $201,533
- List price
- $114,900
- Delta
- -42.99%
- Verdict
- UNDERPRICED
- Comps
- 1 within 2.0 mi
Show comp detail 1 sale within ~0.75 mi
| Address | Dist | Beds/Ba | Sqft | Sold | Price | $/sf | Match |
|---|---|---|---|---|---|---|---|
| 4037 Attapulgus Hwy | 0.72mi | 3/2.0 | 1,152 (-2%) | 20mo | $141,450 | $123 | 47 |
Match score weights: distance 35% · size 25% · config 20% · recency 20%. Top-matched comps best support the ARV.
Projected returns pro-forma
0.7% appreciation · 3.0% rent growth · sell at horizon
- IRR
- 6.3%
- Equity multiple
- 1.31×
- Total profit
- $10,098
- Equity at exit
- $37,416
- IRR
- 10.8%
- Equity multiple
- 2.26×
- Total profit
- $40,692
- Equity at exit
- $48,352
Cash invested: $32,172 (down + closing). Projections, not guarantees.
Landlord ↔ Tenant lean methodology
- Overall (STATE)
- 87 Strongly Landlord-Friendly
- State Florida
- 87 Strongly Landlord-Friendly · R+3
- County
- — inherits STATE
- City
- — inherits STATE
ZIP-level market 32352
- Home prices YoY
- 0.5%
- Active inventory
- 22
- Price-to-rent
- 8.4×
Monthly cashflow live
- Estimated rent
- $1,135 medium interval (Pro) →
- Mortgage (P&I)
- −$603
- Tax from tax record
- −$95 /mo · $1,136/yr
- Insurance
- −$48
- HOA
- −$0
- Vacancy / Maint / Mgmt
- −$238
- Net cashflow
- $152
Break-even live
UW: 25.0% down · 7.5% · 30yr · 1.5% tax · 5.0% vac · 8.0% maint · 8.0% mgmt
Financing live
Cash to close
- Down payment
- $28,725
- Closing costs
- $3,447
- Reserves months
- —
- Total cash needed
- —
Loan-product check · same deal, 3 products live
Conventional
25% down · 7.5% · 30yr
- Down + closing
- —
- Monthly P&I
- —
- Monthly cashflow
- —
- DSCR
- —
- Eligible?
- —
Personal DTI + credit; lowest rate.
DSCR
20% down · 8.5% · 30yr
- Down + closing
- —
- Monthly P&I
- —
- Monthly cashflow
- —
- DSCR
- —
- Eligible?
- —
No personal income docs; deal must DSCR.
Hard money
10% down · 12.0% · 12mo
- Down + closing
- —
- Monthly P&I
- —
- Monthly cashflow
- —
- DSCR
- —
- Eligible?
- —
Short-term bridge; refi at stabilization.
Listing history 21 events
-
2026-06-18days on market $114,900 Active 48 DOM
-
2026-06-17days on market $114,900 Active 47 DOM
-
2026-06-16days on market $114,900 Active 46 DOM
-
2026-06-15days on market $114,900 Active 45 DOM
-
2026-06-14days on market $114,900 Active 43 DOM
-
2026-06-13days on market $114,900 Active 42 DOM
-
2026-06-10days on market $114,900 Active 40 DOM
-
2026-06-09days on market $114,900 Active 39 DOM
-
2026-06-08days on market $114,900 Active 38 DOM
-
2026-06-07days on market $114,900 Active 37 DOM
-
2026-06-05days on market $114,900 Active 34 DOM
-
2026-06-03days on market $114,900 Active 33 DOM
-
2026-06-02days on market $114,900 Active 32 DOM
-
2026-06-01days on market $114,900 Active 31 DOM
-
2026-05-31days on market $114,900 Active 30 DOM
-
2026-05-30days on market $114,900 Active 29 DOM
-
2026-05-01$114,900 Active 321-char remark
-
2024-06-06historical
-
2024-04-07price $126,000
-
2024-03-21price $132,000
-
2024-02-10$140,000 Active
ⓘ Source: listings_history table (triggers on properties + properties_extension) + one-shot
backfill from property_details.listing_events for pre-trigger history.
Tax reassessment forecast FL · Resets to sale price
- Current annual tax
- $1,136 · $95/mo
- Projected year-2 tax
- $1,136 · $95/mo
- Expected delta
- $0/yr ($0/mo · 0.0%)
ⓘ Screening estimate from a state-policy table — verify with the county assessor before closing.
Climate risk First Street
- Flood 1/10 Low FEMA zone X (unshaded) · 0% chance over 30 yrs
- Wildfire 5/10 Major
- Heat 8/10 Severe 7 d/yr ≥107°F today · 19 d/yr by 30 yrs out
- Wind 9/10 Extreme 99% chance of damaging wind over 30 yrs
- Air quality 4/10 Moderate 6 unhealthy d/yr today · 6 by 30 yrs out
Nearby sold comps map
Loading sold comps map…
Walkable amenities ~0.75 mi
Loading nearby amenities…
Taxation est. · year 1
- Rental income
- $13,623
- − Mortgage interest
- −$6,436
- − Property taxes
- −$1,136
- − Insurance
- −$574
- − Repairs & maintenance
- −$1,090
- − Management
- −$1,090
- − Depreciation
- −$3,343
- Taxable loss
- −$46
- Est. tax savings @ 24.0%
- +$11
- After-tax cash flow
- $1,832/yr
For passive investors: Depreciation is non-cash, so a rental often shows a tax loss while cash-flowing — sheltering income. Rental losses are passive: they offset passive income freely, and up to $25,000/yr can offset ordinary (W-2) income if you actively participate and your MAGI is under $100k (phasing out to $0 by $150k); unused losses carry forward. On sale, claimed depreciation is recaptured at up to 25%, and gains may owe capital-gains tax (a 1031 exchange can defer both). Figures are a year-1 estimate at your 24.0% rate — not tax advice; consult a CPA.
Schools (NCES district)
- District
- Gadsden
- NCES district ID
- 1200600
- Math proficiency
- 31% ▼ -16.00%
- Reading proficiency
- 31% ▼ -7.00%
- Median HH income
- $36,470
- Composite
- 25.75/100
- National rank
- #7373
- State rank
- #70 of 73 in FL
Livability — Quincy
- Score
- 66/100
- State rank
- #588
- US rank
- #11260
Category grades
Schools grade is shown separately in the Schools card above.
Census & demographics
- Population (ZIP)
- 5,234
Population outlook (Gadsden County) Hauer SSP2
- Today (2025)
- 42,956 people
- By 2030
- 40,878 · -4.8%
- By 2040
- 36,218 · -15.7%
- By 2050
- 31,502 · -26.7%
- By 2075
- 21,828 · -49.2%
- By 2100
- 14,480 · -66.3%
Race, ethnicity, and origin ACS 2023
- Neighborhood character
- Predominantly Black (74%)
- Race & ethnicity
- Black 74% White 22% Hispanic / Latino 4% Two or more races 2%
- Common ancestry
- Lithuanian 3% Slovak 1%
- Foreign-born
- 1% · Canada
- Languages at home
- 96% English-only · Spanish 4%
Political lean MEDSL · Gadsden
- 2024 margin
- Solid D (+30.7) · D 65.0% · R 34.3%
- 2008→2024 swing
- -8.3pp toward R · 2008: 39.0pp · 2024: 30.7pp
- All cycles
- 2024: D+30.7 2020: D+36.6 2016: D+37.5 2012: D+40.6 2008: D+39.0
Not yet ingested
- Civics
- —
Market trends
- HPI YoY
- ▲ 0.70%
- Current HPI
- 149.1101
- Rent YoY
- —
- Metro
- —
- State GDP YoY
- ▲ 3.28%
- F500 in state
- 36
Industry mix (Fortune 500 HQ in FL)
| Industry | F500 HQs | Revenue |
|---|---|---|
| Industrial Technology | 2 | $29B |
|
||
| Insurance | 2 | $17B |
|
||
| Retail | 1 | $60B |
|
||
| Technology Distribution | 1 | $58B |
|
||
| Homebuilding | 1 | $35B |
|
||
| Technology Manufacturing | 1 | $35B |
|
||
Price history
-17.9% since first listed5 events — show timeline
- 2026-05-01 Listed $114,900 CPARMLS
- 2024-06-06 Listing Removed — CATRS
- 2024-04-07 Price Changed $126,000 CATRS
- 2024-03-21 Price Changed $132,000 CATRS
- 2024-02-10 Listed $140,000 CATRS
Property tax history
+27.3%/yrLatest (2025): $1,136 · +7.9% YoY. Source: county tax records.
Cash-flow waterfall
monthlySold comps — $/sqft
last 12 mo · ≤1 miLoading sold comps…