1 Rock Springs Dr · Mexico, MO
Flood risk 1/10 · Minimal
- FEMA flood zone
- X (unshaded)
- Chance of flooding over 30 yrs
- 0.0%
- Est. flood insurance / yr
- $507 – $1,088
Fire risk 1/10 · Minimal
- Est. fire insurance / yr
- $1,054 – $1,958
Heat risk 4/10 · Minor
- Hot days now (above 106°F)
- 7 days/yr
- Hot days in 30 yrs
- 18 days/yr
Wind risk 2/10 · Minimal
- Chance of severe wind over 30 yrs
- 0.0%
Air-quality risk 1/10 · Minimal
- Unhealthy air days now
- 0 days/yr
- Unhealthy air days in 30 yrs
- 0 days/yr
Risk factors via First Street. Map © Google.
Why this score? — see what drove the B- grade
The composite is a weighted blend of 9 inputs, each scored 0–100. Each bar is that input's sub-score; the figure is the points it added to the 100-point composite (weight × sub-score).
- Cash flow +30.0/30.0
- DSCR +10.0/10.0
- 1% rule +9.3/10.0
- ARV discount +7.5/15.0
- Livability +3.2/5.0
- Schools +2.9/10.0
- Rent growth +2.5/5.0
- Condition / age +2.5/5.0
- Appreciation +0.0/10.0
$75,000
🖨 Deal sheet (PDF) 📄 Offer letter ✓ Due diligence
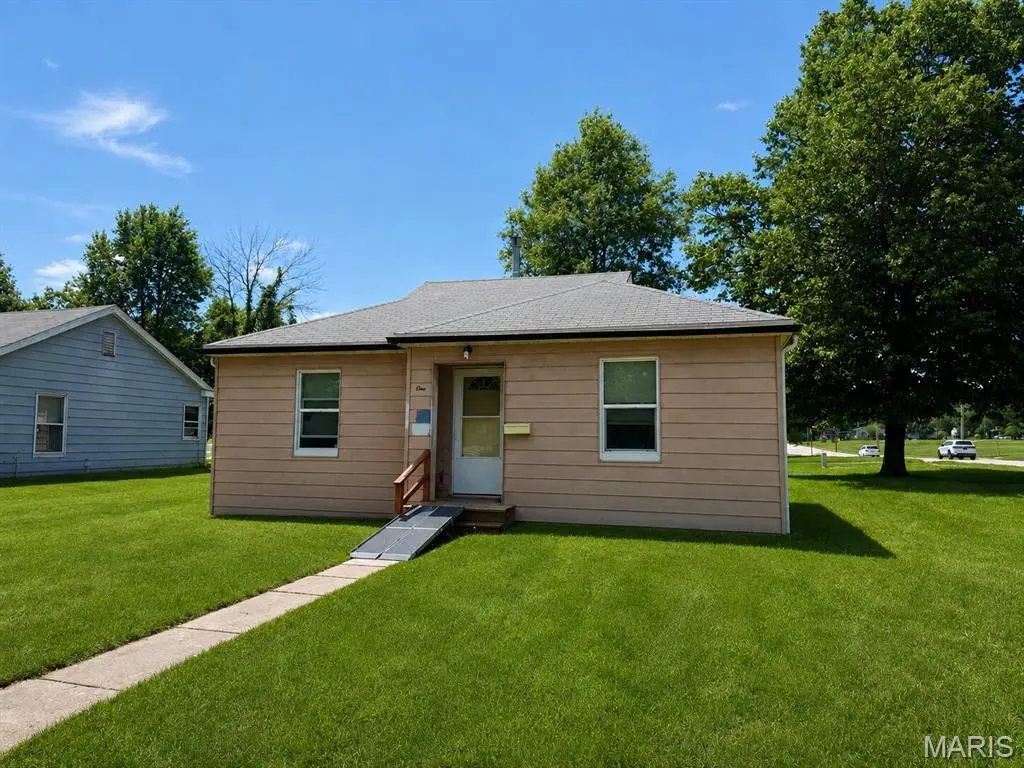
Listing remarks
Charming 2-bedroom, 1-bath home situated on a spacious corner lot with plenty of potential! This single-story home offers a functional layout with a bright living area, eat-in kitchen, and abundant natural light throughout. Whether you’re a first-time buyer looking to build equity, an investor searching for your next project, or someone ready to add your own personal touches, this property presents a great opportunity. Additional features include off-street driveway parking and a level yard with space for outdoor entertaining or gardening. Located in the Mexico School District and just minutes from local parks, shopping, dining, and everyday amenities, this home offers small-town char
Key facts
- 7,270 sq ft lot
- Built 1948
- Listed 10 days
Property features AI
Exterior
- Parking: Off-street parking
- Utilities: Public water; Ameren electric service; Public sewer
- Home design: Single-family residence; One level
- Construction: Frame construction; Vinyl siding
- Exterior features: Corner lot; Level lot
Interior
- Kitchen: Kitchen on the main level
- Bedrooms: Two bedrooms on the main level
- Bathrooms: One full bathroom on the main level
- Heating & cooling: Forced air heating; Central air conditioning
- Interior features: Living room on main level; Main-level layout with all rooms on one floor; 6 total rooms
- Laundry & utility: Main-level laundry room
Neighborhood map
What this means for you Summary
Snapshot
- This is a 2-bed/1.0-bath other listed at $75k.
Deal economics
- At list price, monthly cash flow is $394 ($5k/yr) — positive.
- The deal already cash-flows at list — no discount required.
- Meets the 1% rule at list price ($1k rent vs $75k).
- Cap rate 12.6% vs local median 4.5% in Mexico — top-decile yield for the area; either an underpriced asset or a hidden risk that comps aren't pricing in. Stress-test before assuming the spread holds.
Location & tenants
- Location reads 65/100 on livability (#256 in MO) — a middle-class / working-renter tenant base. Strengths: cost of living A+, housing A, health & safety A-; Watch: crime F, amenities F, commute F.
- Mexico 59 (town): math 31% / reading 38% proficiency, ranked #229 of 324 in MO (top 71%) — families likely to look elsewhere, expect single-tenant / working-renter base with shorter leases.
- Zoned schools: Eugene Field Elem. (math 31% / reading 41%, grade F, #662 of 1,115 statewide, top 60%, 424 students, 100% FRL); Mexico Middle (math 33% / reading 34%, grade F, #260 of 391 statewide, top 67%, 503 students, 100% FRL); Mexico High (math 22% / reading 47%, grade F, #321 of 521 statewide, top 67%, 746 students, 53% FRL) — zoned schools average 84% FRL vs 52% district-wide (32 pts higher); higher-poverty schools than district average — tighter screening recommended.
- Market conditions: 136 active listings in the ZIP; 27 units permitted in Audrain County in 2024 (0 in 5+ unit buildings).
Forward outlook
- Local home prices are declining (-3.0%/yr); year-one equity from $519 of loan paydown is wiped out by about $2k of value loss. Plan a longer hold.
- Audrain County population projected at +16% by 2050 — long-run rental-demand tailwind backs the buy-and-hold thesis.
- At projected returns (-3.0% appreciation + 3.0% rent growth), your $21k cash investment doubles in ~6 years — after that, you're playing with house money.
Negotiation context
- Only 11 days on market — expect competitive offers; lowballing is unlikely to land.
- 5 sale attempts since 5y ago; this cycle's ask has dropped $5k (6%) from the opening price — seller is motivated, your offer sets the floor, not the list.
- Current owner paid $45k; list at $75k implies a 67% gain — meaningful room to come down on a strong offer.
Risks & watch-outs
- Watch-outs: built in 1948 — expect roof / HVAC / electrical / plumbing capex.
Questions for the listing agent
- Built in 1948 — when were the roof, HVAC, electrical panel, plumbing, and water heater last replaced?
- Is there a deadline driving the sale (1031 exchange, divorce, estate, relocation)? That informs how much negotiation room exists.
- Schools are D-rated, which usually means shorter tenancies and higher turnover. Who's the typical renter profile here, and what's been the actual vacancy rate?
- Crime grade is F in this area — have there been break-ins, vandalism, or insurance claims at this property in the last 3 years? What carrier currently insures it and at what premium?
- What's the average days-on-market for RENTAL listings here right now (not sales)? A rising rental-DOM trend means longer vacancies and softer asking-rent achievability than the comps imply.
- What's the recent tenant-quality profile in this submarket — average credit score on applications, eviction rate, late-payment / NSF rate, and stable-employment percentage? A property-management company in the area should have these aggregated.
- How much new for-sale + rental construction is in the pipeline within 1–3 miles? Heavy new supply typically softens prices + rents 12–24 months out; constrained supply supports both.
Investment metrics
- 1% rule
- 1.43% ✓
- Cap rate
- 12.60%
- Cash-on-cash
- 22.53%
- DSCR
- 2.00
- GRM
- 5.8
CMA / ARV
No comps found within radius.
Projected returns pro-forma
-3.0% appreciation · 3.0% rent growth · sell at horizon
- IRR
- 15.4%
- Equity multiple
- 1.62×
- Total profit
- $12,939
- Equity at exit
- $11,183
- IRR
- 24.0%
- Equity multiple
- 3.07×
- Total profit
- $43,511
- Equity at exit
- $6,485
Cash invested: $21,000 (down + closing). Projections, not guarantees.
Landlord ↔ Tenant lean methodology
- Overall (STATE)
- 81 Strongly Landlord-Friendly
- State Missouri
- 81 Strongly Landlord-Friendly · R+10
- County
- — inherits STATE
- City
- — inherits STATE
ZIP-level market 65265
- Home prices YoY
- -30.2%
- Active inventory
- 136
- Price-to-rent
- 5.8×
Monthly cashflow live
- Estimated rent
- $1,072 medium interval (Pro) →
- Mortgage (P&I)
- −$393
- Tax from tax record
- −$28 /mo · $335/yr
- Insurance
- −$31
- HOA
- −$0
- Vacancy / Maint / Mgmt
- −$225
- Net cashflow
- $394
Break-even live
Sensitivity live
| Price | -10% $437 | -5% $416 | +0% $394 | +5% $373 | +10% $352 |
|---|---|---|---|---|---|
| Rent | -10% $310 | -5% $352 | +0% $394 | +5% $437 | +10% $479 |
| Rate | -1.0pp $432 | -0.5pp $413 | base $394 | +0.5pp $375 | +1.0pp $355 |
UW: 25.0% down · 7.5% · 30yr · 1.5% tax · 5.0% vac · 8.0% maint · 8.0% mgmt
Financing live
Cash to close
- Down payment
- $18,750
- Closing costs
- $2,250
- Reserves months
- —
- Total cash needed
- —
Loan-product check · same deal, 3 products live
Conventional
25% down · 7.5% · 30yr
- Down + closing
- —
- Monthly P&I
- —
- Monthly cashflow
- —
- DSCR
- —
- Eligible?
- —
Personal DTI + credit; lowest rate.
DSCR
20% down · 8.5% · 30yr
- Down + closing
- —
- Monthly P&I
- —
- Monthly cashflow
- —
- DSCR
- —
- Eligible?
- —
No personal income docs; deal must DSCR.
Hard money
10% down · 12.0% · 12mo
- Down + closing
- —
- Monthly P&I
- —
- Monthly cashflow
- —
- DSCR
- —
- Eligible?
- —
Short-term bridge; refi at stabilization.
Listing history 34 events
-
2026-06-21days on market $75,000 Active 11 DOM
-
2026-06-21days on market $75,000 Active 10 DOM
-
2026-06-18days on market $75,000 Active 8 DOM
-
2026-06-17days on market $75,000 Active 7 DOM
-
2026-06-16days on market $75,000 Active 6 DOM
-
2026-06-15days on market $75,000 Active 5 DOM
-
2026-06-13days on market $75,000 Active 3 DOM
-
2026-06-12statusdays on market $75,000 Active 2 DOM
-
2026-06-09days on market $75,000 Coming Soon 14 DOM
-
2026-06-08days on market $75,000 Coming Soon 13 DOM
-
2026-06-07days on market $75,000 Coming Soon 12 DOM
-
2026-06-07days on market $75,000 Coming Soon 11 DOM
-
2026-06-04days on market $75,000 Coming Soon 8 DOM
-
2026-06-02days on market $75,000 Coming Soon 7 DOM
-
2026-06-01days on market $75,000 Coming Soon 6 DOM
-
2026-05-31days on market $75,000 Coming Soon 5 DOM
-
2026-05-26historical $75,000
-
2025-09-12price $71,900
-
2025-09-12price $71,900
-
2025-08-20status Active
-
2025-08-20status Active
-
2025-07-16historical
-
2025-07-16historical
-
2025-06-28price $74,500
-
2025-06-28price $74,500
-
2025-06-16$79,900 Active
-
2025-06-16$79,900 Active
-
2022-08-18soldstatus
-
2022-04-25soldstatus
-
2021-10-11$52,000
-
2021-02-18soldstatus $45,000
-
2017-10-04soldstatus
-
2015-11-17soldstatus
-
2014-11-05soldstatus
ⓘ Source: listings_history table (triggers on properties + properties_extension) + one-shot
backfill from property_details.listing_events for pre-trigger history.
Tax reassessment forecast MO · Resets to sale price
- Current annual tax
- $335 · $28/mo
- Projected year-2 tax
- $728 · $61/mo
- Expected delta
- +$392/yr (+$33/mo · 117.0%)
ⓘ Screening estimate from a state-policy table — verify with the county assessor before closing.
Climate risk First Street
- Flood 1/10 Low FEMA zone X (unshaded) · 0% chance over 30 yrs
- Wildfire 1/10 Low
- Heat 4/10 Moderate 7 d/yr ≥106°F today · 18 d/yr by 30 yrs out
- Wind 2/10 Low 0% chance of damaging wind over 30 yrs
- Air quality 1/10 Low 0 unhealthy d/yr today · 0 by 30 yrs out
Nearby sold comps map
Loading sold comps map…
Walkable amenities ~0.75 mi
Loading nearby amenities…
Taxation est. · year 1
- Rental income
- $12,864
- − Mortgage interest
- −$4,201
- − Property taxes
- −$335
- − Insurance
- −$375
- − Repairs & maintenance
- −$1,029
- − Management
- −$1,029
- − Depreciation
- −$2,182
- Taxable income
- $3,712
- Est. tax owed @ 24.0%
- −$891
- After-tax cash flow
- $3,841/yr
For passive investors: Depreciation is non-cash, so a rental often shows a tax loss while cash-flowing — sheltering income. Rental losses are passive: they offset passive income freely, and up to $25,000/yr can offset ordinary (W-2) income if you actively participate and your MAGI is under $100k (phasing out to $0 by $150k); unused losses carry forward. On sale, claimed depreciation is recaptured at up to 25%, and gains may owe capital-gains tax (a 1031 exchange can defer both). Figures are a year-1 estimate at your 24.0% rate — not tax advice; consult a CPA.
Schools (NCES district)
- District
- Mexico 59
- NCES district ID
- 2920810
- Math proficiency
- 31% ▼ -3.00%
- Reading proficiency
- 38% ▼ -4.00%
- Median HH income
- $41,152
- Composite
- 29.07/100
- National rank
- #6601
- State rank
- #229 of 324 in MO
Livability — Mexico
- Score
- 65/100
- State rank
- #256
- US rank
- #12405
Category grades
Schools grade is shown separately in the Schools card above.
Census & demographics
- Census place
- Mexico, MO
- Population (ZIP)
- 15,131
Population outlook (Audrain County) Hauer SSP2
- Today (2025)
- 27,791 people
- By 2030
- 28,684 · +3.2%
- By 2040
- 30,598 · +10.1%
- By 2050
- 32,319 · +16.3%
- By 2075
- 36,395 · +31.0%
- By 2100
- 37,277 · +34.1%
Race, ethnicity, and origin ACS 2023
- Neighborhood character
- Predominantly White (84%)
- Race & ethnicity
- White 84% Two or more races 6% Black 5% Hispanic / Latino 4%
- Common ancestry
- Italian 2% Lithuanian 2% Slovak 1%
- Foreign-born
- 2% · Canada
- Languages at home
- 96% English-only · Spanish 3% Chinese 1%
Political lean MEDSL · Audrain
- 2024 margin
- Solid R (+47.6) · D 25.6% · R 73.2% · Other 1.2%
- 2008→2024 swing
- -31.6pp toward R · 2008: -16.1pp · 2024: -47.6pp
- All cycles
- 2024: R+47.6 2020: R+47.2 2016: R+44.0 2012: R+26.6 2008: R+16.1
Not yet ingested
- Civics
- —
Market trends
- HPI YoY
- ▼ -92.24%
- Current HPI
- 213.6163
- Rent YoY
- —
- Metro
- —
- State GDP YoY
- ▲ 1.84%
- F500 in state
- 20
Industry mix (Fortune 500 HQ in MO)
| Industry | F500 HQs | Revenue |
|---|---|---|
| Healthcare | 1 | $163B |
|
||
| Insurance | 1 | $21B |
|
||
| Industrial Technology | 1 | $17B |
|
||
| Retail | 1 | $16B |
|
||
| Industrial Distribution | 1 | $10B |
|
||
| Utilities | 1 | $9B |
|
||
Price history
+66.7% since first listed18 events — show timeline
- 2026-05-26 Coming Soon $75,000 MARIS as Distributed by MLS Grid
- 2025-09-12 Price Changed $71,900 HMMLS
- 2025-09-12 Price Changed $71,900 CBORMLS
- 2025-08-20 Relisted — CBORMLS
- 2025-08-20 Relisted — HMMLS
- 2025-07-16 Delisted — HMMLS
- 2025-07-16 Delisted — CBORMLS
- 2025-06-28 Price Changed $74,500 CBORMLS
- 2025-06-28 Price Changed $74,500 HMMLS
- 2025-06-16 Listed $79,900 HMMLS
- 2025-06-16 Listed $79,900 CBORMLS
- 2022-08-18 Sold (MLS) — HMMLS
- 2022-04-25 Sold (Public Records) — Public Records
- 2021-10-11 Listed $52,000 HMMLS
- 2021-02-18 Sold (Public Records) $45,000 Public Records
- 2017-10-04 Sold (Public Records) — Public Records
- 2015-11-17 Sold (Public Records) — Public Records
- 2014-11-05 Sold (Public Records) — Public Records
Property tax history
+0.7%/yrLatest (2025): $335 · +0.4% YoY. Source: county tax records.
Cash-flow waterfall
monthlySold comps — $/sqft
last 12 mo · ≤1 miLoading sold comps…