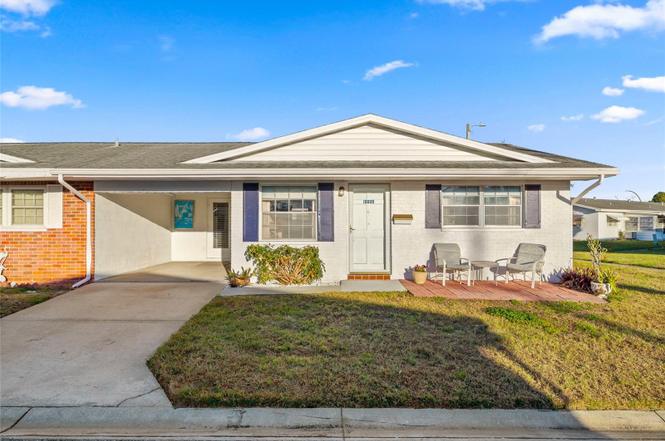
10009 Tulip St N · Pinellas Park, FL
Flood risk 5/10 · Moderate
- FEMA flood zone
- X (shaded)
- Chance of flooding over 30 yrs
- 0.23%
- Est. flood insurance / yr
- $507 – $1,088
Fire risk 1/10 · Minimal
- Est. fire insurance / yr
- $947 – $1,759
Heat risk 10/10 · Severe
- Hot days now (above 107°F)
- 7 days/yr
- Hot days in 30 yrs
- 27 days/yr
Wind risk 10/10 · Severe
- Chance of severe wind over 30 yrs
- 99.0%
Air-quality risk 3/10 · Minor
- Unhealthy air days now
- 3 days/yr
- Unhealthy air days in 30 yrs
- 3 days/yr
Risk factors via First Street. Map © Google.
Why this score? — see what drove the D grade
The composite is a weighted blend of 9 inputs, each scored 0–100. Each bar is that input's sub-score; the figure is the points it added to the 100-point composite (weight × sub-score).
- Cash flow +11.2/30.0
- 1% rule +8.8/10.0
- ARV discount +7.5/15.0
- Schools +4.3/10.0
- Livability +3.9/5.0
- DSCR +3.3/10.0
- Condition / age +2.5/5.0
- Rent growth +1.2/5.0
- Appreciation +0.0/10.0
$130,000
🖨 Deal sheet (PDF) 📄 Offer letter ✓ Due diligence
Listing remarks
Under contract-accepting backup offers. ONLY ONE OF FOUR IN THE COMMUNITY WITH A LARGE SCREENED PORCH AS WELL AS A FLORIDA ROOM!!! Enjoy effortless Florida living in this charming two bedroom, two bath villa located in the highly desirable 55+ Springwood Villas community, where comfort, convenience and a relaxed lifestyle come together. The spacious eat-in kitchen offers plenty of room for everyday meals and casual gatherings, while the thoughtfully designed split bedroom floor plan provides privacy for both residents and guests. A bright and airy living and dining room combination is filled with natural light, creating a welcoming space for entertaining or simply enjoying the Florida sunsh
Key facts
- Community amenities
- Great location
- One car carport
Tags
Property features AI
Finance
- Other: Unit is furnished; Third-party listing; Directions: 102nd Avenue N to south on Tulip Street
- Financial info: Total annual fees: $6,420; Lease restrictions apply
- HOA & community: Has HOA (B&C Community Management); Monthly condo/HOA fee: $535; Association approval required; Association fees include: cable TV, escrow reserves, gas, insurance, internet, grounds maintenance, pool, sewer, trash, water; Community features: deed restrictions, pool; Senior community; No pets allowed
Exterior
- Parking: Driveway; Carport (1 space)
- Utilities: Public water; Public sewer; Cable connected; Electricity connected; Sewer connected; Water connected
- Home design: Condominium (residential); One story; Faces west; Entry on first floor
- Construction: Block construction; Shingle roof; Slab foundation
- Exterior features: Enclosed, screened rear porch/patio
Interior
- Kitchen: Microwave; Range; Refrigerator
- Bedrooms: 2 bedrooms
- Flooring: Carpet; Laminate; Tile
- Bathrooms: 2 full bathrooms
- Heating & cooling: Central heating (electric); Central air conditioning
- Interior features: Ceiling fans; Eat-in kitchen; Bonus room; Florida room; Great room
- Laundry & utility: Common area laundry room; Electric water heater
Neighborhood map
What this means for you Summary
Snapshot
- This is a 2-bed/2.0-bath condo listed at $130k.
Deal economics
- At list price, monthly cash flow is $-50 ($-601/yr) — negative.
- To cash-flow at today's rent, offer at most $121k (6.8% below list).
- Meets the 1% rule at list price ($2k rent vs $130k).
- Recommended offer: $118k (9.0% below list) — sets the bar for market timing.
- Cap rate 5.8% vs local median 4.1% in Pinellas Park — top-decile yield for the area; either an underpriced asset or a hidden risk that comps aren't pricing in. Stress-test before assuming the spread holds.
Location & tenants
- Location reads 78/100 on livability (#170 in FL, #2,546 nationally) — a middle-class / working-renter tenant base. Strengths: commute A+, cost of living A+, housing A+; Watch: employment D+, amenities F.
- Pinellas (suburban): math 51% / reading 51% proficiency, ranked #31 of 73 in FL (top 42%) — acceptable for families but not a draw, mixed tenant base, ~2y average lease.
- Zoned schools: Pinellas Central Elementary School (math 51% / reading 45%, grade D, #1,171 of 2,144 statewide, top 55%, 498 students, 64% FRL); Pinellas Park Middle School (math 44% / reading 38%, grade F, #353 of 571 statewide, top 63%, 1,126 students, 67% FRL); Pinellas Park High School (math 28% / reading 35%, grade F, #424 of 667 statewide, top 64%, 1,919 students, 57% FRL).
- Market conditions: Rents falling (-5.3%/yr); 203 active listings in the ZIP; 18 comparable units currently listed for rent nearby; rentals at typical pace (median 16d on market — plan ~3-4 weeks tenant-placement turnaround); 2,676 units permitted in Pinellas County in 2024 (1,422 in 5+ unit buildings).
- This rent runs 32% of the median local income ($66k/yr) — at the standard rent-burdened threshold; future hikes will face affordability resistance.
Forward outlook
- Local home prices are declining (-3.0%/yr); year-one equity from $899 of loan paydown is wiped out by about $4k of value loss. Plan a longer hold.
- Pinellas County population projected at +14% by 2050 — modest demand growth; plan on rents tracking national, not racing it.
Negotiation context
- It's been on market 111 days — a 9% lower offer ($118k) is reasonable based on typical stale-listing flexibility.
- Current owner paid $42k; list at $130k implies a 210% gain — meaningful room to come down on a strong offer.
Risks & watch-outs
- Watch-outs: HOA is 30% of rent.
- Climate carrying-cost: moderate flood risk; severe wind risk, 99% chance of damaging wind over 30y; extreme-heat days projected 7→27/yr by 2055 (HVAC capex compounding) — expect insurance premiums to compound above CPI over the hold.
Questions for the listing agent
- What do current leases actually rent for vs. the listed asking? Can we see a recent rent roll and the last 12 months of T-12 income?
- It's been on market 111 days. Have you received any prior offers? Is the seller open to a 9% concession, seller financing, or rate buy-down credit?
- Built in 1969 — when were the roof, HVAC, electrical panel, plumbing, and water heater last replaced?
- What does the HOA fee cover, when was the last increase, and are there any pending special assessments or reserve-fund shortfalls?
- Any open or pending special assessments — roof, HVAC, plumbing, elevator, façade? What's the per-unit balance and payoff schedule, and is the seller paying it off at close or rolling it to the buyer?
- Why hasn't it sold? Are there any deal-killer items the seller is aware of (foundation, flood, title, zoning, code violations)?
- Is there a deadline driving the sale (1031 exchange, divorce, estate, relocation)? That informs how much negotiation room exists.
- Schools are D-rated, which usually means shorter tenancies and higher turnover. Who's the typical renter profile here, and what's been the actual vacancy rate?
- The area grade is low — what's the realistic commute time and amenity access for the typical tenant pool here? Any planned neighborhood developments (good or bad) we should know about?
- What's the average days-on-market for RENTAL listings here right now (not sales)? A rising rental-DOM trend means longer vacancies and softer asking-rent achievability than the comps imply.
- What's the recent tenant-quality profile in this submarket — average credit score on applications, eviction rate, late-payment / NSF rate, and stable-employment percentage? A property-management company in the area should have these aggregated.
- How much new apartment / multifamily construction is in the pipeline within 1–3 miles? Heavy new supply (>2% of stock underway) typically softens rents 12–24 months out; light construction supports rent growth.
Investment metrics
- 1% rule
- 1.38% ✓
- Cap rate
- 5.83%
- Cash-on-cash
- -1.65%
- DSCR
- 0.93
- GRM
- 6.0
CMA / ARV
No comps found within radius.
Projected returns pro-forma
-3.0% appreciation · 0.0% rent growth · sell at horizon
- IRR
- -24.5%
- Equity multiple
- 0.20×
- Total profit
- $-29,139
- Equity at exit
- $19,383
- IRR
- -48.8%
- Equity multiple
- -0.33×
- Total profit
- $-48,275
- Equity at exit
- $11,240
Cash invested: $36,400 (down + closing). Projections, not guarantees.
Landlord ↔ Tenant lean methodology
- Overall (STATE)
- 87 Strongly Landlord-Friendly
- State Florida
- 87 Strongly Landlord-Friendly · R+3
- County
- — inherits STATE
- City
- — inherits STATE
ZIP-level market 33782
- Rents YoY
- -5.3%
- Active inventory
- 203
- Price-to-rent
- 6.0×
Monthly cashflow live
- Estimated rent
- $1,795 high interval (Pro) →
- Mortgage (P&I)
- −$682
- Tax from tax record
- −$197 /mo · $2,363/yr
- Insurance
- −$54
- HOA
- −$535
- Vacancy / Maint / Mgmt
- −$377
- Net cashflow
- $-50
Break-even live
Sensitivity live
| Price | -10% $23 | -5% $-13 | +0% $-50 | +5% $-87 | +10% $-124 |
|---|---|---|---|---|---|
| Rent | -10% $-192 | -5% $-121 | +0% $-50 | +5% $21 | +10% $92 |
| Rate | -1.0pp $15 | -0.5pp $-17 | base $-50 | +0.5pp $-84 | +1.0pp $-118 |
UW: 25.0% down · 7.5% · 30yr · 1.5% tax · 5.0% vac · 8.0% maint · 8.0% mgmt
Financing live
Cash to close
- Down payment
- $32,500
- Closing costs
- $3,900
- Reserves months
- —
- Total cash needed
- —
Loan-product check · same deal, 3 products live
Conventional
25% down · 7.5% · 30yr
- Down + closing
- —
- Monthly P&I
- —
- Monthly cashflow
- —
- DSCR
- —
- Eligible?
- —
Personal DTI + credit; lowest rate.
DSCR
20% down · 8.5% · 30yr
- Down + closing
- —
- Monthly P&I
- —
- Monthly cashflow
- —
- DSCR
- —
- Eligible?
- —
No personal income docs; deal must DSCR.
Hard money
10% down · 12.0% · 12mo
- Down + closing
- —
- Monthly P&I
- —
- Monthly cashflow
- —
- DSCR
- —
- Eligible?
- —
Short-term bridge; refi at stabilization.
Rent comps 18 comps
| Address | Beds | Baths | Sqft | Rent | $/sqft | DOM | Units | Dist |
|---|---|---|---|---|---|---|---|---|
| 9911 Dahlia St #38 Pinellas Park, FL | 2.0 | 1.0 | 850 | $1,300 | $1.53 | 9d | 1 | 0.13mi |
| 10321 Larchmont Pl N Pinellas Park, FL | 2.0 | 1.0 | 840 | $1,700 | $2.02 | 26d | 1 | 0.28mi |
| 5200 Springwood Blvd Pinellas Park, FL | 1.0 | 1.0 | 700 | $1,350 | $1.93 | 0d | 4 | 0.35mi |
| 9505 49th St N Pinellas Park, FL | 1.0–3.0 | 1.0–2.0 | 1049 | $2,273 | $2.17 | 0d | 20 | 0.40mi |
| 5641 94th Ter N Pinellas Park, FL | 3.0 | 2.0 | 1066 | $2,200 | $2.06 | 9d | 1 | 0.48mi |
| 10770 US Highway 19 N #605 Pinellas Park, FL | 2.0 | 2.0 | 1000 | $1,800 | $1.80 | 26d | 1 | 0.50mi |
| 4973 91st Ave Unit C Pinellas Park, FL | 2.0 | 2.0 | 875 | $1,475 | $1.69 | 15d | 1 | 0.55mi |
| 4973 91st Ave Unit 12 (C) Pinellas Park, FL | 2.0 | 2.0 | 875 | $1,475 | $1.69 | 16d | 1 | 0.55mi |
| 5501 110th Ave N Pinellas Park, FL | 1.0–3.0 | 1.0–2.0 | 1001 | $1,977 | $1.97 | 0d | 13 | 0.77mi |
| 4701 88th Ave N Pinellas Park, FL | 1.0–2.0 | 1.0–2.0 | 855 | $1,853 | $2.17 | 12d | 20 | 0.79mi |
| 5865 92nd Ave N Pinellas Park, FL | 3.0 | 2.0 | 1062 | $2,400 | $2.26 | 19d | 1 | 0.80mi |
| 4940 87th Ave Unit C Pinellas Park, FL | 2.0 | 1.0 | 700 | $2,600 | $3.71 | 26d | 1 | 0.86mi |
| 6132 100th Cir N Pinellas Park, FL | 3.0 | 1.0 | 901 | $1,995 | $2.21 | 26d | 1 | 0.93mi |
| 6132 100th Cir N Pinellas Park, FL | 3.0 | 1.0 | 901 | $1,995 | $2.21 | 0d | 1 | 0.93mi |
| 8400 49th St N Pinellas Park, FL | 1.0–2.0 | 1.0–2.0 | 707 | $1,749 | $2.47 | 0d | 21 | 0.98mi |
| 8311 56th Way Unit 2 Pinellas Park, FL | 1.0 | 1.0 | 750 | $2,200 | $2.93 | 26d | 1 | 1.13mi |
| 4355 84th Ave N Pinellas Park, FL | 1.0 | 1.0 | 700 | $1,550 | $2.21 | 4d | 10 | 1.16mi |
| 4771 78th Ave N Pinellas Park, FL | 2.0 | 2.0 | 903 | $1,640 | $1.82 | 25d | 1 | 1.33mi |
HOA detail condo
- Monthly dues
- $535 · $6,420/yr
- Assessments
- None detected in remarks — confirm with the listing agent.
Listing history 19 events
-
2026-06-18status $130,000 Pending 111 DOM
-
2026-06-18days on market $130,000 Active 111 DOM
-
2026-06-17days on market $130,000 Active 110 DOM
-
2026-06-16days on market $130,000 Active 109 DOM
-
2026-06-15days on market $130,000 Active 108 DOM
-
2026-06-13days on market $130,000 Active 106 DOM
-
2026-06-09days on market $130,000 Active 102 DOM
-
2026-06-08days on market $130,000 Active 101 DOM
-
2026-06-07days on market $130,000 Active 100 DOM
-
2026-06-04days on market $130,000 Active 97 DOM
-
2026-06-03pricedays on market $130,000 Active 96 DOM
-
2026-06-01days on market $139,900 Active 94 DOM
-
2026-05-31days on market $139,900 Active 93 DOM
-
2026-04-15price $139,900
-
2026-03-13price $149,000
-
2026-02-27$164,900 Active
-
1999-11-17soldstatus $42,000
-
1990-03-06soldstatus $43,000
-
1990-03-01soldstatus $43,000
ⓘ Source: listings_history table (triggers on properties + properties_extension) + one-shot
backfill from property_details.listing_events for pre-trigger history.
Tax reassessment forecast FL · Resets to sale price
- Current annual tax
- $2,363 · $197/mo
- Projected year-2 tax
- $2,363 · $197/mo
- Expected delta
- $0/yr ($0/mo · 0.0%)
ⓘ Screening estimate from a state-policy table — verify with the county assessor before closing.
Climate risk First Street
- Flood 5/10 Major FEMA zone X (shaded) · 23% chance over 30 yrs
- Wildfire 1/10 Low
- Heat 10/10 Extreme 7 d/yr ≥107°F today · 27 d/yr by 30 yrs out
- Wind 10/10 Extreme 99% chance of damaging wind over 30 yrs
- Air quality 3/10 Moderate 3 unhealthy d/yr today · 3 by 30 yrs out
Nearby sold comps map
Loading sold comps map…
Walkable amenities ~0.75 mi
Loading nearby amenities…
Taxation est. · year 1
- Rental income
- $21,535
- − Mortgage interest
- −$7,282
- − Property taxes
- −$2,363
- − Insurance
- −$650
- − Repairs & maintenance
- −$1,723
- − Management
- −$1,723
- − HOA
- −$6,420
- − Depreciation
- −$3,782
- Taxable loss
- −$2,407
- Est. tax savings @ 24.0%
- +$578
- After-tax cash flow
- $-23/yr
For passive investors: Depreciation is non-cash, so a rental often shows a tax loss while cash-flowing — sheltering income. Rental losses are passive: they offset passive income freely, and up to $25,000/yr can offset ordinary (W-2) income if you actively participate and your MAGI is under $100k (phasing out to $0 by $150k); unused losses carry forward. On sale, claimed depreciation is recaptured at up to 25%, and gains may owe capital-gains tax (a 1031 exchange can defer both). Figures are a year-1 estimate at your 24.0% rate — not tax advice; consult a CPA.
Schools (NCES district)
- District
- Pinellas
- NCES district ID
- 1201560
- Math proficiency
- 51% ▼ -5.00%
- Reading proficiency
- 51% ▼ -3.00%
- Median HH income
- $46,270
- Composite
- 43.27/100
- National rank
- #3046
- State rank
- #31 of 73 in FL
Livability — Pinellas Park
- Score
- 78/100
- State rank
- #170
- US rank
- #2546
Category grades
Schools grade is shown separately in the Schools card above.
Census & demographics
- Census place
- Pinellas Park, FL
- County
- Pinellas County · 939,478 people
- City population
- 50,533
- Metro
- Tampa-St. Petersburg-Clearwater, FL
- Population (ZIP)
- 22,461
- Household income
- $66,461
- Rent vs Own
- Severe rent burden
- 486.0
Population outlook (Pinellas County) Hauer SSP2
- Today (2025)
- 1,027,532 people
- By 2030
- 1,063,586 · +3.5%
- By 2040
- 1,125,020 · +9.5%
- By 2050
- 1,168,637 · +13.7%
- By 2075
- 1,265,188 · +23.1%
- By 2100
- 1,260,357 · +22.7%
Race, ethnicity, and origin ACS 2023
- Neighborhood character
- Predominantly White (68%)
- Race & ethnicity
- White 68% Hispanic / Latino 12% Asian 12% Two or more races 8% Black 5%
- Hispanic origin (detail)
- Mexican 3% Puerto Rican 2% Cuban 2%
- Common ancestry
- Lithuanian 3% Italian 3% Romanian 2%
- Foreign-born
- 17% · Canada, Vietnam, China
- Languages at home
- 78% English-only · Spanish 9% Vietnamese 7% Other Indo-European 2%
Political lean MEDSL · Pinellas
- 2024 margin
- Lean R (+5.2) · D 46.9% · R 52.1%
- 2008→2024 swing
- -13.5pp toward R · 2008: 8.3pp · 2024: -5.2pp
- All cycles
- 2024: R+5.2 2020: D+0.2 2016: R+1.1 2012: D+5.6 2008: D+8.3
Not yet ingested
- Civics
- —
Market trends
- HPI YoY
- ▼ -250.17%
- Current HPI
- 314.1689
- Rent YoY
- ▼ -5.28%
- Metro
- Tampa-St. Petersburg-Clearwater, FL
- State GDP YoY
- ▲ 3.28%
- F500 in state
- 36
Industry mix (Fortune 500 HQ in FL)
| Industry | F500 HQs | Revenue |
|---|---|---|
| Industrial Technology | 2 | $29B |
|
||
| Insurance | 2 | $17B |
|
||
| Retail | 1 | $60B |
|
||
| Technology Distribution | 1 | $58B |
|
||
| Homebuilding | 1 | $35B |
|
||
| Technology Manufacturing | 1 | $35B |
|
||
Price history
+225.3% since first listed6 events — show timeline
- 2026-04-15 Price Changed $139,900 Stellar MLS as Distributed by MLS Grid
- 2026-03-13 Price Changed $149,000 Stellar MLS as Distributed by MLS Grid
- 2026-02-27 Listed $164,900 Stellar MLS as Distributed by MLS Grid
- 1999-11-17 Sold (Public Records) $42,000 Public Records
- 1990-03-06 Sold (Public Records) $43,000 Public Records
- 1990-03-01 Sold (Public Records) $43,000 Public Records
Property tax history
+9.1%/yrLatest (2025): $2,363 · +10.4% YoY. Source: county tax records.
Cash-flow waterfall
monthlySold comps — $/sqft
last 12 mo · ≤1 miLoading sold comps…