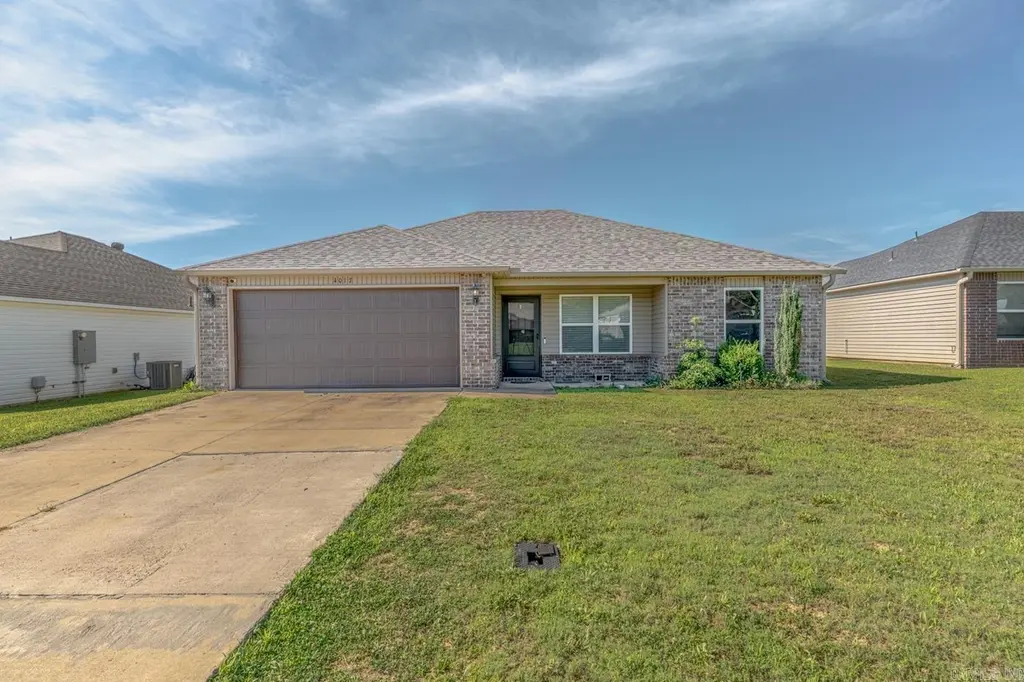
4017 Willow Ridge Dr · Jonesboro, AR
Flood risk 1/10 · Minimal
- FEMA flood zone
- —
- Chance of flooding over 30 yrs
- 0.0%
- Est. flood insurance / yr
- —
Fire risk 4/10 · Minor
- Est. fire insurance / yr
- $1,499 – $2,785
Heat risk 5/10 · Moderate
- Hot days now (above 108°F)
- 7 days/yr
- Hot days in 30 yrs
- 21 days/yr
Wind risk 4/10 · Minor
- Chance of severe wind over 30 yrs
- 8.0%
Air-quality risk 2/10 · Minimal
- Unhealthy air days now
- 0 days/yr
- Unhealthy air days in 30 yrs
- 1 days/yr
Risk factors via First Street. Map © Google.
Why this score? — see what drove the D+ grade
The composite is a weighted blend of 9 inputs, each scored 0–100. Each bar is that input's sub-score; the figure is the points it added to the 100-point composite (weight × sub-score).
- Cash flow +16.1/30.0
- Appreciation +9.7/10.0
- DSCR +5.0/10.0
- 1% rule +3.3/10.0
- Livability +3.2/5.0
- ARV discount +2.5/15.0
- Rent growth +2.5/5.0
- Condition / age +2.5/5.0
- Schools +1.9/10.0
$189,900
🖨 Deal sheet 📄 Offer letter ✓ Due diligence
Listing remarks MLS
Welcome to Market 4017 Willow Ridge Dr in Jonesboro, AR! Located in the Willow Pointe Subdivision, this 3-bedroom, 2-bath home offers 1,148 sq. ft. of comfortable living space on approximately 0.18+/- acres. The home features a brick and vinyl exterior, architectural shingle roof, guttering, and a slab foundation for easy maintenance. Inside, you'll find an all-electric floor plan with a spacious living area, dedicated laundry room, and a walk-in closet in the primary suite. The kitchen and dining areas provide a functional layout for everyday living. Additional features include a 2-car garage and backyard space. Conveniently located near shopping, dining, schools, and medical facilities, this property offers an excellent opportunity for first-time buyers, downsizers, or investors alike. Schedule your showing today!
Key facts
- Walk-in closet
- Functional layout
- Backyard space
Tags
Property features AI
Finance
- Financial info: Financing available: VA, FHA, Conventional, Cash, Rural Development, In-house financing
Exterior
- Parking: Attached garage for 2 cars
- Utilities: Public water; Public sewer
- Home design: Brick and metal/vinyl siding exterior; Located inside city limits
- Construction: Slab foundation; Architectural shingle roof
- Exterior features: Guttering; Paved road access; Level, cleared lot inside subdivision
Interior
- Kitchen: Free-standing stove; Microwave; Dishwasher; Ice maker connection
- Bedrooms: Walk-in closet(s) in bedrooms
- Flooring: Vinyl flooring
- Bathrooms: 2 full bathrooms
- Heating & cooling: Central electric heating; Central electric cooling
- Interior features: Washer connection; Electric dryer connection; Electric water heater; Smoke detectors; Walk-in closets; Ceiling fans; Kitchen counters with Formica
- Laundry & utility: Dedicated laundry room; Washer connection; Electric dryer connection
Neighborhood map
What this means for you Summary
Snapshot
- This is a 3-bed/2.0-bath single-family listed at $190k.
Deal economics
- At list price, monthly cash flow is $96 ($1k/yr) — positive.
- The deal already cash-flows at list — no discount required.
- To meet the 1% rule (rent ≥ 1% of price), the offer needs to be $158k (17.0% below list).
- Recommended offer: $158k (17.0% below list) — sets the bar for 1% rule.
- Cap rate 6.9% vs local median 4.4% in Jonesboro — top-decile yield for the area; either an underpriced asset or a hidden risk that comps aren't pricing in. Stress-test before assuming the spread holds.
Location & tenants
- Location reads 65/100 on livability (#145 in AR) — a middle-class / working-renter tenant base. Strengths: cost of living A+, housing A+, health & safety A+; Watch: crime F, amenities F, commute F.
- Nettleton School District (urban): math 21% / reading 24% proficiency, ranked #199 of 238 in AR (top 84%) — low school quality limits family demand, transient renter base, plan for 1-2y turnover.
- Zoned schools: Nettleton Steam School (math 33% / reading 26%, grade F, #305 of 454 statewide, top 71%, 324 students, 100% FRL); Nettleton High School (math 11% / reading 27%, grade F, #248 of 292 statewide, top 86%, 981 students, 68% FRL) — zoned schools average 84% FRL vs 56% district-wide (28 pts higher); higher-poverty schools than district average — tighter screening recommended.
- Market conditions: 152 active listings in the ZIP; 8 comparable units currently listed for rent nearby; rentals lingering (median 44d on market — plan ~5-8 weeks vacancy on turnover, expect pricing pressure); 100% of comp listings sitting > 30 days — soft ceiling on asking rent; solid renter incomes; 926 units permitted in Craighead County in 2024 (69 in 5+ unit buildings).
Forward outlook
- In year one you build about $19k of equity ($1k loan paydown + $18k appreciation (9.4% local appreciation)).
- Craighead County population projected at +38% by 2050 — long-run rental-demand tailwind backs the buy-and-hold thesis.
- At projected returns (9.4% appreciation + 3.0% rent growth), your $53k cash investment doubles in ~3 years — after that, you're playing with house money.
- By year 2, paydown + projected appreciation supports a ~$31k cash-out refi (75% LTV) — recoverable capital for the next deal without selling this one.
Negotiation context
- Only 14 days on market — expect competitive offers; lowballing is unlikely to land.
- 5 sale attempts since 8y ago with the ask held roughly flat each time — persistent listings suggest the price (not the market) is what's stuck; bring a comps-based counter.
- Current owner paid $150k; 27% above their basis — modest negotiation headroom, anchor on the comps not their cost.
Risks & watch-outs
- Climate carrying-cost: extreme-heat days projected 7→21/yr by 2055 (HVAC capex compounding) — expect insurance premiums to compound above CPI over the hold.
Questions for the listing agent
- Is there a deadline driving the sale (1031 exchange, divorce, estate, relocation)? That informs how much negotiation room exists.
- Schools are D-rated, which usually means shorter tenancies and higher turnover. Who's the typical renter profile here, and what's been the actual vacancy rate?
- Crime grade is F in this area — have there been break-ins, vandalism, or insurance claims at this property in the last 3 years? What carrier currently insures it and at what premium?
- The area grade is low — what's the realistic commute time and amenity access for the typical tenant pool here? Any planned neighborhood developments (good or bad) we should know about?
- What's the average days-on-market for RENTAL listings here right now (not sales)? A rising rental-DOM trend means longer vacancies and softer asking-rent achievability than the comps imply.
- What's the recent tenant-quality profile in this submarket — average credit score on applications, eviction rate, late-payment / NSF rate, and stable-employment percentage? A property-management company in the area should have these aggregated.
- How much new for-sale + rental construction is in the pipeline within 1–3 miles? Heavy new supply typically softens prices + rents 12–24 months out; constrained supply supports both.
Investment metrics
- 1% rule
- 0.83% ✗
- Cap rate
- 6.90%
- Cash-on-cash
- 2.17%
- DSCR
- 1.10
- GRM
- 10.0
CMA / ARV
- ARV (on-the-fly)
- $171,052
- Comps found
- 12
Show comp detail 12 sales within ~0.75 mi
| Address | Dist | Beds/Ba | Sqft | Sold | Price | $/sf | Match |
|---|---|---|---|---|---|---|---|
| 4110 Willow Ridge Dr | 0.05mi | 3/2.0 | 1,257 (+10%) | 8mo | $189,000 | $150 | 76 |
| 4200 Willow Pointe Dr | 0.06mi | 3/2.0 | 1,255 (+9%) | 12mo | $193,000 | $154 | 72 |
| 4308 Willow Ridge Dr | 0.11mi | 3/2.0 | 1,291 (+12%) | 4mo | $191,900 | $149 | 71 |
| 4304 Willow Ridge Dr | 0.10mi | 3/2.0 | 1,291 (+12%) | 11mo | $187,000 | $145 | 66 |
| 4510 Willow Pointe Dr | 0.22mi | 3/2.0 | 1,258 (+10%) | 13mo | $199,900 | $159 | 63 |
| 3700 Holland Dr | 0.53mi | 3/2.0 | 1,092 (-5%) | 13mo | $111,000 | $102 | 56 |
| 4529 Willow Pointe Dr | 0.28mi | 3/2.0 | 1,311 (+14%) | 12mo | $181,500 | $138 | 53 |
| 208 Holmes Rd | 0.45mi | 3/2.0 | 1,305 (+14%) | 13mo | $165,000 | $126 | 46 |
| 358 Wildwood Pt Pt | 0.75mi | 3/2.0 | 1,274 (+11%) | 2mo | $190,000 | $149 | 45 |
| 4805 Prospector Dr | 0.65mi | 3/2.0 | 1,301 (+13%) | 16mo | $185,925 | $143 | 34 |
| 4812 Prospector Dr | 0.67mi | 3/2.0 | 1,301 (+13%) | 16mo | $180,000 | $138 | 33 |
| 349 Wildwood Pt | 0.71mi | 3/2.0 | 1,310 (+14%) | 13mo | $197,900 | $151 | 33 |
Match score weights: distance 35% · size 25% · config 20% · recency 20%. Top-matched comps best support the ARV.
Projected returns pro-forma
9.42% appreciation · 3.0% rent growth · sell at horizon
- IRR
- 24.6%
- Equity multiple
- 2.92×
- Total profit
- $101,976
- Equity at exit
- $163,099
- IRR
- 21.9%
- Equity multiple
- 6.52×
- Total profit
- $293,575
- Equity at exit
- $343,571
Cash invested: $53,172 (down + closing). Projections, not guarantees.
Landlord ↔ Tenant lean methodology
- Overall (STATE)
- 92 Strongly Landlord-Friendly
- State Arkansas
- 92 Strongly Landlord-Friendly · R+14
- County
- — inherits STATE
- City
- — inherits STATE
ZIP-level market 72405
- Home prices YoY
- 3.5%
- Active inventory
- 152
- Price-to-rent
- 10.0×
Monthly cashflow live
- Estimated rent
- $1,576 high interval (Pro) →
- Mortgage (P&I)
- −$996
- Tax from tax record
- −$74 /mo · $886/yr
- Insurance
- −$79
- HOA
- −$0
- Vacancy / Maint / Mgmt
- −$331
- Net cashflow
- $96
Break-even live
UW: 25.0% down · 7.5% · 30yr · 1.5% tax · 5.0% vac · 8.0% maint · 8.0% mgmt
Financing live
Cash to close
- Down payment
- $47,475
- Closing costs
- $5,697
- Reserves months
- —
- Total cash needed
- —
Loan-product check · same deal, 3 products live
Conventional
25% down · 7.5% · 30yr
- Down + closing
- —
- Monthly P&I
- —
- Monthly cashflow
- —
- DSCR
- —
- Eligible?
- —
Personal DTI + credit; lowest rate.
DSCR
20% down · 8.5% · 30yr
- Down + closing
- —
- Monthly P&I
- —
- Monthly cashflow
- —
- DSCR
- —
- Eligible?
- —
No personal income docs; deal must DSCR.
Hard money
10% down · 12.0% · 12mo
- Down + closing
- —
- Monthly P&I
- —
- Monthly cashflow
- —
- DSCR
- —
- Eligible?
- —
Short-term bridge; refi at stabilization.
Rent comps 8 comps
| Address | Beds | Baths | Sqft | Rent | $/sqft | DOM | Units | Dist |
|---|---|---|---|---|---|---|---|---|
| 259 Wolf Den Dr Jonesboro, AR | 3.0 | 2.0 | 1419 | $1,550 | $1.09 | 43d | 1 | 0.38mi |
| 337 Wolf Den Dr Jonesboro, AR | 3.0 | 2.0 | 1419 | $1,600 | $1.13 | 43d | 1 | 0.50mi |
| 1504 Kathleen St Unit 2703 Jonesboro, AR | 2.0 | 1.5 | 1000 | $1,025 | $1.02 | 43d | 1 | 1.09mi |
| 1504 Kathleen St Unit 6403 Jonesboro, AR | 2.0 | 1.0 | 875 | $975 | $1.11 | 43d | 1 | 1.09mi |
| 5408 Mariposa Grove Dr Jonesboro, AR | 3.0 | 2.0 | 1209 | $1,595 | $1.32 | 43d | 1 | 1.11mi |
| 2008 Cotton St Unit 7 Jonesboro, AR | 2.0 | 1.0 | 875 | $925 | $1.06 | 43d | 1 | 1.38mi |
| 2102 Clark St Jonesboro, AR | 3.0 | 1.0 | 1000 | $925 | $0.93 | 43d | 1 | 1.42mi |
| 4850 E Highland Dr Unit HPA 419 Jonesboro, AR | 2.0 | 1.0 | 1000 | $1,300 | $1.30 | 43d | 1 | 1.48mi |
Listing history 12 events
-
2026-06-19days on market $189,900 Active 14 DOM
-
2026-06-18days on market $189,900 Active 13 DOM
-
2026-06-17days on market $189,900 Active 12 DOM
-
2026-06-16days on market $189,900 Active 11 DOM
-
2026-06-15days on market $189,900 Active 10 DOM
-
2026-06-14days on market $189,900 Active 8 DOM
-
2026-06-13statusdays on market $189,900 Active 7 DOM
-
2026-06-10days on market $189,900 New Listing 5 DOM
-
2026-06-09days on market $189,900 New Listing 4 DOM
-
2026-06-08days on market $189,900 New Listing 3 DOM
-
2026-06-07remarks 693-char remark
-
2026-06-07$189,900 New Listing 2 DOM
ⓘ Source: listings_history table (triggers on properties + properties_extension) + one-shot
backfill from property_details.listing_events for pre-trigger history.
Tax reassessment forecast AR · Resets to sale price
- Current annual tax
- $886 · $74/mo
- Projected year-2 tax
- $1,215 · $101/mo
- Expected delta
- +$329/yr (+$27/mo · 37.2%)
ⓘ Screening estimate from a state-policy table — verify with the county assessor before closing.
Climate risk First Street
- Flood 1/10 Low 0% chance over 30 yrs
- Wildfire 4/10 Moderate
- Heat 5/10 Major 7 d/yr ≥108°F today · 21 d/yr by 30 yrs out
- Wind 4/10 Moderate 8% chance of damaging wind over 30 yrs
- Air quality 2/10 Low 0 unhealthy d/yr today · 1 by 30 yrs out
Nearby sold comps map
Loading sold comps map…
Walkable amenities ~0.75 mi
Loading nearby amenities…
Taxation est. · year 1
- Rental income
- $18,912
- − Mortgage interest
- −$10,637
- − Property taxes
- −$886
- − Insurance
- −$950
- − Repairs & maintenance
- −$1,513
- − Management
- −$1,513
- − Depreciation
- −$5,524
- Taxable loss
- −$2,111
- Est. tax savings @ 24.0%
- +$507
- After-tax cash flow
- $1,661/yr
For passive investors: Depreciation is non-cash, so a rental often shows a tax loss while cash-flowing — sheltering income. Rental losses are passive: they offset passive income freely, and up to $25,000/yr can offset ordinary (W-2) income if you actively participate and your MAGI is under $100k (phasing out to $0 by $150k); unused losses carry forward. On sale, claimed depreciation is recaptured at up to 25%, and gains may owe capital-gains tax (a 1031 exchange can defer both). Figures are a year-1 estimate at your 24.0% rate — not tax advice; consult a CPA.
Schools (NCES district)
- District
- Nettleton School District
- NCES district ID
- 0510440
- Math proficiency
- 21% ▼ -16.00%
- Reading proficiency
- 24% ▼ -12.00%
- Median HH income
- $39,754
- Composite
- 19.0/100
- National rank
- #8846
- State rank
- #199 of 238 in AR
Livability — Jonesboro
- Score
- 65/100
- State rank
- #145
- US rank
- #12692
Category grades
Schools grade is shown separately in the Schools card above.
Census & demographics
- Census place
- Jonesboro, AR
- County
- Craighead County · 97,185 people
- City population
- 91,245
- Metro
- Jonesboro, AR
- Population (ZIP)
- 18,675
- Household income
- $92,440
- Rent vs Own
- Severe rent burden
- 443.0
Population outlook (Craighead County) Hauer SSP2
- Today (2025)
- 122,235 people
- By 2030
- 131,338 · +7.4%
- By 2040
- 149,862 · +22.6%
- By 2050
- 168,034 · +37.5%
- By 2075
- 208,094 · +70.2%
- By 2100
- 233,251 · +90.8%
Race, ethnicity, and origin ACS 2023
- Neighborhood character
- Predominantly White (78%)
- Race & ethnicity
- White 78% Two or more races 10% Black 9% Hispanic / Latino 3% Asian 1%
- Common ancestry
- Slovak 2% Italian 1% Serbian 1%
- Foreign-born
- 4% · Canada
- Languages at home
- 93% English-only · Spanish 4% Arabic 1%
Political lean MEDSL · Craighead
- 2024 margin
- Solid R (+37.4) · D 30.1% · R 67.5% · Other 2.4%
- 2008→2024 swing
- -12.9pp toward R · 2008: -24.5pp · 2024: -37.4pp
- All cycles
- 2024: R+37.4 2020: R+35.4 2016: R+35.2 2012: R+31.1 2008: R+24.5
Not yet ingested
- Civics
- —
Market trends
- HPI YoY
- ▲ 9.42%
- Current HPI
- 277.37
- Rent YoY
- —
- Metro
- Jonesboro, AR
- State GDP YoY
- ▲ 3.80%
- F500 in state
- 10
Industry mix (Fortune 500 HQ in AR)
| Industry | F500 HQs | Revenue |
|---|---|---|
| Retail | 1 | $681B |
|
||
| Food / Agriculture | 1 | $53B |
|
||
| Retail / Energy | 1 | $22B |
|
||
| Transportation / Logistics | 1 | $12B |
|
||
| Energy | 1 | $4B |
|
||
Price history
+42.1% since first listed10 events — show timeline
- 2026-06-05 Listed $189,900 CARMLS
- 2026-06-05 Listed $189,900 NEABOR MLS
- 2021-06-08 Sold (Public Records) $150,000 Public Records
- 2021-06-07 Sold (MLS) $150,000 CARMLS
- 2021-06-07 Sold (MLS) $150,000 NEABOR MLS
- 2021-04-27 Listing Removed — CARMLS
- 2021-04-20 Listed $146,900 CARMLS
- 2021-04-20 Listed $146,900 NEABOR MLS
- 2018-12-14 Sold (MLS) $133,600 NEABOR MLS
- 2018-07-30 Listed $133,600 NEABOR MLS
Property tax history
+15.9%/yrLatest (2025): $886 · +4.5% YoY. Source: county tax records.
Cash-flow waterfall
monthlySold comps — $/sqft
last 12 mo · ≤1 miLoading sold comps…