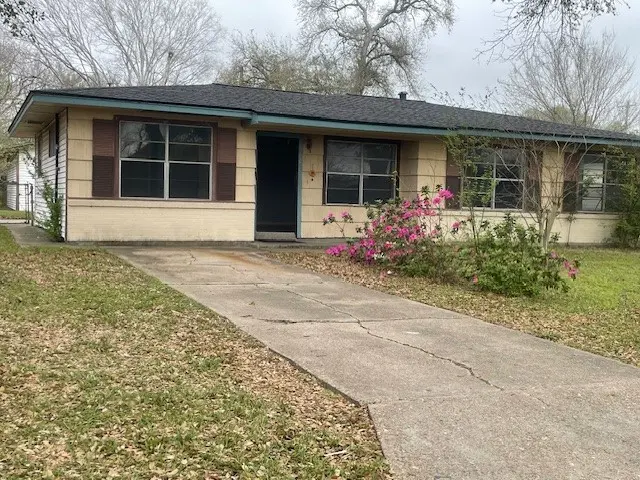
1710 14th Ave N · Texas City, TX
Flood risk 8/10 · Major
- FEMA flood zone
- X
- Chance of flooding over 30 yrs
- 0.6%
- Est. flood insurance / yr
- $507 – $1,088
Fire risk 1/10 · Minimal
- Est. fire insurance / yr
- $1,222 – $2,270
Heat risk 10/10 · Severe
- Hot days now (above 108°F)
- 7 days/yr
- Hot days in 30 yrs
- 27 days/yr
Wind risk 10/10 · Severe
- Chance of severe wind over 30 yrs
- 99.0%
Air-quality risk 2/10 · Minimal
- Unhealthy air days now
- 2 days/yr
- Unhealthy air days in 30 yrs
- 2 days/yr
Risk factors via First Street. Map © Google.
Why this score? — see what drove the B- grade
The composite is a weighted blend of 9 inputs, each scored 0–100. Each bar is that input's sub-score; the figure is the points it added to the 100-point composite (weight × sub-score).
- Cash flow +24.4/30.0
- ARV discount +15.0/15.0
- DSCR +7.9/10.0
- 1% rule +7.1/10.0
- Rent growth +3.7/5.0
- Livability +3.1/5.0
- Condition / age +2.5/5.0
- Schools +2.4/10.0
- Appreciation +0.0/10.0
$139,999
🖨 Deal sheet 📄 Offer letter ✓ Due diligence
Listing remarks MLS
4-bedroom, 2-bath home in Texas City and a bonus building with over 1000 square feet that includes 2 car garage and 2 storage areas. The main property features durable tile flooring throughout, offering both style and easy maintenance. The property has recently been a long term rental. Both the roof and CA/CH was recently replaced. Perfect for a starter home or investment/rental property with a little TLC! The spacious kitchen provides plenty of cabinet storage and room to cook and gather. All four bedrooms are generously sized with ample closet space, giving everyone room to spread out comfortably. The home had one car attached garage converted into a bedroom. The 4th bedroom can easily serve as a home office, study, playroom, or hobby space to fit your needs. Outside, you’ll find a 2 Car detached garage with a 2 dedicated workshop areas perfect for projects, storage, or additional workspace. This home offers functionality, space, and flexibility both inside and out.
Key facts
- 7,901 sq ft lot
- 3 garage spots
- Built 1969
Neighborhood map
What this means for you Summary
Snapshot
- This is a 4-bed/1.0-bath single-family listed at $140k.
Deal economics
- At list price, monthly cash flow is $219 ($3k/yr) — positive.
- The deal already cash-flows at list — no discount required.
- Meets the 1% rule at list price ($2k rent vs $140k).
- Recommended offer: $127k (9.0% below list) — sets the bar for market timing.
- Cap rate 8.7% vs local median 4.3% in Texas City — top-decile yield for the area; either an underpriced asset or a hidden risk that comps aren't pricing in. Stress-test before assuming the spread holds.
Location & tenants
- Location reads 62/100 on livability (#907 in TX) — a middle-class / working-renter tenant base. Strengths: cost of living A+, housing A+; Watch: crime D+, schools F, amenities F.
- Texas City ISD (suburban): math 28% / reading 29% proficiency, ranked #655 of 826 in TX (top 79%) — low school quality limits family demand, transient renter base, plan for 1-2y turnover; 66% free/reduced lunch — lower-income household profile, screen leases tightly.
- Market conditions: Rents rising fast (+4.9%/yr); 292 active listings in the ZIP; 10 comparable units currently listed for rent nearby; rentals at typical pace (median 24d on market — plan ~3-4 weeks tenant-placement turnaround); 40% of comp listings sitting > 30 days — soft ceiling on asking rent; 3,258 units permitted in Galveston County in 2024 (0 in 5+ unit buildings).
- This rent runs 31% of the median local income ($66k/yr) — at the standard rent-burdened threshold; future hikes will face affordability resistance.
Forward outlook
- Local home prices are declining (-3.0%/yr); year-one equity from $968 of loan paydown is wiped out by about $4k of value loss. Plan a longer hold.
- Galveston County population projected at +43% by 2050 — long-run rental-demand tailwind backs the buy-and-hold thesis.
Negotiation context
- It's been on market 101 days — a 9% lower offer ($127k) is reasonable based on typical stale-listing flexibility.
Risks & watch-outs
- Watch-outs: flood insurance adds $66/mo.
- Climate carrying-cost: severe flood risk; severe wind risk, 99% chance of damaging wind over 30y; extreme-heat days projected 7→27/yr by 2055 (HVAC capex compounding) — expect insurance premiums to compound above CPI over the hold.
Questions for the listing agent
- It's been on market 101 days. Have you received any prior offers? Is the seller open to a 9% concession, seller financing, or rate buy-down credit?
- Built in 1969 — when were the roof, HVAC, electrical panel, plumbing, and water heater last replaced?
- What's the actual annual flood-insurance premium (NFIP or private), and is the property in a SFHA with mandatory coverage?
- Why hasn't it sold? Are there any deal-killer items the seller is aware of (foundation, flood, title, zoning, code violations)?
- Is there a deadline driving the sale (1031 exchange, divorce, estate, relocation)? That informs how much negotiation room exists.
- Schools are F-rated, which usually means shorter tenancies and higher turnover. Who's the typical renter profile here, and what's been the actual vacancy rate?
- Crime grade is D in this area — have there been break-ins, vandalism, or insurance claims at this property in the last 3 years? What carrier currently insures it and at what premium?
- What's the average days-on-market for RENTAL listings here right now (not sales)? A rising rental-DOM trend means longer vacancies and softer asking-rent achievability than the comps imply.
- What's the recent tenant-quality profile in this submarket — average credit score on applications, eviction rate, late-payment / NSF rate, and stable-employment percentage? A property-management company in the area should have these aggregated.
- How much new for-sale + rental construction is in the pipeline within 1–3 miles? Heavy new supply typically softens prices + rents 12–24 months out; constrained supply supports both.
Investment metrics
- 1% rule
- 1.21% ✓
- Cap rate
- 8.74%
- Cash-on-cash
- 8.73%
- DSCR
- 1.39
- GRM
- 6.9
CMA / ARV
- ARV (median comp)
- $179,173
- List price
- $139,999
- Delta
- -21.86%
- Verdict
- UNDERPRICED
- Comps
- 20 within 1.0 mi
Show comp detail 12 sales within ~0.75 mi
| Address | Dist | Beds/Ba | Sqft | Sold | Price | $/sf | Match |
|---|---|---|---|---|---|---|---|
| 2206 18th Ave N | 0.45mi | 3/1.0 (-1) | 1,162 (-4%) | 0mo | $115,000 | $99 | 68 |
| 1216 15th Ave N | 0.50mi | 3/1.0 (-1) | 1,180 (-2%) | 0mo | $165,000 | $140 | 68 |
| 1513 21st St N | 0.29mi | 3/1.5 (-1) | 1,152 (-5%) | 6mo | $175,000 | $152 | 66 |
| 1702 16th Ave N | 0.14mi | 3/2.0 (-1) | 1,355 (+12%) | 2mo | $242,000 | $179 | 63 |
| 1010 15th Ave N | 0.70mi | 4/1.0 | 1,187 (-2%) | 2mo | $164,500 | $139 | 63 |
| 1111 12th 1/2 St N | 0.50mi | 3/2.0 (-1) | 1,235 (+2%) | 8mo | $199,000 | $161 | 58 |
| 2013 17th Ave N | 0.28mi | 3/2.0 (-1) | 1,355 (+12%) | 1mo | $229,900 | $170 | 57 |
| 2131 6th Ave N | 0.66mi | 3/1.0 (-1) | 1,228 (+2%) | 6mo | $169,000 | $138 | 56 |
| 2410 21st Ave N | 0.70mi | 4/2.0 | 1,288 (+7%) | 2mo | $160,000 | $124 | 51 |
| 2312 6th Ave N | 0.68mi | 3/1.0 (-1) | 1,100 (-9%) | 1mo | $165,000 | $150 | 48 |
| 2001 5th Ave N | 0.67mi | 3/1.0 (-1) | 1,078 (-11%) | 3mo | $199,000 | $185 | 43 |
| 1906 3rd Ave N | 0.74mi | 3/2.0 (-1) | 1,316 (+9%) | 8mo | $170,000 | $129 | 35 |
Match score weights: distance 35% · size 25% · config 20% · recency 20%. Top-matched comps best support the ARV.
Projected returns pro-forma
-3.0% appreciation · 4.91% rent growth · sell at horizon
- IRR
- -3.5%
- Equity multiple
- 0.86×
- Total profit
- $-5,318
- Equity at exit
- $20,874
- IRR
- 8.5%
- Equity multiple
- 1.71×
- Total profit
- $27,961
- Equity at exit
- $12,105
Cash invested: $39,200 (down + closing). Projections, not guarantees.
Landlord ↔ Tenant lean methodology
- Overall (STATE)
- 87 Strongly Landlord-Friendly
- State Texas
- 87 Strongly Landlord-Friendly · R+5
- County
- — inherits STATE
- City
- — inherits STATE
ZIP-level market 77590
- Home prices YoY
- -19.3%
- Rents YoY
- 4.9%
- Active inventory
- 292
- Price-to-rent
- 6.9×
Monthly cashflow live
- Estimated rent
- $1,696 high interval (Pro) →
- Mortgage (P&I)
- −$734
- Tax from tax record
- −$262 /mo · $3,145/yr
- Insurance
- −$58
- Flood insurance flood zone
- −$66 /mo · $798/yr
- HOA
- −$0
- Vacancy / Maint / Mgmt
- −$356
- Net cashflow
- $219
Break-even live
UW: 25.0% down · 7.5% · 30yr · 1.5% tax · 5.0% vac · 8.0% maint · 8.0% mgmt
Financing live
Cash to close
- Down payment
- $35,000
- Closing costs
- $4,200
- Reserves months
- —
- Total cash needed
- —
Loan-product check · same deal, 3 products live
Conventional
25% down · 7.5% · 30yr
- Down + closing
- —
- Monthly P&I
- —
- Monthly cashflow
- —
- DSCR
- —
- Eligible?
- —
Personal DTI + credit; lowest rate.
DSCR
20% down · 8.5% · 30yr
- Down + closing
- —
- Monthly P&I
- —
- Monthly cashflow
- —
- DSCR
- —
- Eligible?
- —
No personal income docs; deal must DSCR.
Hard money
10% down · 12.0% · 12mo
- Down + closing
- —
- Monthly P&I
- —
- Monthly cashflow
- —
- DSCR
- —
- Eligible?
- —
Short-term bridge; refi at stabilization.
Rent comps 10 comps
| Address | Beds | Baths | Sqft | Rent | $/sqft | DOM | Units | Dist |
|---|---|---|---|---|---|---|---|---|
| 1919 13th Ave N Texas City, TX | 1.0–3.0 | 1.0–2.0 | 950 | $1,499 | $1.58 | 1d | 6 | 0.20mi |
| 2418 14th Ave N Texas City, TX | 3.0 | 2.0 | 1488 | $1,775 | $1.19 | 3d | 1 | 0.55mi |
| 2608 21st St N Texas City, TX | 3.0 | 2.0 | 974 | $1,400 | $1.44 | 43d | 1 | 0.86mi |
| 2602 21st St N Texas City, TX | 1.0–3.0 | 1.0–2.0 | 768 | $1,450 | $1.89 | 1d | 44 | 0.92mi |
| 2526 3rd 1/2 Ave N Texas City, TX | 3.0 | 2.0 | 1240 | $1,550 | $1.25 | 24d | 1 | 0.92mi |
| 2714 5th Ave N Texas City, TX | 3.0 | 2.0 | 1382 | $1,800 | $1.30 | 43d | 1 | 1.01mi |
| 701 22nd Ave N Texas City, TX | 3.0 | 2.0 | 1011 | $1,386 | $1.37 | 43d | 1 | 1.09mi |
| 3106 Danforth Dr Texas City, TX | 3.0 | 1.0 | 1100 | $1,800 | $1.64 | 24d | 1 | 1.31mi |
| 2622 34th Ave N Texas City, TX | 3.0 | 1.0 | 1476 | $1,725 | $1.17 | 43d | 1 | 1.37mi |
| 221 18th Ave N Texas City, TX | 3.0 | 1.0 | 1040 | $1,550 | $1.49 | 12d | 1 | 1.41mi |
Listing history 16 events
-
2026-06-18days on market $139,999 Active 101 DOM
-
2026-06-17days on market $139,999 Active 100 DOM
-
2026-06-16days on market $139,999 Active 99 DOM
-
2026-06-15days on market $139,999 Active 98 DOM
-
2026-06-13days on market $139,999 Active 96 DOM
-
2026-06-09days on market $139,999 Active 92 DOM
-
2026-06-08days on market $139,999 Active 91 DOM
-
2026-06-07days on market $139,999 Active 90 DOM
-
2026-06-04days on market $139,999 Active 87 DOM
-
2026-06-03days on market $139,999 Active 86 DOM
-
2026-06-02days on market $139,999 Active 85 DOM
-
2026-06-01days on market $139,999 Active 84 DOM
-
2026-05-31days on market $139,999 Active 83 DOM
-
2026-04-24price $139,999 989-char remark
Show marketing remark (989 chars)
4-bedroom, 2-bath home in Texas City and a bonus building with over 1000 square feet that includes 2 car garage and 2 storage areas. The main property features durable tile flooring throughout, offering both style and easy maintenance. The property has recently been a long term rental. Both the roof and CA/CH was recently replaced. Perfect for a starter home or investment/rental property with a little TLC! The spacious kitchen provides plenty of cabinet storage and room to cook and gather. All four bedrooms are generously sized with ample closet space, giving everyone room to spread out comfortably. The home had one car attached garage converted into a bedroom. The 4th bedroom can easily serve as a home office, study, playroom, or hobby space to fit your needs. Outside, you’ll find a 2 Car detached garage with a 2 dedicated workshop areas perfect for projects, storage, or additional workspace. This home offers functionality, space, and flexibility both inside and out.
-
2026-03-09$143,500 Active 989-char remark
Show marketing remark (989 chars)
4-bedroom, 2-bath home in Texas City and a bonus building with over 1000 square feet that includes 2 car garage and 2 storage areas. The main property features durable tile flooring throughout, offering both style and easy maintenance. The property has recently been a long term rental. Both the roof and CA/CH was recently replaced. Perfect for a starter home or investment/rental property with a little TLC! The spacious kitchen provides plenty of cabinet storage and room to cook and gather. All four bedrooms are generously sized with ample closet space, giving everyone room to spread out comfortably. The home had one car attached garage converted into a bedroom. The 4th bedroom can easily serve as a home office, study, playroom, or hobby space to fit your needs. Outside, you’ll find a 2 Car detached garage with a 2 dedicated workshop areas perfect for projects, storage, or additional workspace. This home offers functionality, space, and flexibility both inside and out.
-
2016-08-16soldstatus
ⓘ Source: listings_history table (triggers on properties + properties_extension) + one-shot
backfill from property_details.listing_events for pre-trigger history.
Tax reassessment forecast TX · Resets to sale price
- Current annual tax
- $3,145 · $262/mo
- Projected year-2 tax
- $3,145 · $262/mo
- Expected delta
- $0/yr ($0/mo · 0.0%)
ⓘ Screening estimate from a state-policy table — verify with the county assessor before closing.
Climate risk First Street
- Flood 8/10 Severe FEMA zone X · 60% chance over 30 yrs
- Wildfire 1/10 Low
- Heat 10/10 Extreme 7 d/yr ≥108°F today · 27 d/yr by 30 yrs out
- Wind 10/10 Extreme 99% chance of damaging wind over 30 yrs
- Air quality 2/10 Low 2 unhealthy d/yr today · 2 by 30 yrs out
Nearby sold comps map
Loading sold comps map…
Walkable amenities ~0.75 mi
Loading nearby amenities…
Taxation est. · year 1
- Rental income
- $20,350
- − Mortgage interest
- −$7,842
- − Property taxes
- −$3,145
- − Insurance
- −$1,497
- − Repairs & maintenance
- −$1,628
- − Management
- −$1,628
- − Depreciation
- −$4,073
- Taxable income
- $537
- Est. tax owed @ 24.0%
- −$129
- After-tax cash flow
- $2,495/yr
For passive investors: Depreciation is non-cash, so a rental often shows a tax loss while cash-flowing — sheltering income. Rental losses are passive: they offset passive income freely, and up to $25,000/yr can offset ordinary (W-2) income if you actively participate and your MAGI is under $100k (phasing out to $0 by $150k); unused losses carry forward. On sale, claimed depreciation is recaptured at up to 25%, and gains may owe capital-gains tax (a 1031 exchange can defer both). Figures are a year-1 estimate at your 24.0% rate — not tax advice; consult a CPA.
Schools (NCES district)
- District
- Texas City ISD
- NCES district ID
- 4842510
- Math proficiency
- 28% ▼ -10.00%
- Reading proficiency
- 29% ▼ -4.00%
- Median HH income
- $44,875
- Composite
- 24.47/100
- National rank
- #7664
- State rank
- #655 of 826 in TX
Livability — Texas City
- Score
- 62/100
- State rank
- #907
- US rank
- #16268
Category grades
Schools grade is shown separately in the Schools card above.
Census & demographics
- Census place
- Texas City, TX
- County
- Galveston County · 357,330 people
- City population
- 49,936
- Metro
- Houston-The Woodlands-Sugar Land, TX
- Population (ZIP)
- 31,642
- Household income
- $65,801
- Rent vs Own
- Severe rent burden
- 1821.0
Population outlook (Galveston County) Hauer SSP2
- Today (2025)
- 390,640 people
- By 2030
- 425,226 · +8.9%
- By 2040
- 493,765 · +26.4%
- By 2050
- 559,698 · +43.3%
- By 2075
- 719,260 · +84.1%
- By 2100
- 819,628 · +109.8%
Race, ethnicity, and origin ACS 2023
- Neighborhood character
- Diverse neighborhood (Simpson 0.66)
- Race & ethnicity
- White 41% Hispanic / Latino 38% Two or more races 20% Black 17% Asian 2%
- Hispanic origin (detail)
- Mexican 33% Puerto Rican 1%
- Common ancestry
- Lithuanian 2% Slovak 1% Italian 1%
- Foreign-born
- 9% · Canada, Vietnam
- Languages at home
- 72% English-only · Spanish 26% Other Indo-European 1%
Political lean MEDSL · Galveston
- 2024 margin
- Strong R (+27.4) · D 35.7% · R 63.1% · Other 1.2%
- 2008→2024 swing
- -7.9pp toward R · 2008: -19.5pp · 2024: -27.4pp
- All cycles
- 2024: R+27.4 2020: R+22.6 2016: R+22.6 2012: R+26.9 2008: R+19.5
Not yet ingested
- Civics
- —
Market trends
- HPI YoY
- ▼ -58.35%
- Current HPI
- 244.5809
- Rent YoY
- ▲ 4.91%
- Metro
- Houston-The Woodlands-Sugar Land, TX
- State GDP YoY
- ▲ 3.95%
- F500 in state
- 110
Industry mix (Fortune 500 HQ in TX)
| Industry | F500 HQs | Revenue |
|---|---|---|
| Energy | 16 | $1,198B |
|
||
| Technology | 5 | $198B |
|
||
| Engineering / Construction | 4 | $72B |
|
||
| Energy Services | 3 | $60B |
|
||
| Utilities | 3 | $41B |
|
||
| Healthcare | 2 | $330B |
|
||
Price history
-2.4% since first listed3 events — show timeline
- 2026-04-24 Price Changed $139,999 HARMLS
- 2026-03-09 Listed $143,500 HARMLS
- 2016-08-16 Sold (Public Records) — Public Records
Property tax history
+4.1%/yrLatest (2025): $3,145 · +20.9% YoY. Source: county tax records.
Cash-flow waterfall
monthlySold comps — $/sqft
last 12 mo · ≤1 miLoading sold comps…