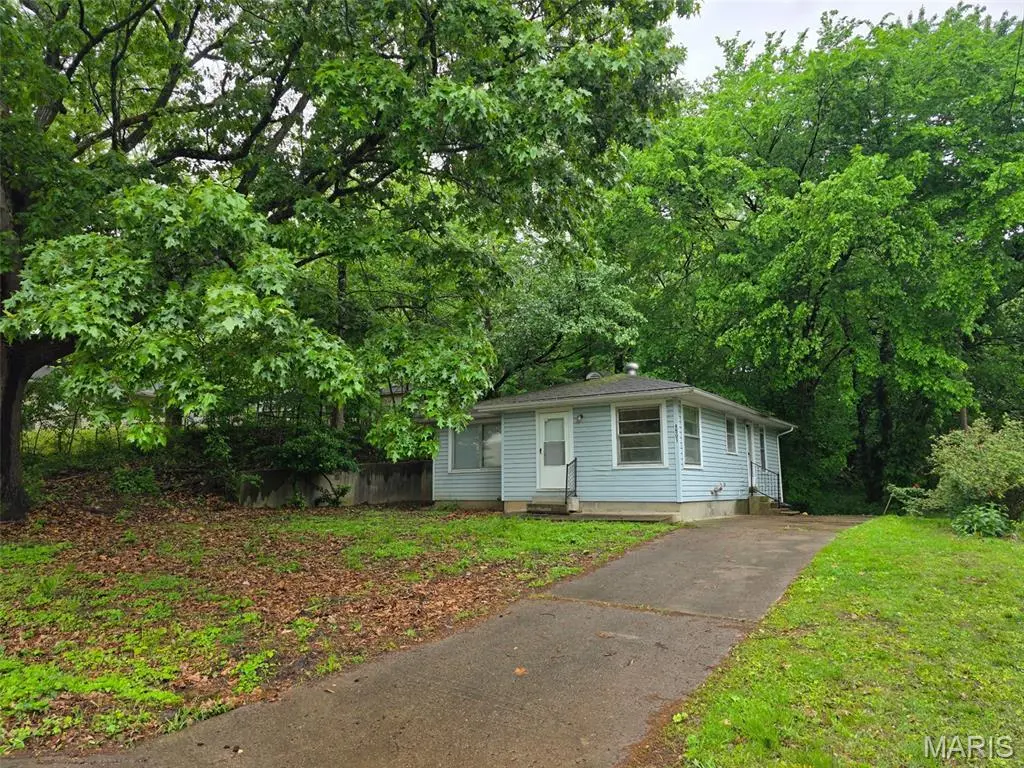
1803 N Main St · Cape Girardeau, MO
Flood risk 5/10 · Moderate
- FEMA flood zone
- X (unshaded)
- Chance of flooding over 30 yrs
- 0.24%
- Est. flood insurance / yr
- $473 – $860
Fire risk 1/10 · Minimal
- Est. fire insurance / yr
- $1,054 – $1,958
Heat risk 5/10 · Moderate
- Hot days now (above 108°F)
- 7 days/yr
- Hot days in 30 yrs
- 20 days/yr
Wind risk 2/10 · Minimal
- Chance of severe wind over 30 yrs
- 3.0%
Air-quality risk 2/10 · Minimal
- Unhealthy air days now
- 0 days/yr
- Unhealthy air days in 30 yrs
- 2 days/yr
Risk factors via First Street. Map © Google.
Why this score? — see what drove the C grade
The composite is a weighted blend of 9 inputs, each scored 0–100. Each bar is that input's sub-score; the figure is the points it added to the 100-point composite (weight × sub-score).
- Cash flow +18.5/30.0
- ARV discount +15.0/15.0
- DSCR +5.8/10.0
- 1% rule +4.0/10.0
- Rent growth +3.3/5.0
- Livability +3.2/5.0
- Schools +3.1/10.0
- Condition / age +2.5/5.0
- Appreciation +0.0/10.0
$105,000
🖨 Deal sheet (PDF) 📄 Offer letter ✓ Due diligence
Listing remarks
Charming and affordable, this cozy 2-bedroom, 1-bath home offers a great opportunity for a variety of buyers. The layout is efficient and easy to maintain, making it ideal for first-time buyers, downsizers, or investors. Built in 1950, the home features classic character paired with practical living. Inside, you’ll find a comfortable living area, functional kitchen space, and well-sized bedrooms that provide flexibility for everyday use. Situated on a manageable lot, the property offers just the right amount of outdoor space without the burden of heavy upkeep. Conveniently located in Cape Girardeau, you’ll enjoy easy access to local amenities, shopping, and dining. Whether you&r
Key facts
- 7,187 sq ft lot
- Built 1950
- Listed 58 days
Property features AI
Finance
- Other: Living area approximately 904 (assessor); Lot dimensions approximately 60 x 120 with paved city street frontage
- Financial info: Lease not considered
Exterior
- Parking: Concrete parking surface
- Utilities: Public water; Public sewer; Electric service available; Natural gas available; Cable available
- Home design: Single-family residence; One and one-half levels; Private ownership
- Construction: Concrete and vinyl siding construction; Shingle roof; Concrete perimeter foundation (permanent)
- Exterior features: Front and back yard; Panel doors
Interior
- Kitchen: Refrigerator
- Bedrooms: 2 bedrooms on the main level
- Flooring: Wood flooring
- Bathrooms: 1 full bathroom on the main level
- Heating & cooling: Forced air heating; Central air conditioning
- Interior features: Basement with 8+ ft poured concrete, storage space and a sump pump; Refrigerator included
- Laundry & utility: Sump pump in basement
Neighborhood map
What this means for you Summary
Snapshot
- This is a 2-bed/1.0-bath single-family listed at $105k.
Deal economics
- At list price, monthly cash flow is $100 ($1k/yr) — positive.
- The deal already cash-flows at list — no discount required.
- To meet the 1% rule (rent ≥ 1% of price), the offer needs to be $94k (10.4% below list).
- Recommended offer: $94k (10.4% below list) — sets the bar for 1% rule.
- Cap rate 7.4% vs local median 3.9% in Cape Girardeau — top-decile yield for the area; either an underpriced asset or a hidden risk that comps aren't pricing in. Stress-test before assuming the spread holds.
Location & tenants
- Location reads 64/100 on livability (#297 in MO) — a middle-class / working-renter tenant base. Strengths: cost of living A+, housing A+; Watch: employment D+, crime F, amenities F.
- Cape Girardeau 63 (urban): math 33% / reading 42% proficiency, ranked #188 of 324 in MO (top 58%) — families likely to look elsewhere, expect single-tenant / working-renter base with shorter leases; 60% free/reduced lunch — lower-income household profile, screen leases tightly.
- Zoned schools: Blanchard Elem. (math 42% / reading 62%, grade C-, #231 of 1,115 statewide, top 24%, 296 students, 0% FRL); Central Jr. High (math 36% / reading 41%, grade F, #202 of 391 statewide, top 54%, 618 students, 0% FRL); Central High (math 36% / reading 47%, grade F, #234 of 521 statewide, top 45%, 1,341 students, 0% FRL) — zoned schools average 0% FRL vs 60% district-wide (60 pts lower); this property's tenant base skews higher-income than the district average.
- Market conditions: Rents rising (+3.3%/yr); 330 active listings in the ZIP; 4 comparable units currently listed for rent nearby; rentals lingering (median 46d on market — plan ~5-8 weeks vacancy on turnover, expect pricing pressure); 100% of comp listings sitting > 30 days — soft ceiling on asking rent; 81 units permitted in Cape Girardeau County in 2024 (0 in 5+ unit buildings).
- This rent is only 17% of the median local income ($67k/yr) — well below the 30% rent-burden line; pricing power to push rent on renewal without tenant pushback.
Forward outlook
- Local home prices are declining (-3.0%/yr); year-one equity from $726 of loan paydown is wiped out by about $3k of value loss. Plan a longer hold.
- Cape Girardeau County population projected at +17% by 2050 — long-run rental-demand tailwind backs the buy-and-hold thesis.
Negotiation context
- It's been on market 58 days — a 3% lower offer ($102k) is reasonable based on typical stale-listing flexibility.
- 5 sale attempts since 2y ago with the ask held roughly flat each time — persistent listings suggest the price (not the market) is what's stuck; bring a comps-based counter.
Risks & watch-outs
- Watch-outs: built in 1950 — expect roof / HVAC / electrical / plumbing capex.
- Climate carrying-cost: moderate flood risk; extreme-heat days projected 7→20/yr by 2055 (HVAC capex compounding) — expect insurance premiums to compound above CPI over the hold.
Questions for the listing agent
- It's been on market 58 days. Have you received any prior offers? Is the seller open to a 10% concession, seller financing, or rate buy-down credit?
- Built in 1950 — when were the roof, HVAC, electrical panel, plumbing, and water heater last replaced?
- Is there a deadline driving the sale (1031 exchange, divorce, estate, relocation)? That informs how much negotiation room exists.
- Crime grade is F in this area — have there been break-ins, vandalism, or insurance claims at this property in the last 3 years? What carrier currently insures it and at what premium?
- What's the average days-on-market for RENTAL listings here right now (not sales)? A rising rental-DOM trend means longer vacancies and softer asking-rent achievability than the comps imply.
- What's the recent tenant-quality profile in this submarket — average credit score on applications, eviction rate, late-payment / NSF rate, and stable-employment percentage? A property-management company in the area should have these aggregated.
- How much new for-sale + rental construction is in the pipeline within 1–3 miles? Heavy new supply typically softens prices + rents 12–24 months out; constrained supply supports both.
Investment metrics
- 1% rule
- 0.90% ✗
- Cap rate
- 7.44%
- Cash-on-cash
- 4.09%
- DSCR
- 1.18
- GRM
- 9.3
CMA / ARV
- ARV (median comp)
- $136,600
- List price
- $105,000
- Delta
- -23.13%
- Verdict
- UNDERPRICED
- Comps
- 20 within 1.0 mi
Show comp detail 12 sales within ~0.75 mi
| Address | Dist | Beds/Ba | Sqft | Sold | Price | $/sf | Match |
|---|---|---|---|---|---|---|---|
| 428 Green Acres Dr | 0.14mi | 2/1.0 | 900 (-0%) | 4mo | $156,500 | $174 | 89 |
| 2001 Donna St | 0.27mi | 2/1.0 | 896 (-1%) | 1mo | $169,000 | $189 | 85 |
| 1756 Northwoods Ct | 0.09mi | 2/2.0 | 908 (+0%) | 11mo | $60,000 | $66 | 82 |
| 1745 Northwoods Ct | 0.07mi | 3/1.0 (+1) | 960 (+6%) | 4mo | $129,900 | $135 | 78 |
| 1501 N Main St | 0.36mi | 2/1.0 | 938 (+4%) | 1mo | $125,000 | $133 | 76 |
| 370 Country Club Dr | 0.25mi | 2/1.0 | 968 (+7%) | 2mo | $119,900 | $124 | 75 |
| 1439 N Spanish St | 0.39mi | 2/1.0 | 926 (+2%) | 11mo | $121,900 | $132 | 69 |
| 234 O'connell | 0.20mi | 3/1.0 (+1) | 988 (+9%) | 3mo | $134,900 | $137 | 68 |
| 1545 N Main St | 0.28mi | 2/1.0 | 806 (-11%) | 12mo | $149,900 | $186 | 59 |
| 1207 N Spanish St | 0.65mi | 2/1.0 | 979 (+8%) | 2mo | $40,000 | $41 | 55 |
| 1430 N Spanish St | 0.42mi | 3/1.0 (+1) | 1,037 (+15%) | 15mo | $89,500 | $86 | 38 |
| 1206 N Spanish St | 0.65mi | 3/1.0 (+1) | 792 (-12%) | 18mo | $95,000 | $120 | 29 |
Match score weights: distance 35% · size 25% · config 20% · recency 20%. Top-matched comps best support the ARV.
Projected returns pro-forma
-3.0% appreciation · 3.27% rent growth · sell at horizon
- IRR
- -9.7%
- Equity multiple
- 0.65×
- Total profit
- $-10,419
- Equity at exit
- $15,656
- IRR
- 0.0%
- Equity multiple
- 1.00×
- Total profit
- $48
- Equity at exit
- $9,078
Cash invested: $29,400 (down + closing). Projections, not guarantees.
Landlord ↔ Tenant lean methodology
- Overall (STATE)
- 81 Strongly Landlord-Friendly
- State Missouri
- 81 Strongly Landlord-Friendly · R+10
- County
- — inherits STATE
- City
- — inherits STATE
ZIP-level market 63701
- Rents YoY
- 3.3%
- Active inventory
- 330
- Price-to-rent
- 9.3×
Monthly cashflow live
- Estimated rent
- $941 medium interval (Pro) →
- Mortgage (P&I)
- −$551
- Tax from tax record
- −$49 /mo · $589/yr
- Insurance
- −$44
- HOA
- −$0
- Vacancy / Maint / Mgmt
- −$198
- Net cashflow
- $100
Break-even live
Sensitivity live
| Price | -10% $160 | -5% $130 | +0% $100 | +5% $70 | +10% $41 |
|---|---|---|---|---|---|
| Rent | -10% $26 | -5% $63 | +0% $100 | +5% $137 | +10% $174 |
| Rate | -1.0pp $153 | -0.5pp $127 | base $100 | +0.5pp $73 | +1.0pp $45 |
UW: 25.0% down · 7.5% · 30yr · 1.5% tax · 5.0% vac · 8.0% maint · 8.0% mgmt
Financing live
Cash to close
- Down payment
- $26,250
- Closing costs
- $3,150
- Reserves months
- —
- Total cash needed
- —
Loan-product check · same deal, 3 products live
Conventional
25% down · 7.5% · 30yr
- Down + closing
- —
- Monthly P&I
- —
- Monthly cashflow
- —
- DSCR
- —
- Eligible?
- —
Personal DTI + credit; lowest rate.
DSCR
20% down · 8.5% · 30yr
- Down + closing
- —
- Monthly P&I
- —
- Monthly cashflow
- —
- DSCR
- —
- Eligible?
- —
No personal income docs; deal must DSCR.
Hard money
10% down · 12.0% · 12mo
- Down + closing
- —
- Monthly P&I
- —
- Monthly cashflow
- —
- DSCR
- —
- Eligible?
- —
Short-term bridge; refi at stabilization.
Rent comps 4 comps
| Address | Beds | Baths | Sqft | Rent | $/sqft | DOM | Units | Dist |
|---|---|---|---|---|---|---|---|---|
| 1710 N Sprigg St Cape Girardeau, MO | 2.0–4.0 | 2.0–4.0 | 1208 | $510 | $0.42 | 45d | 1 | 0.57mi |
| 2070 N Sprigg St Cape Girardeau, MO | 1.0–4.0 | 1.0–4.0 | 979 | $1,040 | $1.06 | 45d | 1 | 0.80mi |
| 318 N Sprigg St Unit 318-303 Cape Girardeau, MO | 1.0 | 1.0 | 680 | $625 | $0.92 | 45d | 1 | 1.48mi |
| Cape Girardeau Cape Girardeau, MO | 1.0–3.0 | 1.0–2.0 | 931 | $800 | $0.86 | 45d | 7 | 1.50mi |
Listing history 31 events
-
2026-06-21days on market $105,000 Active 58 DOM
-
2026-06-19days on market $105,000 Active 56 DOM
-
2026-06-18days on market $105,000 Active 55 DOM
-
2026-06-17days on market $105,000 Active 54 DOM
-
2026-06-16days on market $105,000 Active 53 DOM
-
2026-06-15days on market $105,000 Active 52 DOM
-
2026-06-14days on market $105,000 Active 50 DOM
-
2026-06-13days on market $105,000 Active 49 DOM
-
2026-06-10days on market $105,000 Active 47 DOM
-
2026-06-09days on market $105,000 Active 46 DOM
-
2026-06-08days on market $105,000 Active 45 DOM
-
2026-06-07days on market $105,000 Active 44 DOM
-
2026-06-05days on market $105,000 Active 41 DOM
-
2026-06-03days on market $105,000 Active 40 DOM
-
2026-06-02days on market $105,000 Active 39 DOM
-
2026-06-01days on market $105,000 Active 38 DOM
-
2026-05-31days on market $105,000 Active 37 DOM
-
2026-05-30days on market $105,000 Active 36 DOM
-
2026-04-24$105,000 Active 832-char remark
-
2025-01-10historical $1,000
-
2025-01-04$1,000
-
2024-08-27historical $1,000
-
2024-08-14price $1,000
-
2024-07-26$1,050
-
2024-06-17soldstatus
-
2024-06-14soldstatus Closed
-
2024-05-14status Pending
-
2024-05-13status Active
-
2024-05-13status Pending
-
2024-04-03price $89,900
-
2024-02-26$95,900 Active
ⓘ Source: listings_history table (triggers on properties + properties_extension) + one-shot
backfill from property_details.listing_events for pre-trigger history.
Tax reassessment forecast MO · Resets to sale price
- Current annual tax
- $589 · $49/mo
- Projected year-2 tax
- $1,018 · $85/mo
- Expected delta
- +$429/yr (+$36/mo · 72.9%)
ⓘ Screening estimate from a state-policy table — verify with the county assessor before closing.
Climate risk First Street
- Flood 5/10 Major FEMA zone X (unshaded) · 24% chance over 30 yrs
- Wildfire 1/10 Low
- Heat 5/10 Major 7 d/yr ≥108°F today · 20 d/yr by 30 yrs out
- Wind 2/10 Low 3% chance of damaging wind over 30 yrs
- Air quality 2/10 Low 0 unhealthy d/yr today · 2 by 30 yrs out
Nearby sold comps map
Loading sold comps map…
Walkable amenities ~0.75 mi
Loading nearby amenities…
Taxation est. · year 1
- Rental income
- $11,295
- − Mortgage interest
- −$5,882
- − Property taxes
- −$589
- − Insurance
- −$525
- − Repairs & maintenance
- −$904
- − Management
- −$904
- − Depreciation
- −$3,055
- Taxable loss
- −$563
- Est. tax savings @ 24.0%
- +$135
- After-tax cash flow
- $1,336/yr
For passive investors: Depreciation is non-cash, so a rental often shows a tax loss while cash-flowing — sheltering income. Rental losses are passive: they offset passive income freely, and up to $25,000/yr can offset ordinary (W-2) income if you actively participate and your MAGI is under $100k (phasing out to $0 by $150k); unused losses carry forward. On sale, claimed depreciation is recaptured at up to 25%, and gains may owe capital-gains tax (a 1031 exchange can defer both). Figures are a year-1 estimate at your 24.0% rate — not tax advice; consult a CPA.
Schools (NCES district)
- District
- Cape Girardeau 63
- NCES district ID
- 2907120
- Math proficiency
- 33% ▼ -6.00%
- Reading proficiency
- 42% ▼ -7.00%
- Median HH income
- $40,543
- Composite
- 31.49/100
- National rank
- #5974
- State rank
- #188 of 324 in MO
Livability — Cape Girardeau
- Score
- 64/100
- State rank
- #297
- US rank
- #13759
Category grades
Schools grade is shown separately in the Schools card above.
Census & demographics
- Census place
- Cape Girardeau, MO
- County
- Cape Girardeau County · 75,175 people
- City population
- 47,546
- Metro
- Cape Girardeau, MO-IL
- Population (ZIP)
- 39,345
- Household income
- $66,654
- Rent vs Own
- Severe rent burden
- 1300.0
Population outlook (Cape Girardeau County) Hauer SSP2
- Today (2025)
- 84,807 people
- By 2030
- 88,016 · +3.8%
- By 2040
- 93,914 · +10.7%
- By 2050
- 99,541 · +17.4%
- By 2075
- 114,527 · +35.0%
- By 2100
- 121,718 · +43.5%
Race, ethnicity, and origin ACS 2023
- Neighborhood character
- Predominantly White (79%)
- Race & ethnicity
- White 79% Black 12% Two or more races 4% Hispanic / Latino 3% Asian 3%
- Common ancestry
- Italian 2% Slovak 2% Lithuanian 2%
- Foreign-born
- 3% · China, Canada
- Languages at home
- 95% English-only · Spanish 1% Other Indo-European 1% Other Asian/Pacific 1%
Political lean MEDSL · Cape Girardeau
- 2024 margin
- Solid R (+46.5) · D 26.2% · R 72.7% · Other 1.1%
- 2008→2024 swing
- -12.9pp toward R · 2008: -33.6pp · 2024: -46.5pp
- All cycles
- 2024: R+46.5 2020: R+45.0 2016: R+50.1 2012: R+43.8 2008: R+33.6
Not yet ingested
- Civics
- —
Market trends
- HPI YoY
- ▼ -177.04%
- Current HPI
- 156.0433
- Rent YoY
- ▲ 3.27%
- Metro
- Cape Girardeau, MO-IL
- State GDP YoY
- ▲ 1.84%
- F500 in state
- 20
Industry mix (Fortune 500 HQ in MO)
| Industry | F500 HQs | Revenue |
|---|---|---|
| Healthcare | 1 | $163B |
|
||
| Insurance | 1 | $21B |
|
||
| Industrial Technology | 1 | $17B |
|
||
| Retail | 1 | $16B |
|
||
| Industrial Distribution | 1 | $10B |
|
||
| Utilities | 1 | $9B |
|
||
Price history
+9.5% since first listed13 events — show timeline
- 2026-04-24 Listed $105,000 MARIS as Distributed by MLS Grid
- 2025-01-10 Rental Removed $1,000 SHOWMOJO
- 2025-01-04 Listed for Rent $1,000 SHOWMOJO
- 2024-08-27 Rental Removed $1,000 SHOWMOJO
- 2024-08-14 Price Changed $1,000 SHOWMOJO
- 2024-07-26 Listed for Rent $1,050 SHOWMOJO
- 2024-06-17 Sold (Public Records) — Public Records
- 2024-06-14 Sold (MLS) — MARIS as Distributed by MLS Grid
- 2024-05-14 Pending — MARIS as Distributed by MLS Grid
- 2024-05-13 Relisted — MARIS as Distributed by MLS Grid
- 2024-05-13 Pending — MARIS as Distributed by MLS Grid
- 2024-04-03 Price Changed $89,900 MARIS as Distributed by MLS Grid
- 2024-02-26 Listed $95,900 MARIS as Distributed by MLS Grid
Property tax history
+1.2%/yrLatest (2025): $589 · +5.5% YoY. Source: county tax records.
Cash-flow waterfall
monthlySold comps — $/sqft
last 12 mo · ≤1 miLoading sold comps…