422 N Oakland Ave · Indianapolis city (balance), IN
Flood risk No data
- FEMA flood zone
- —
- Chance of flooding over 30 yrs
- —
- Est. flood insurance / yr
- —
Fire risk No data
- Est. fire insurance / yr
- —
Heat risk No data
- Hot days now (above threshold)
- —
- Hot days in 30 yrs
- —
Wind risk No data
- Chance of severe wind over 30 yrs
- —
Air-quality risk No data
- Unhealthy air days now
- —
- Unhealthy air days in 30 yrs
- —
Risk factors via First Street. Map © Google.
Why this score? — see what drove the C+ grade
The composite is a weighted blend of 9 inputs, each scored 0–100. Each bar is that input's sub-score; the figure is the points it added to the 100-point composite (weight × sub-score).
- Cash flow +26.9/30.0
- 1% rule +10.0/10.0
- DSCR +9.3/10.0
- ARV discount +7.5/15.0
- Rent growth +4.3/5.0
- Livability +2.5/5.0
- Schools +1.4/10.0
- Condition / age +1.0/5.0
- Appreciation +0.0/10.0
$114,500
🖨 Deal sheet 📄 Offer letter ✓ Due diligence
Listing remarks
Today Monday 4/6/2026 The asset manager has requested all know that there are multiple offers Highest and Best offers due tomorrow Tuesday 4/7/2026 by Noon. BANK OWNED - Double that was converted by prior owner to 2 sep. condominiums. The whole building is for sale not just the individual units. 3BR's 1 Bath per side with basement. Alley access for rear parking. This one could be made to be nice and possibly rent for $1,000+ a month. It is missing electrical so there is no power. Take a flash light to show. No utilities to inspect. Please, view before inquiring or asking about prices. There are others in the area being worked on and or updated! This could be a great investment for you.
Key facts
- Alley access
- Basement
- 4,704 sq ft lot
Tags
Neighborhood map
What this means for you Summary
Snapshot
- This is a 6-bed/4.0-bath condo listed at $114k. Condition is rated poor.
Deal economics
- At list price, monthly cash flow is $319 ($4k/yr) — positive.
- The deal already cash-flows at list — no discount required.
- Meets the 1% rule at list price ($2k rent vs $114k).
- Cap rate 9.6% vs local median 4.4% in Indianapolis city (balance) — top-decile yield for the area; either an underpriced asset or a hidden risk that comps aren't pricing in. Stress-test before assuming the spread holds.
Location & tenants
- Location reads: area grade C — affects rentability + tenant quality, not the cash-flow math above.
- Indianapolis Public Schools (urban): math 14% / reading 20% proficiency, ranked #286 of 301 in IN (top 95%) — low school quality limits family demand, transient renter base, plan for 1-2y turnover; 77% free/reduced lunch — lower-income household profile, screen leases tightly.
- Market conditions: Rents rising fast (+7.3%/yr); 480 active listings in the ZIP; 1 comparable units currently listed for rent nearby; 1,906 units permitted in Marion County in 2024 (621 in 5+ unit buildings).
- This rent runs 43% of the median local income ($49k/yr) — at the standard rent-burdened threshold; future hikes will face affordability resistance.
Forward outlook
- Local home prices are declining (-3.0%/yr); year-one equity from $792 of loan paydown is wiped out by about $3k of value loss. Plan a longer hold.
- Marion County population projected at +18% by 2050 — long-run rental-demand tailwind backs the buy-and-hold thesis.
- At projected returns (-3.0% appreciation + 7.3% rent growth), your $32k cash investment doubles in ~7 years — after that, you're playing with house money.
Negotiation context
- Only 13 days on market — expect competitive offers; lowballing is unlikely to land.
Risks & watch-outs
- Watch-outs: property tax is 4.3% of price; built in 1930 — expect roof / HVAC / electrical / plumbing capex.
Questions for the listing agent
- Have any recent inspections been done? Can we get a copy of the seller's disclosures and any deferred-maintenance estimates?
- Built in 1930 — when were the roof, HVAC, electrical panel, plumbing, and water heater last replaced?
- Property tax is high relative to price — has the assessment been appealed recently, and will the sale trigger a re-assessment?
- Any open or pending special assessments — roof, HVAC, plumbing, elevator, façade? What's the per-unit balance and payoff schedule, and is the seller paying it off at close or rolling it to the buyer?
- Is there a deadline driving the sale (1031 exchange, divorce, estate, relocation)? That informs how much negotiation room exists.
- What's the average days-on-market for RENTAL listings here right now (not sales)? A rising rental-DOM trend means longer vacancies and softer asking-rent achievability than the comps imply.
- What's the recent tenant-quality profile in this submarket — average credit score on applications, eviction rate, late-payment / NSF rate, and stable-employment percentage? A property-management company in the area should have these aggregated.
- How much new apartment / multifamily construction is in the pipeline within 1–3 miles? Heavy new supply (>2% of stock underway) typically softens rents 12–24 months out; light construction supports rent growth.
Investment metrics
- 1% rule
- 1.53% ✓
- Cap rate
- 9.63%
- Cash-on-cash
- 11.92%
- DSCR
- 1.53
- GRM
- 5.5
CMA / ARV
No comps found within radius.
Projected returns pro-forma
-3.0% appreciation · 7.31% rent growth · sell at horizon
- IRR
- 7.4%
- Equity multiple
- 1.31×
- Total profit
- $9,831
- Equity at exit
- $17,072
- IRR
- 20.9%
- Equity multiple
- 3.21×
- Total profit
- $70,920
- Equity at exit
- $9,900
Cash invested: $32,060 (down + closing). Projections, not guarantees.
Landlord ↔ Tenant lean methodology
- Overall (STATE)
- 90 Strongly Landlord-Friendly
- State Indiana
- 90 Strongly Landlord-Friendly · R+11
- County
- — inherits STATE
- City
- — inherits STATE
ZIP-level market 46201
- Home prices YoY
- -33.9%
- Rents YoY
- 7.3%
- Active inventory
- 480
- Price-to-rent
- 5.5×
Monthly cashflow live
- Estimated rent
- $1,747 medium interval (Pro) →
- Mortgage (P&I)
- −$600
- Tax from tax record
- −$413 /mo · $4,959/yr
- Insurance
- −$48
- HOA
- −$0
- Vacancy / Maint / Mgmt
- −$367
- Net cashflow
- $319
Break-even live
UW: 25.0% down · 7.5% · 30yr · 1.5% tax · 5.0% vac · 8.0% maint · 8.0% mgmt
Financing live
Cash to close
- Down payment
- $28,625
- Closing costs
- $3,435
- Reserves months
- —
- Total cash needed
- —
Loan-product check · same deal, 3 products live
Conventional
25% down · 7.5% · 30yr
- Down + closing
- —
- Monthly P&I
- —
- Monthly cashflow
- —
- DSCR
- —
- Eligible?
- —
Personal DTI + credit; lowest rate.
DSCR
20% down · 8.5% · 30yr
- Down + closing
- —
- Monthly P&I
- —
- Monthly cashflow
- —
- DSCR
- —
- Eligible?
- —
No personal income docs; deal must DSCR.
Hard money
10% down · 12.0% · 12mo
- Down + closing
- —
- Monthly P&I
- —
- Monthly cashflow
- —
- DSCR
- —
- Eligible?
- —
Short-term bridge; refi at stabilization.
Rent comps 1 comps
| Address | Beds | Baths | Sqft | Rent | $/sqft | DOM | Units | Dist |
|---|---|---|---|---|---|---|---|---|
| 3710 E Market St Indianapolis, IN | 6.0 | 1.0 | 1232 | $1,450 | $1.18 | 14d | 1 | 0.52mi |
HOA detail condo
- Monthly dues
- $0 · $0/yr
- Likely covers
- electric
- Assessments
- None detected in remarks — confirm with the listing agent.
Listing history 3 events
-
2026-04-14status Pending
-
2026-03-31$114,500 Active
-
2026-03-17soldstatus $407,115
ⓘ Source: listings_history table (triggers on properties + properties_extension) + one-shot
backfill from property_details.listing_events for pre-trigger history.
Tax reassessment forecast IN · Partial reset (capped growth)
- Current annual tax
- $4,959 · $413/mo
- Projected year-2 tax
- $4,959 · $413/mo
- Expected delta
- $0/yr ($0/mo · 0.0%)
ⓘ Screening estimate from a state-policy table — verify with the county assessor before closing.
Nearby sold comps map
Loading sold comps map…
Walkable amenities ~0.75 mi
Loading nearby amenities…
Taxation est. · year 1
- Rental income
- $20,961
- − Mortgage interest
- −$6,414
- − Property taxes
- −$4,959
- − Insurance
- −$572
- − Repairs & maintenance
- −$1,677
- − Management
- −$1,677
- − Depreciation
- −$3,331
- Taxable income
- $2,331
- Est. tax owed @ 24.0%
- −$560
- After-tax cash flow
- $3,263/yr
For passive investors: Depreciation is non-cash, so a rental often shows a tax loss while cash-flowing — sheltering income. Rental losses are passive: they offset passive income freely, and up to $25,000/yr can offset ordinary (W-2) income if you actively participate and your MAGI is under $100k (phasing out to $0 by $150k); unused losses carry forward. On sale, claimed depreciation is recaptured at up to 25%, and gains may owe capital-gains tax (a 1031 exchange can defer both). Figures are a year-1 estimate at your 24.0% rate — not tax advice; consult a CPA.
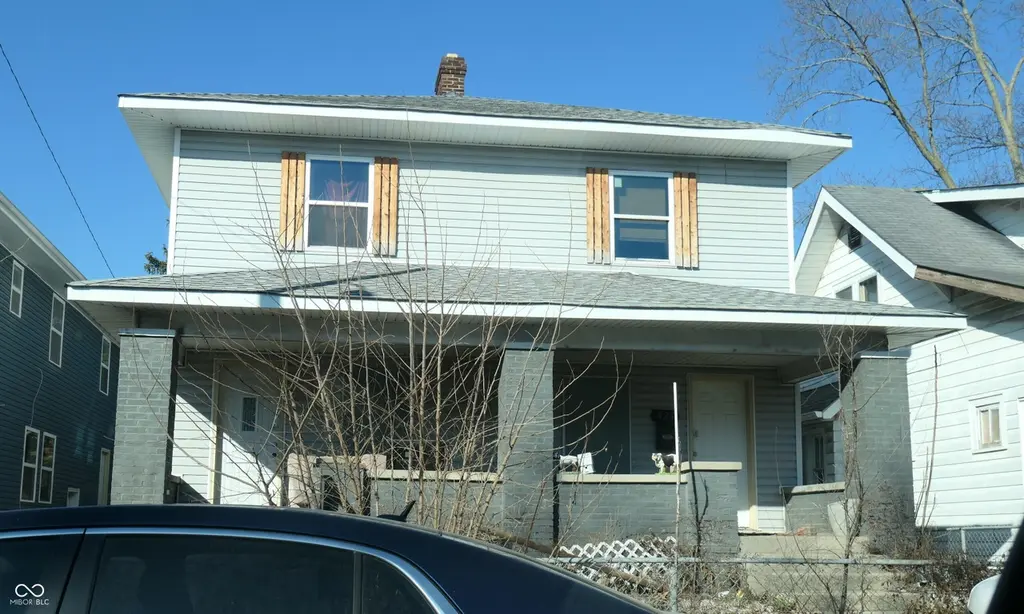
Condition & rehab AI · 3 photos
This property requires extensive repairs and is in poor condition. Boarded-up windows and missing siding indicate significant structural damage. Immediate repairs are needed to stabilize the property and improve its appearance.
Repairs flagged
- Major Boarded-up windows — Structural damage
- Major Missing siding — Exterior damage
Value-add opportunities
- Both Board up and repair windows — Safety and security
- Both Replace missing siding — Aesthetics and safety
Renovation cost estimate screening
| Repair item | Severity | Est. cost |
|---|---|---|
| Boarded-up windows · Structural damage | Major | $15,000–50,000 |
| Missing siding · Exterior damage | Major | $15,000–50,000 |
| Total estimated repair cost · 2 items | $30,000–100,000 |
Value-add ROI direction
- Both Board up and repair windows — Safety and security ↑
- Both Replace missing siding — Aesthetics and safety ↑
ⓘ Cost ranges are severity-bucket heuristics (US national rule-of-thumb). Get contractor quotes + a written scope before underwriting a rehab budget.
Schools (NCES district)
- District
- Indianapolis Public Schools
- NCES district ID
- 1804770
- Math proficiency
- 14% ▼ -7.00%
- Reading proficiency
- 20% ▼ -3.00%
- Median HH income
- $32,034
- Composite
- 13.69/100
- National rank
- #9499
- State rank
- #286 of 301 in IN
Livability — Indianapolis city (balance)
No livability data for this city. (Only ~50 U.S. cities are tracked.)
Census & demographics
- Census place
- Indianapolis city (balance), IN
- County
- Marion County · 998,460 people
- City population
- 881,119
- Metro
- Indianapolis-Carmel-Anderson, IN
- Population (ZIP)
- 30,335
- Household income
- $49,195
- Rent vs Own
- Severe rent burden
- 1906.0
Population outlook (Marion County) Hauer SSP2
- Today (2025)
- 1,025,572 people
- By 2030
- 1,065,727 · +3.9%
- By 2040
- 1,141,577 · +11.3%
- By 2050
- 1,208,920 · +17.9%
- By 2075
- 1,367,288 · +33.3%
- By 2100
- 1,438,201 · +40.2%
Race, ethnicity, and origin ACS 2023
- Neighborhood character
- Diverse neighborhood (Simpson 0.63)
- Race & ethnicity
- White 53% Hispanic / Latino 23% Black 18% Two or more races 9%
- Hispanic origin (detail)
- Mexican 14% Puerto Rican 2%
- Common ancestry
- Slovak 2% Lithuanian 2% Italian 1%
- Foreign-born
- 9% · Canada
- Languages at home
- 81% English-only · Spanish 17%
Political lean MEDSL · Marion
- 2024 margin
- Strong D (+27.7) · D 63.0% · R 35.3% · Other 1.7%
- 2008→2024 swing
- -0.7pp no change · 2008: 28.4pp · 2024: 27.7pp
- All cycles
- 2024: D+27.7 2020: D+29.1 2016: D+22.8 2012: D+22.2 2008: D+28.4
Not yet ingested
- Civics
- —
Market trends
- HPI YoY
- ▼ -192.51%
- Current HPI
- 375.0969
- Rent YoY
- ▲ 7.31%
- Metro
- Indianapolis-Carmel-Anderson, IN
- State GDP YoY
- ▲ 2.90%
- F500 in state
- 18
Industry mix (Fortune 500 HQ in IN)
| Industry | F500 HQs | Revenue |
|---|---|---|
| Industrial Machinery | 2 | $37B |
|
||
| Healthcare | 1 | $177B |
|
||
| Pharmaceuticals | 1 | $45B |
|
||
| Metals / Steel | 1 | $18B |
|
||
| Agriculture | 1 | $17B |
|
||
| Packaging | 1 | $12B |
|
||
Price history
-71.9% since first listed3 events — show timeline
- 2026-04-14 Pending — MIBOR as Distributed by MLS Grid
- 2026-03-31 Listed $114,500 MIBOR as Distributed by MLS Grid
- 2026-03-17 Sold (Public Records) $407,115 Public Records
Property tax history
+26.7%/yrLatest (2025): $4,959 · +26.7% YoY. Source: county tax records.
Cash-flow waterfall
monthlySold comps — $/sqft
last 12 mo · ≤1 miLoading sold comps…