 🏷️ Likely Rental
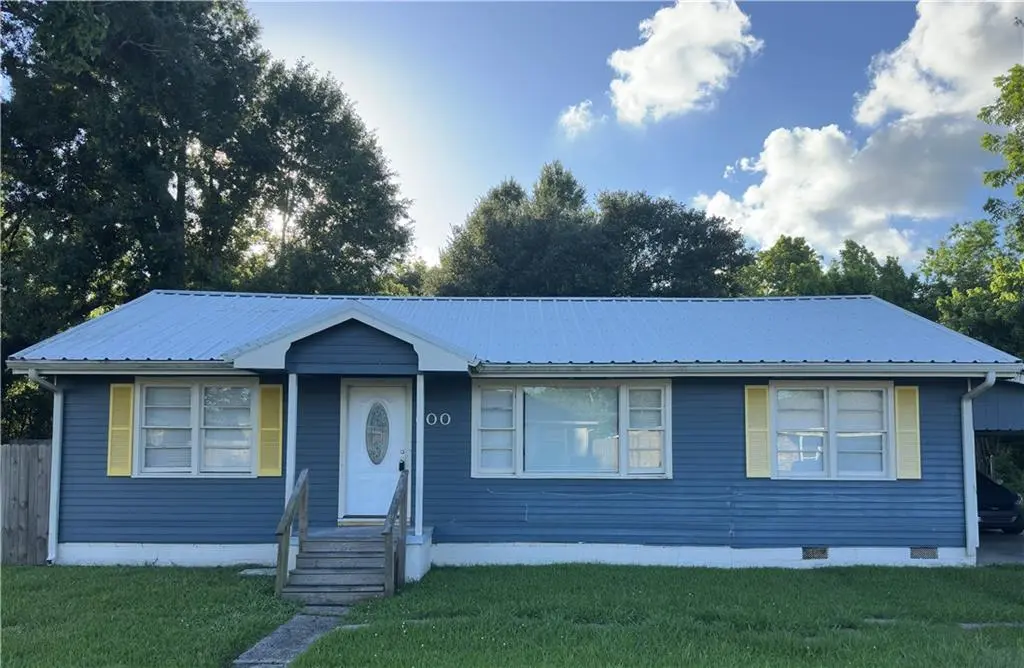
600 Kinler St · Luling, LA
Flood risk 7/10 · Major
- FEMA flood zone
- X (shaded)
- Chance of flooding over 30 yrs
- 0.9%
- Est. flood insurance / yr
- $507 – $1,088
Fire risk 1/10 · Minimal
- Est. fire insurance / yr
- $1,269 – $2,357
Heat risk 9/10 · Severe
- Hot days now (above 108°F)
- 7 days/yr
- Hot days in 30 yrs
- 22 days/yr
Wind risk 9/10 · Severe
- Chance of severe wind over 30 yrs
- 99.0%
Air-quality risk 3/10 · Minor
- Unhealthy air days now
- 2 days/yr
- Unhealthy air days in 30 yrs
- 3 days/yr
Risk factors via First Street. Map © Google.
Why this score? — see what drove the C- grade
The composite is a weighted blend of 9 inputs, each scored 0–100. Each bar is that input's sub-score; the figure is the points it added to the 100-point composite (weight × sub-score).
- Cash flow +16.6/30.0
- ARV discount +15.0/15.0
- DSCR +5.2/10.0
- Schools +4.0/10.0
- 1% rule +3.6/10.0
- Livability +3.2/5.0
- Rent growth +2.5/5.0
- Condition / age +2.5/5.0
- Appreciation +0.0/10.0
$189,000
🖨 Deal sheet (PDF) 📄 Offer letter ✓ Due diligence
Listing remarks MLS
PRICED TO SELL & MOVE-IN READY! Welcome home to 600 Kinler Street, a beautifully updated 3-bedroom, 2-bathroom single-family gem perfectly situated in the highly sought-after community of Luling. Nestled within the top-rated St. Charles Parish school district, this property combines an unbeatable location with extensive modern upgrades. It offers an incredible, turnkey opportunity for first-time homebuyers, downsizers, or savvy investors looking for a pristine, low-maintenance home. The home features brand-new, wood-look waterproof laminate flooring--giving you the gorgeous aesthetic of hardwood with ultimate everyday durability and absolutely zero carpet. The heart of the home features a freshly updated kitchen equipped with sleek new cabinets offering ample storage and a modern look for the chef. Both bathrooms have also been updated, and one features a beautiful tiled shower. Outside you'll find a large yard perfect for hosting. Schedule your private tour today before it's gone! Property is also available for lease.
Key facts
- Large yard
- Updated kitchen
- Tiled shower
Tags
Property features AI
Exterior
- Parking: Covered carport with two spaces
- Security: Smoke detectors
- Utilities: Public water; Public sewer
- Home design: Single-story; Raised foundation; Very good condition
- Construction: Wood siding; Metal roof; Built with a raised foundation
- Exterior features: City lot; Oversized lot; Lot dimensions approximately 105 x 81
Interior
- Bathrooms: 2 full bathrooms
- Heating & cooling: Central heating; Central air conditioning
- Interior features: Ceiling fans; Carbon monoxide detector; Pantry
- Laundry & utility: Washer hookup; Dryer hookup
Neighborhood map
What this means for you Summary
Snapshot
- This is a 3-bed/2.0-bath single-family listed at $189k.
Deal economics
- At list price, monthly cash flow is $48 ($580/yr) — positive.
- The deal already cash-flows at list — no discount required.
- To meet the 1% rule (rent ≥ 1% of price), the offer needs to be $163k (13.6% below list).
- Recommended offer: $163k (13.6% below list) — sets the bar for 1% rule.
- Cap rate 7.0% vs local median 4.0% in Luling — top-decile yield for the area; either an underpriced asset or a hidden risk that comps aren't pricing in. Stress-test before assuming the spread holds.
Location & tenants
- Location reads 65/100 on livability (#144 in LA) — a middle-class / working-renter tenant base. Strengths: housing A+, employment A, cost of living A; Watch: amenities F, commute F, health & safety F.
- St. Charles Parish (suburban): math 40% / reading 51% proficiency, ranked #14 of 98 in LA (top 14%) — families likely to look elsewhere, expect single-tenant / working-renter base with shorter leases.
- Zoned schools: Luling Elementary School (math 27% / reading 29%, grade F, #355 of 646 statewide, top 55%, 734 students, 68% FRL); R.K. Smith Middle School (math 24% / reading 51%, grade F, #75 of 218 statewide, top 35%, 342 students, 67% FRL); Hahnville High School (math 40% / reading 46%, grade F, #66 of 265 statewide, top 25%, 1,491 students, 44% FRL).
- Market conditions: 154 active listings in the ZIP; 5 comparable units currently listed for rent nearby; rentals lingering (median 46d on market — plan ~5-8 weeks vacancy on turnover, expect pricing pressure); 60% of comp listings sitting > 30 days — soft ceiling on asking rent; solid renter incomes; 74 units permitted in St. Charles Parish in 2024 (0 in 5+ unit buildings).
Forward outlook
- Local home prices are declining (-3.0%/yr); year-one equity from $1k of loan paydown is wiped out by about $6k of value loss. Plan a longer hold.
- St. Charles County population projected to shrink 7% by 2050 — rents likely to lag national; underwrite the cash flow, not the appreciation.
Negotiation context
- Only 11 days on market — expect competitive offers; lowballing is unlikely to land.
- 7 sale attempts since 29y ago; this cycle's ask is 11712% above the opening price — seller raised mid-cycle; expect resistance to lowballs.
- Current owner paid $43k; list at $189k implies a 343% gain — meaningful room to come down on a strong offer.
Risks & watch-outs
- Watch-outs: flood insurance adds $66/mo; built in 1956 — expect roof / HVAC / electrical / plumbing capex.
- Climate carrying-cost: major flood risk; severe wind risk, 99% chance of damaging wind over 30y; extreme-heat days projected 7→22/yr by 2055 (HVAC capex compounding) — expect insurance premiums to compound above CPI over the hold.
Questions for the listing agent
- Built in 1956 — when were the roof, HVAC, electrical panel, plumbing, and water heater last replaced?
- What's the actual annual flood-insurance premium (NFIP or private), and is the property in a SFHA with mandatory coverage?
- Is there a deadline driving the sale (1031 exchange, divorce, estate, relocation)? That informs how much negotiation room exists.
- Schools are B-rated — typically a magnet for longer-tenancy family renters. What's the average tenant stay here, and is there a school-zone premium baked into asking?
- What's the average days-on-market for RENTAL listings here right now (not sales)? A rising rental-DOM trend means longer vacancies and softer asking-rent achievability than the comps imply.
- What's the recent tenant-quality profile in this submarket — average credit score on applications, eviction rate, late-payment / NSF rate, and stable-employment percentage? A property-management company in the area should have these aggregated.
- How much new for-sale + rental construction is in the pipeline within 1–3 miles? Heavy new supply typically softens prices + rents 12–24 months out; constrained supply supports both.
Investment metrics
- 1% rule
- 0.86% ✗
- Cap rate
- 7.02%
- Cash-on-cash
- 2.60%
- DSCR
- 1.12
- GRM
- 9.6
CMA / ARV
- ARV (on-the-fly)
- $240,828
- Comps found
- 12
Show comp detail 12 sales within ~0.75 mi
| Address | Dist | Beds/Ba | Sqft | Sold | Price | $/sf | Match |
|---|---|---|---|---|---|---|---|
| 510 Ellington Ave | 0.16mi | 3/2.0 | 1,290 (-2%) | 9mo | $251,000 | $195 | 82 |
| 509 Lauve Ln | 0.19mi | 4/2.0 (+1) | 1,309 (-0%) | 4mo | $249,900 | $191 | 81 |
| 722 Luling Ave | 0.33mi | 3/2.0 | 1,354 (+3%) | 12mo | $250,000 | $185 | 70 |
| 511 Lauve Ln | 0.19mi | 3/2.0 | 1,437 (+9%) | 7mo | $293,000 | $204 | 70 |
| 834 Mongrue St | 0.41mi | 3/2.0 | 1,386 (+5%) | 11mo | $239,500 | $173 | 63 |
| 1023 Gassen St | 0.63mi | 3/2.0 | 1,341 (+2%) | 6mo | $228,000 | $170 | 62 |
| 1008 Gassen St | 0.54mi | 3/2.0 | 1,456 (+11%) | 2mo | $275,000 | $189 | 55 |
| 215 Easy St | 0.18mi | 2/1.0 (-1) | 1,464 (+11%) | 14mo | $250,000 | $171 | 52 |
| 303 Talbot Dr | 0.26mi | 4/2.0 (+1) | 1,495 (+14%) | 10mo | $227,500 | $152 | 52 |
| 1262 Luling Estates Dr | 0.74mi | 4/2.0 (+1) | 1,240 (-6%) | 2mo | $152,000 | $123 | 49 |
| 805 Luling Ave | 0.38mi | 3/1.0 | 1,125 (-14%) | 9mo | $185,000 | $164 | 47 |
| 1106 Gassen St | 0.71mi | 3/2.0 | 1,450 (+10%) | 13mo | $265,000 | $183 | 39 |
Match score weights: distance 35% · size 25% · config 20% · recency 20%. Top-matched comps best support the ARV.
Projected returns pro-forma
-3.0% appreciation · 3.0% rent growth · sell at horizon
- IRR
- -14.6%
- Equity multiple
- 0.48×
- Total profit
- $-27,563
- Equity at exit
- $28,181
- IRR
- -5.9%
- Equity multiple
- 0.62×
- Total profit
- $-20,097
- Equity at exit
- $16,341
Cash invested: $52,920 (down + closing). Projections, not guarantees.
Landlord ↔ Tenant lean methodology
- Overall (STATE)
- 90 Strongly Landlord-Friendly
- State Louisiana
- 90 Strongly Landlord-Friendly · R+12
- County
- — inherits STATE
- City
- — inherits STATE
ZIP-level market 70070
- Home prices YoY
- -23.7%
- Active inventory
- 154
- Price-to-rent
- 9.6×
Monthly cashflow live
- Estimated rent
- $1,634 high interval (Pro) →
- Mortgage (P&I)
- −$991
- Tax from tax record
- −$106 /mo · $1,272/yr
- Insurance
- −$79
- Flood insurance flood zone
- −$66 /mo · $798/yr
- HOA
- −$0
- Vacancy / Maint / Mgmt
- −$343
- Net cashflow
- $48
Break-even live
Sensitivity live
| Price | -10% $155 | -5% $102 | +0% $48 | +5% $-5 | +10% $-59 |
|---|---|---|---|---|---|
| Rent | -10% $-81 | -5% $-16 | +0% $48 | +5% $113 | +10% $177 |
| Rate | -1.0pp $144 | -0.5pp $96 | base $48 | +0.5pp $-1 | +1.0pp $-50 |
UW: 25.0% down · 7.5% · 30yr · 1.5% tax · 5.0% vac · 8.0% maint · 8.0% mgmt
Financing live
Cash to close
- Down payment
- $47,250
- Closing costs
- $5,670
- Reserves months
- —
- Total cash needed
- —
Loan-product check · same deal, 3 products live
Conventional
25% down · 7.5% · 30yr
- Down + closing
- —
- Monthly P&I
- —
- Monthly cashflow
- —
- DSCR
- —
- Eligible?
- —
Personal DTI + credit; lowest rate.
DSCR
20% down · 8.5% · 30yr
- Down + closing
- —
- Monthly P&I
- —
- Monthly cashflow
- —
- DSCR
- —
- Eligible?
- —
No personal income docs; deal must DSCR.
Hard money
10% down · 12.0% · 12mo
- Down + closing
- —
- Monthly P&I
- —
- Monthly cashflow
- —
- DSCR
- —
- Eligible?
- —
Short-term bridge; refi at stabilization.
Rent comps 5 comps
| Address | Beds | Baths | Sqft | Rent | $/sqft | DOM | Units | Dist |
|---|---|---|---|---|---|---|---|---|
| 517 Gassen St Unit 1 Luling, LA | 2.0 | 1.0 | 975 | $1,300 | $1.33 | 13d | 1 | 0.11mi |
| 126 Gassen St Luling, LA | 2.0 | 1.0 | 878 | $1,400 | $1.59 | 45d | 1 | 0.26mi |
| 300 Saint Charles Blvd Luling, LA | 3.0 | 2.0 | 1500 | $1,700 | $1.13 | 45d | 1 | 0.27mi |
| 827 Milling Ave Luling, LA | 2.0–3.0 | 1.0 | 839 | $1,150 | $1.37 | 19d | 1 | 0.41mi |
| 1220 Paul Maillard Rd Apt 7 Luling, LA | 3.0 | 1.0 | 1008 | $1,400 | $1.39 | 45d | 1 | 0.58mi |
Listing history 8 events
-
2026-06-21days on market $189,000 Active 11 DOM
-
2026-06-18days on market $189,000 Active 8 DOM
-
2026-06-17days on market $189,000 Active 7 DOM
-
2026-06-16days on market $189,000 Active 6 DOM
-
2026-06-15days on market $189,000 Active 5 DOM
-
2026-06-13days on market $189,000 Active 3 DOM
-
2026-06-13remarks 689-char remark
-
2026-06-13$189,000 Active 2 DOM
ⓘ Source: listings_history table (triggers on properties + properties_extension) + one-shot
backfill from property_details.listing_events for pre-trigger history.
Tax reassessment forecast LA · Resets to sale price
- Current annual tax
- $1,272 · $106/mo
- Projected year-2 tax
- $1,272 · $106/mo
- Expected delta
- $0/yr ($0/mo · 0.0%)
ⓘ Screening estimate from a state-policy table — verify with the county assessor before closing.
Climate risk First Street
- Flood 7/10 Severe FEMA zone X (shaded) · 90% chance over 30 yrs
- Wildfire 1/10 Low
- Heat 9/10 Extreme 7 d/yr ≥108°F today · 22 d/yr by 30 yrs out
- Wind 9/10 Extreme 99% chance of damaging wind over 30 yrs
- Air quality 3/10 Moderate 2 unhealthy d/yr today · 3 by 30 yrs out
Nearby sold comps map
Loading sold comps map…
Walkable amenities ~0.75 mi
Loading nearby amenities…
Taxation est. · year 1
- Rental income
- $19,605
- − Mortgage interest
- −$10,587
- − Property taxes
- −$1,272
- − Insurance
- −$1,742
- − Repairs & maintenance
- −$1,568
- − Management
- −$1,568
- − Depreciation
- −$5,498
- Taxable loss
- −$2,631
- Est. tax savings @ 24.0%
- +$632
- After-tax cash flow
- $1,211/yr
For passive investors: Depreciation is non-cash, so a rental often shows a tax loss while cash-flowing — sheltering income. Rental losses are passive: they offset passive income freely, and up to $25,000/yr can offset ordinary (W-2) income if you actively participate and your MAGI is under $100k (phasing out to $0 by $150k); unused losses carry forward. On sale, claimed depreciation is recaptured at up to 25%, and gains may owe capital-gains tax (a 1031 exchange can defer both). Figures are a year-1 estimate at your 24.0% rate — not tax advice; consult a CPA.
Schools (NCES district)
- District
- St. Charles Parish
- NCES district ID
- 2201440
- Math proficiency
- 40% ▼ -38.00%
- Reading proficiency
- 51% ▼ -32.00%
- Median HH income
- $60,261
- Composite
- 40.0/100
- National rank
- #3830
- State rank
- #14 of 98 in LA
Livability — Luling
- Score
- 65/100
- State rank
- #144
- US rank
- #12653
Category grades
Schools grade is shown separately in the Schools card above.
Census & demographics
- Census place
- Luling, LA
- County
- Saint Charles Parish · 27,180 people
- City population
- 13,960
- Metro
- New Orleans-Metairie, LA
- Population (ZIP)
- 13,960
- Household income
- $76,539
- Rent vs Own
- Severe rent burden
- 362.0
Population outlook (St. Charles County) Hauer SSP2
- Today (2025)
- 53,296 people
- By 2030
- 53,030 · -0.5%
- By 2040
- 51,646 · -3.1%
- By 2050
- 49,771 · -6.6%
- By 2075
- 46,993 · -11.8%
- By 2100
- 44,473 · -16.6%
Race, ethnicity, and origin ACS 2023
- Neighborhood character
- Predominantly White (66%)
- Race & ethnicity
- White 66% Black 18% Two or more races 9% Hispanic / Latino 5% Native American 2% Asian 1%
- Hispanic origin (detail)
- Mexican 3%
- Common ancestry
- Lithuanian 18% Italian 2% Slovak 1%
- Foreign-born
- 2% · Canada, China
- Languages at home
- 95% English-only · Spanish 2% Chinese 1% French/Haitian/Cajun 1%
Political lean MEDSL · St. Charles
- 2024 margin
- Solid R (+32.4) · D 33.0% · R 65.4% · Other 1.6%
- 2008→2024 swing
- -1.1pp toward R · 2008: -31.2pp · 2024: -32.4pp
- All cycles
- 2024: R+32.4 2020: R+29.6 2016: R+30.8 2012: R+27.8 2008: R+31.2
Not yet ingested
- Civics
- —
Market trends
- HPI YoY
- ▼ -60.92%
- Current HPI
- 196.2122
- Rent YoY
- —
- Metro
- New Orleans-Metairie, LA
- State GDP YoY
- ▲ 3.29%
- F500 in state
- 10
Industry mix (Fortune 500 HQ in LA)
| Industry | F500 HQs | Revenue |
|---|---|---|
| Telecommunications | 2 | $23B |
|
||
| Utilities | 1 | $12B |
|
||
| Wholesale / Distribution | 1 | $5B |
|
||
| Advertising | 1 | $2B |
|
||
Price history
-93.8% since first listed12 events — show timeline
- 2026-06-12 Listed for Rent $1,600 RAAMLS
- 2026-06-10 Listed $189,000 GSREIN
- 2026-06-10 Listed $189,000 AcadianaMLS
- 2016-12-22 Sold (MLS) $42,680 GSREIN
- 2016-11-29 Pending — GSREIN
- 2016-11-20 Price Changed $44,000 GSREIN
- 2016-10-13 Price Changed $49,500 GSREIN
- 2016-08-23 Listed $55,000 GSREIN
- 2016-08-23 Listed $44,000 AcadianaMLS
- 1997-03-19 Listed $26,000 GSREIN
- 1997-03-19 Listed $26,000 AcadianaMLS
- 1997-03-19 Sold (MLS) $26,000 GSREIN
Property tax history
+5.3%/yrLatest (2024): $1,272 · +16.6% YoY. Source: county tax records.
Cash-flow waterfall
monthlySold comps — $/sqft
last 12 mo · ≤1 miLoading sold comps…