418 Jackson Ave NE · Brewster, OH
Flood risk 1/10 · Minimal
- FEMA flood zone
- X (unshaded)
- Chance of flooding over 30 yrs
- 0.0%
- Est. flood insurance / yr
- $507 – $1,088
Fire risk 1/10 · Minimal
- Est. fire insurance / yr
- $713 – $1,323
Heat risk 3/10 · Minor
- Hot days now (above 97°F)
- 7 days/yr
- Hot days in 30 yrs
- 17 days/yr
Wind risk 1/10 · Minimal
- Chance of severe wind over 30 yrs
- —
Air-quality risk 2/10 · Minimal
- Unhealthy air days now
- 0 days/yr
- Unhealthy air days in 30 yrs
- 1 days/yr
Risk factors via First Street. Map © Google.
Why this score? — see what drove the C- grade
The composite is a weighted blend of 9 inputs, each scored 0–100. Each bar is that input's sub-score; the figure is the points it added to the 100-point composite (weight × sub-score).
- ARV discount +15.0/15.0
- Cash flow +12.5/30.0
- Appreciation +5.3/10.0
- Schools +4.7/10.0
- DSCR +3.7/10.0
- Livability +3.2/5.0
- 1% rule +2.8/10.0
- Rent growth +2.5/5.0
- Condition / age +2.5/5.0
$135,000
🖨 Deal sheet (PDF) 📄 Offer letter ✓ Due diligence
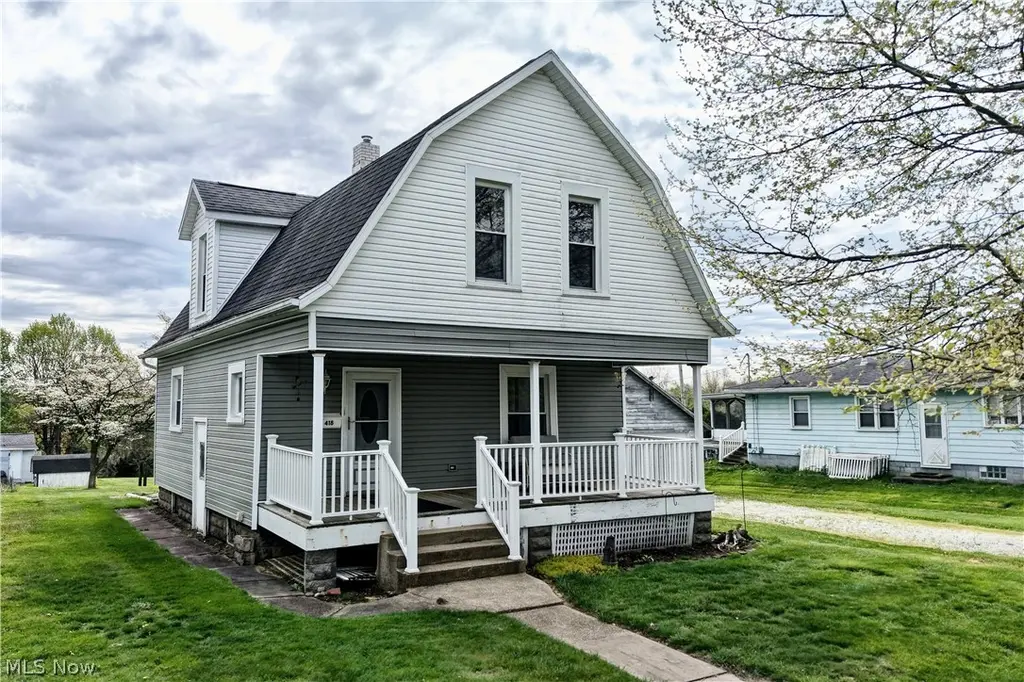
Listing remarks
This charming Brewster home is ready for its next chapter! Offering 2 bedrooms and 1 full bath, it features a comfortable layout with plenty of opportunity to make it your own. Situated on a spacious double lot, there’s room to spread out, garden, or simply enjoy the extra outdoor space. The detached 2-car garage provides great space for parking, storage, or a workshop. Whether you’re looking for a place to settle in or an opportunity to build equity, this property is packed with potential and waiting for your personal touch.
Key facts
- Double lot
- Outdoor space
- Detached garage
Tags
Neighborhood map
What this means for you Summary
Snapshot
- This is a 3-bed/1.0-bath single-family listed at $135k.
Deal economics
- At list price, monthly cash flow is $-21 ($-250/yr) — negative.
- To cash-flow at today's rent, offer at most $131k (2.7% below list).
- To meet the 1% rule (rent ≥ 1% of price), the offer needs to be $105k (22.2% below list).
- Recommended offer: $105k (22.2% below list) — sets the bar for 1% rule.
Location & tenants
- Location reads 65/100 on livability (#742 in OH) — a middle-class / working-renter tenant base. Strengths: crime A+, cost of living A+, housing A+; Watch: amenities F, commute F, employment D-.
- Fairless Local (rural): math 56% / reading 55% proficiency, ranked #365 of 656 in OH (top 56%) — acceptable for families but not a draw, mixed tenant base, ~2y average lease.
- Zoned schools: Fairless Elementary School (math 65% / reading 54%, grade B-, #670 of 1,584 statewide, top 45%, 602 students, 41% FRL); Fairless Middle School (math 49% / reading 57%, grade C+, #372 of 654 statewide, top 58%, 316 students, 40% FRL); Fairless High School (math 47% / reading 52%, grade D, #390 of 781 statewide, top 54%, 343 students, 33% FRL) — zoned schools at 38% FRL track the district average.
- Market conditions: 9 active listings in the ZIP; 1 comparable units currently listed for rent nearby; 528 units permitted in Stark County in 2024 (84 in 5+ unit buildings).
Forward outlook
- In year one you build about $2k of equity ($933 loan paydown + $697 appreciation (0.5% local appreciation)).
- Stark County population projected to shrink 8% by 2050 — rents likely to lag national; underwrite the cash flow, not the appreciation.
Negotiation context
- Only 4 days on market — expect competitive offers; lowballing is unlikely to land.
Risks & watch-outs
- Watch-outs: built in 1914 — expect roof / HVAC / electrical / plumbing capex.
Questions for the listing agent
- What do current leases actually rent for vs. the listed asking? Can we see a recent rent roll and the last 12 months of T-12 income?
- Built in 1914 — when were the roof, HVAC, electrical panel, plumbing, and water heater last replaced?
- Is there a deadline driving the sale (1031 exchange, divorce, estate, relocation)? That informs how much negotiation room exists.
- Schools are F-rated, which usually means shorter tenancies and higher turnover. Who's the typical renter profile here, and what's been the actual vacancy rate?
- What's the average days-on-market for RENTAL listings here right now (not sales)? A rising rental-DOM trend means longer vacancies and softer asking-rent achievability than the comps imply.
- What's the recent tenant-quality profile in this submarket — average credit score on applications, eviction rate, late-payment / NSF rate, and stable-employment percentage? A property-management company in the area should have these aggregated.
- How much new for-sale + rental construction is in the pipeline within 1–3 miles? Heavy new supply typically softens prices + rents 12–24 months out; constrained supply supports both.
Investment metrics
- 1% rule
- 0.78% ✗
- Cap rate
- 6.11%
- Cash-on-cash
- -0.66%
- DSCR
- 0.97
- GRM
- 10.7
CMA / ARV
- ARV (on-the-fly)
- $165,060
- Comps found
- 12
Show comp detail 12 sales within ~0.75 mi
| Address | Dist | Beds/Ba | Sqft | Sold | Price | $/sf | Match |
|---|---|---|---|---|---|---|---|
| 418 Jackson Ave NE | 0.00mi | 2/1.0 (-1) | 1,260 (0%) | 1mo | $123,500 | $98 | 94 |
| 323 Wabash Ave N | 0.17mi | 3/1.0 | 1,362 (+8%) | 4mo | $179,000 | $131 | 75 |
| 207 Harmon Ave NE | 0.19mi | 3/1.5 | 1,440 (+14%) | 2mo | $170,000 | $118 | 64 |
| 193 4th St SE | 0.67mi | 3/1.5 | 1,280 (+2%) | 7mo | $172,000 | $134 | 58 |
| 450 Wabash Ave S | 0.74mi | 3/2.0 | 1,225 (-3%) | 8mo | $155,000 | $127 | 50 |
| 345 Wabash Ave S | 0.68mi | 3/1.0 | 1,386 (+10%) | 3mo | $96,000 | $69 | 49 |
| 688 Muskingum Ave NW | 0.46mi | 4/2.0 (+1) | 1,213 (-4%) | 19mo | $244,000 | $201 | 47 |
| 383 2nd St SE | 0.55mi | 3/2.0 | 1,127 (-11%) | 8mo | $150,000 | $133 | 46 |
| 283 Main St SW | 0.68mi | 3/1.5 | 1,390 (+10%) | 7mo | $175,000 | $126 | 44 |
| 100 Grant St SW | 0.73mi | 3/2.0 | 1,296 (+3%) | 18mo | $148,900 | $115 | 42 |
| 325 Main St SW | 0.71mi | 4/2.0 (+1) | 1,336 (+6%) | 10mo | $240,000 | $180 | 40 |
| 320 Main St SW | 0.73mi | 3/1.0 | 1,092 (-13%) | 6mo | $177,100 | $162 | 39 |
Match score weights: distance 35% · size 25% · config 20% · recency 20%. Top-matched comps best support the ARV.
Projected returns pro-forma
0.52% appreciation · 3.0% rent growth · sell at horizon
- IRR
- -1.1%
- Equity multiple
- 0.95×
- Total profit
- $-2,001
- Equity at exit
- $42,720
- IRR
- 4.1%
- Equity multiple
- 1.47×
- Total profit
- $17,942
- Equity at exit
- $54,253
Cash invested: $37,800 (down + closing). Projections, not guarantees.
Landlord ↔ Tenant lean methodology
- Overall (STATE)
- 73 Landlord-Friendly
- State Ohio
- 73 Landlord-Friendly · R+6
- County
- — inherits STATE
- City
- — inherits STATE
ZIP-level market 44613
- Home prices YoY
- 0.3%
- Active inventory
- 9
- Price-to-rent
- 10.7×
Monthly cashflow live
- Estimated rent
- $1,050 medium interval (Pro) →
- Mortgage (P&I)
- −$708
- Tax from tax record
- −$86 /mo · $1,033/yr
- Insurance
- −$56
- HOA
- −$0
- Vacancy / Maint / Mgmt
- −$220
- Net cashflow
- $-21
Break-even live
Sensitivity live
| Price | -10% $56 | -5% $17 | +0% $-21 | +5% $-59 | +10% $-97 |
|---|---|---|---|---|---|
| Rent | -10% $-104 | -5% $-62 | +0% $-21 | +5% $21 | +10% $62 |
| Rate | -1.0pp $47 | -0.5pp $14 | base $-21 | +0.5pp $-56 | +1.0pp $-91 |
UW: 25.0% down · 7.5% · 30yr · 1.5% tax · 5.0% vac · 8.0% maint · 8.0% mgmt
Financing live
Cash to close
- Down payment
- $33,750
- Closing costs
- $4,050
- Reserves months
- —
- Total cash needed
- —
Loan-product check · same deal, 3 products live
Conventional
25% down · 7.5% · 30yr
- Down + closing
- —
- Monthly P&I
- —
- Monthly cashflow
- —
- DSCR
- —
- Eligible?
- —
Personal DTI + credit; lowest rate.
DSCR
20% down · 8.5% · 30yr
- Down + closing
- —
- Monthly P&I
- —
- Monthly cashflow
- —
- DSCR
- —
- Eligible?
- —
No personal income docs; deal must DSCR.
Hard money
10% down · 12.0% · 12mo
- Down + closing
- —
- Monthly P&I
- —
- Monthly cashflow
- —
- DSCR
- —
- Eligible?
- —
Short-term bridge; refi at stabilization.
Rent comps 1 comps
| Address | Beds | Baths | Sqft | Rent | $/sqft | DOM | Units | Dist |
|---|---|---|---|---|---|---|---|---|
| 222 Washington Ave SW Brewster, OH | 2.0 | 1.0 | 1016 | $1,050 | $1.03 | 15d | 1 | 0.64mi |
Listing history 2 events
-
2026-04-27status Pending
-
2026-04-22$135,000 Active
ⓘ Source: listings_history table (triggers on properties + properties_extension) + one-shot
backfill from property_details.listing_events for pre-trigger history.
Tax reassessment forecast OH · Partial reset (capped growth)
- Current annual tax
- $1,033 · $86/mo
- Projected year-2 tax
- $1,570 · $131/mo
- Expected delta
- +$536/yr (+$45/mo · 51.9%)
ⓘ Screening estimate from a state-policy table — verify with the county assessor before closing.
Climate risk First Street
- Flood 1/10 Low FEMA zone X (unshaded) · 0% chance over 30 yrs
- Wildfire 1/10 Low
- Heat 3/10 Moderate 7 d/yr ≥97°F today · 17 d/yr by 30 yrs out
- Wind 1/10 Low
- Air quality 2/10 Low 0 unhealthy d/yr today · 1 by 30 yrs out
Nearby sold comps map
Loading sold comps map…
Walkable amenities ~0.75 mi
Loading nearby amenities…
Taxation est. · year 1
- Rental income
- $12,600
- − Mortgage interest
- −$7,562
- − Property taxes
- −$1,033
- − Insurance
- −$675
- − Repairs & maintenance
- −$1,008
- − Management
- −$1,008
- − Depreciation
- −$3,927
- Taxable loss
- −$2,614
- Est. tax savings @ 24.0%
- +$627
- After-tax cash flow
- $377/yr
For passive investors: Depreciation is non-cash, so a rental often shows a tax loss while cash-flowing — sheltering income. Rental losses are passive: they offset passive income freely, and up to $25,000/yr can offset ordinary (W-2) income if you actively participate and your MAGI is under $100k (phasing out to $0 by $150k); unused losses carry forward. On sale, claimed depreciation is recaptured at up to 25%, and gains may owe capital-gains tax (a 1031 exchange can defer both). Figures are a year-1 estimate at your 24.0% rate — not tax advice; consult a CPA.
Schools (NCES district)
- District
- Fairless Local
- NCES district ID
- 3904984
- Math proficiency
- 56% ▼ -6.00%
- Reading proficiency
- 55% ▼ -7.00%
- Median HH income
- $46,217
- Composite
- 46.99/100
- National rank
- #2352
- State rank
- #365 of 656 in OH
Livability — Brewster
- Score
- 65/100
- State rank
- #742
- US rank
- #13369
Category grades
Schools grade is shown separately in the Schools card above.
Census & demographics
- Census place
- Brewster, OH
- County
- Stark · 366,688 people
- City population
- 1,988
- Metro
- Canton-Massillon, OH
- Population (ZIP)
- 1,988
- Household income
- $57,318
- Rent vs Own
- Severe rent burden
- 4.9
Population outlook (Stark County) Hauer SSP2
- Today (2025)
- 373,708 people
- By 2030
- 371,245 · -0.7%
- By 2040
- 361,331 · -3.3%
- By 2050
- 345,290 · -7.6%
- By 2075
- 302,669 · -19.0%
- By 2100
- 238,870 · -36.1%
Race, ethnicity, and origin ACS 2023
- Neighborhood character
- Predominantly White (97%)
- Race & ethnicity
- White 97% Two or more races 2% Black 1%
- Common ancestry
- Lithuanian 3% Scandinavian 3% Romanian 2%
- Foreign-born
- 0%
- Languages at home
- 98% English-only · German/W. Germanic 1% Spanish 1%
Political lean MEDSL · Stark
- 2024 margin
- Strong R (+21.9) · D 38.6% · R 60.5%
- 2008→2024 swing
- -27.4pp toward R · 2008: 5.5pp · 2024: -21.9pp
- All cycles
- 2024: R+21.9 2020: R+18.5 2016: R+17.4 2012: R+0.4 2008: D+5.5
Not yet ingested
- Civics
- —
Market trends
- HPI YoY
- ▲ 0.52%
- Current HPI
- 190.4012
- Rent YoY
- —
- Metro
- —
- State GDP YoY
- ▲ 1.98%
- F500 in state
- 48
Industry mix (Fortune 500 HQ in OH)
| Industry | F500 HQs | Revenue |
|---|---|---|
| Insurance | 3 | $145B |
|
||
| Industrial Machinery | 3 | $49B |
|
||
| Financial Services | 3 | $24B |
|
||
| Consumer Goods | 2 | $93B |
|
||
| Aerospace / Defense | 2 | $47B |
|
||
| Utilities | 2 | $33B |
|
||
Price history
2 events — show timeline
- 2026-04-27 Pending — MLSNOW
- 2026-04-22 Listed $135,000 MLSNOW
Property tax history
+2.3%/yrLatest (2024): $1,033 · +15.1% YoY. Source: county tax records.
Cash-flow waterfall
monthlySold comps — $/sqft
last 12 mo · ≤1 miLoading sold comps…