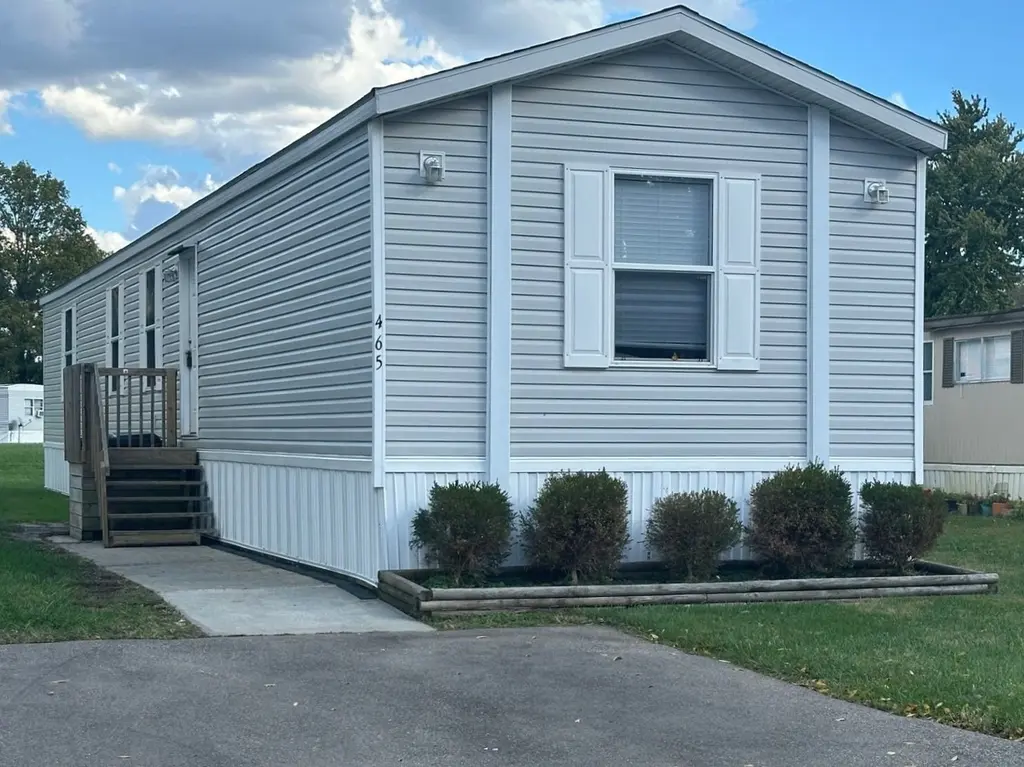
465 Cambridge Dr #465 · Sharonville, OH
Flood risk 1/10 · Minimal
- FEMA flood zone
- X (unshaded)
- Chance of flooding over 30 yrs
- 0.0%
- Est. flood insurance / yr
- $507 – $1,088
Fire risk 1/10 · Minimal
- Est. fire insurance / yr
- $713 – $1,323
Heat risk 4/10 · Minor
- Hot days now (above 102°F)
- 7 days/yr
- Hot days in 30 yrs
- 19 days/yr
Wind risk 2/10 · Minimal
- Chance of severe wind over 30 yrs
- 1.0%
Air-quality risk 3/10 · Minor
- Unhealthy air days now
- 2 days/yr
- Unhealthy air days in 30 yrs
- 4 days/yr
Risk factors via First Street. Map © Google.
Why this score? — see what drove the D+ grade
The composite is a weighted blend of 9 inputs, each scored 0–100. Each bar is that input's sub-score; the figure is the points it added to the 100-point composite (weight × sub-score).
- Cash flow +15.0/30.0
- ARV discount +7.5/15.0
- 1% rule +5.0/10.0
- DSCR +5.0/10.0
- Livability +3.9/5.0
- Schools +3.4/10.0
- Condition / age +2.8/5.0
- Rent growth +2.5/5.0
- Appreciation +0.0/10.0
$47,600
🖨 Deal sheet 📄 Offer letter ✓ Due diligence
Listing remarks MLS
* THIS IS A RESALE LISTING * You'll love living in this 3 bedroom, 2 bathroom home within a wonderful family-friendly community. Check out the awesome amenities your community has to offer such as community events, a basketball court, a swimming pool, and more! This home won't be on the market long, so call us today for more information or to schedule a tour. Deposits & Fees are subject to change.
Key facts
- Swimming pool
- Basketball court
- Built 2026
Tags
Neighborhood map
What this means for you Summary
Snapshot
- This is a 3-bed/2.0-bath manufactured listed at $48k. Condition is rated average.
Deal economics
- At list price, monthly cash flow is $1k ($17k/yr) — positive.
- The deal already cash-flows at list — no discount required.
- Meets the 1% rule at list price ($2k rent vs $48k).
- Recommended offer: $45k (6.0% below list) — sets the bar for market timing.
- Cap rate 42.5% vs local median 4.2% in Sharonville — top-decile yield for the area; either an underpriced asset or a hidden risk that comps aren't pricing in. Stress-test before assuming the spread holds.
Location & tenants
- Location reads 78/100 on livability (#160 in OH, #2,399 nationally) — a middle-class / working-renter tenant base. Strengths: cost of living A+, housing A+, schools A-; Watch: health & safety C-, amenities D, commute F.
- Princeton City (suburban): math 34% / reading 43% proficiency, ranked #542 of 656 in OH (top 83%) — families likely to look elsewhere, expect single-tenant / working-renter base with shorter leases.
- Market conditions: 29 active listings in the ZIP; 5 comparable units currently listed for rent nearby; rentals leasing fast (median 2d on market — plan ~1-2 weeks tenant-placement turnaround); solid renter incomes; 1,163 units permitted in Butler County in 2024 (356 in 5+ unit buildings).
Forward outlook
- Local home prices are declining (-3.0%/yr); year-one equity from $329 of loan paydown is wiped out by about $1k of value loss. Plan a longer hold.
- At projected returns (-3.0% appreciation + 3.0% rent growth), your $13k cash investment doubles in ~1 year — after that, you're playing with house money.
Negotiation context
- It's been on market 73 days — a 6% lower offer ($45k) is reasonable based on typical stale-listing flexibility.
Questions for the listing agent
- It's been on market 73 days. Have you received any prior offers? Is the seller open to a 6% concession, seller financing, or rate buy-down credit?
- Why hasn't it sold? Are there any deal-killer items the seller is aware of (foundation, flood, title, zoning, code violations)?
- Is there a deadline driving the sale (1031 exchange, divorce, estate, relocation)? That informs how much negotiation room exists.
- Schools are A-rated — typically a magnet for longer-tenancy family renters. What's the average tenant stay here, and is there a school-zone premium baked into asking?
- The area grade is low — what's the realistic commute time and amenity access for the typical tenant pool here? Any planned neighborhood developments (good or bad) we should know about?
- What's the average days-on-market for RENTAL listings here right now (not sales)? A rising rental-DOM trend means longer vacancies and softer asking-rent achievability than the comps imply.
- What's the recent tenant-quality profile in this submarket — average credit score on applications, eviction rate, late-payment / NSF rate, and stable-employment percentage? A property-management company in the area should have these aggregated.
- How much new for-sale + rental construction is in the pipeline within 1–3 miles? Heavy new supply typically softens prices + rents 12–24 months out; constrained supply supports both.
Investment metrics
- 1% rule
- 4.70% ✓
- Cap rate
- 42.54%
- Cash-on-cash
- 129.45%
- DSCR
- 6.76
- GRM
- 1.8
CMA / ARV
No comps found within radius.
Projected returns pro-forma
-3.0% appreciation · 3.0% rent growth · sell at horizon
- IRR
- —
- Equity multiple
- 7.29×
- Total profit
- $83,889
- Equity at exit
- $7,097
- IRR
- —
- Equity multiple
- 15.34×
- Total profit
- $191,095
- Equity at exit
- $4,116
Cash invested: $13,328 (down + closing). Projections, not guarantees.
Landlord ↔ Tenant lean methodology
- Overall (STATE)
- 73 Landlord-Friendly
- State Ohio
- 73 Landlord-Friendly · R+6
- County
- — inherits STATE
- City
- — inherits STATE
ZIP-level market 45241
- Active inventory
- 29
- Price-to-rent
- 1.8×
Monthly cashflow live
- Estimated rent
- $2,236 high interval (Pro) →
- Mortgage (P&I)
- −$250
- Tax est. 1.5%
- −$60 /mo · $714/yr
- Insurance
- −$20
- HOA
- −$0
- Vacancy / Maint / Mgmt
- −$470
- Net cashflow
- $1,438
Break-even live
UW: 25.0% down · 7.5% · 30yr · 1.5% tax · 5.0% vac · 8.0% maint · 8.0% mgmt
Financing live
Cash to close
- Down payment
- $11,900
- Closing costs
- $1,428
- Reserves months
- —
- Total cash needed
- —
Loan-product check · same deal, 3 products live
Conventional
25% down · 7.5% · 30yr
- Down + closing
- —
- Monthly P&I
- —
- Monthly cashflow
- —
- DSCR
- —
- Eligible?
- —
Personal DTI + credit; lowest rate.
DSCR
20% down · 8.5% · 30yr
- Down + closing
- —
- Monthly P&I
- —
- Monthly cashflow
- —
- DSCR
- —
- Eligible?
- —
No personal income docs; deal must DSCR.
Hard money
10% down · 12.0% · 12mo
- Down + closing
- —
- Monthly P&I
- —
- Monthly cashflow
- —
- DSCR
- —
- Eligible?
- —
Short-term bridge; refi at stabilization.
Rent comps 5 comps
| Address | Beds | Baths | Sqft | Rent | $/sqft | DOM | Units | Dist |
|---|---|---|---|---|---|---|---|---|
| 10135 Crossing Dr Cincinnati, OH | 1.0–3.0 | 1.0–2.0 | 1020 | $2,295 | $2.25 | 1d | 7 | 0.26mi |
| 12121 3rd Ave Cincinnati, OH | 3.0 | 1.0 | 900 | $1,800 | $2.00 | 17d | 1 | 0.37mi |
| 8075 Somerset Chase Cincinnati, OH | 1.0–3.0 | 1.0–2.5 | 1385 | $3,422 | $2.47 | 1d | 6 | 1.15mi |
| 11600 Grooms Rd Cincinnati, OH | 3.0 | 1.0–2.0 | 958 | $3,003 | $3.13 | 1d | 92 | 1.24mi |
| 11600 Timber Ridge Ln Cincinnati, OH | 1.0–2.0 | 1.0 | 800 | $1,370 | $1.71 | 3d | 7 | 1.27mi |
Listing history 12 events
-
2026-06-15days on market $47,600 Active 73 DOM
-
2026-06-13days on market $47,600 Active 71 DOM
-
2026-06-13days on market $47,600 Active 70 DOM
-
2026-06-09days on market $47,600 Active 68 DOM
-
2026-06-08days on market $47,600 Active 67 DOM
-
2026-06-07days on market $47,600 Active 66 DOM
-
2026-06-05days on market $47,600 Active 63 DOM
-
2026-06-03days on market $47,600 Active 62 DOM
-
2026-06-02days on market $47,600 Active 61 DOM
-
2026-06-01pricedays on market $47,600 Active 60 DOM
-
2026-05-31days on market $47,100 Active 59 DOM
-
2026-04-02$47,100 Active 409-char remark
Show marketing remark (409 chars)
* THIS IS A RESALE LISTING * You'll love living in this 3 bedroom, 2 bathroom home within a wonderful family-friendly community. Check out the awesome amenities your community has to offer such as community events, a basketball court, a swimming pool, and more! This home won't be on the market long, so call us today for more information or to schedule a tour. Deposits & Fees are subject to change.
ⓘ Source: listings_history table (triggers on properties + properties_extension) + one-shot
backfill from property_details.listing_events for pre-trigger history.
Climate risk First Street
- Flood 1/10 Low FEMA zone X (unshaded) · 0% chance over 30 yrs
- Wildfire 1/10 Low
- Heat 4/10 Moderate 7 d/yr ≥102°F today · 19 d/yr by 30 yrs out
- Wind 2/10 Low 100% chance of damaging wind over 30 yrs
- Air quality 3/10 Moderate 2 unhealthy d/yr today · 4 by 30 yrs out
Nearby sold comps map
Loading sold comps map…
Walkable amenities ~0.75 mi
Loading nearby amenities…
Taxation est. · year 1
- Rental income
- $26,835
- − Mortgage interest
- −$2,666
- − Property taxes
- −$714
- − Insurance
- −$238
- − Repairs & maintenance
- −$2,147
- − Management
- −$2,147
- − Depreciation
- −$1,385
- Taxable income
- $17,539
- Est. tax owed @ 24.0%
- −$4,209
- After-tax cash flow
- $13,043/yr
For passive investors: Depreciation is non-cash, so a rental often shows a tax loss while cash-flowing — sheltering income. Rental losses are passive: they offset passive income freely, and up to $25,000/yr can offset ordinary (W-2) income if you actively participate and your MAGI is under $100k (phasing out to $0 by $150k); unused losses carry forward. On sale, claimed depreciation is recaptured at up to 25%, and gains may owe capital-gains tax (a 1031 exchange can defer both). Figures are a year-1 estimate at your 24.0% rate — not tax advice; consult a CPA.
Condition & rehab AI · 1 photo
This manufactured home is in average condition with some minor repairs needed, particularly to the interior walls and landscaping. Simple updates like fresh paint and landscaping can significantly enhance its resale and rental value.
Repairs flagged
- Minor interior walls/paint — Some minor wear is visible on the interior walls.
- Minor landscaping — The landscaping could be improved to enhance curb appeal.
Value-add opportunities
- Resale paint interior walls — Fresh paint can make a significant difference in the home's appearance and appeal.
- Rental landscaping — A well-maintained and attractive exterior can attract more renters and increase rental value.
Renovation cost estimate screening
| Repair item | Severity | Est. cost |
|---|---|---|
| interior walls/paint · Some minor wear is visible on the interior walls. | Minor | $500–3,000 |
| landscaping · The landscaping could be improved to enhance curb appeal. | Minor | $500–3,000 |
| Total estimated repair cost · 2 items | $1,000–6,000 |
Value-add ROI direction
- Resale paint interior walls — Fresh paint can make a significant difference in the home's appearance and appeal. ↑
- Rental landscaping — A well-maintained and attractive exterior can attract more renters and increase rental value. ↑
ⓘ Cost ranges are severity-bucket heuristics (US national rule-of-thumb). Get contractor quotes + a written scope before underwriting a rehab budget.
Schools (NCES district)
- District
- Princeton City
- NCES district ID
- 3904467
- Math proficiency
- 34% ▼ -18.00%
- Reading proficiency
- 43% ▼ -8.00%
- Median HH income
- $53,182
- Composite
- 33.52/100
- National rank
- #5436
- State rank
- #542 of 656 in OH
Livability — Sharonville
- Score
- 78/100
- State rank
- #160
- US rank
- #2399
Category grades
Schools grade is shown separately in the Schools card above.
Census & demographics
- Census place
- Sharonville, OH
- County
- Hamilton County · 701,295 people
- City population
- 23,955
- Metro
- Cincinnati, OH-KY-IN
- Population (ZIP)
- 23,955
- Household income
- $103,585
- Rent vs Own
- Severe rent burden
- 607.0
Population outlook (Butler County) Hauer SSP2
- Today (2025)
- 387,706 people
- By 2030
- 392,028 · +1.1%
- By 2040
- 395,307 · +2.0%
- By 2050
- 391,116 · +0.9%
- By 2075
- 378,642 · -2.3%
- By 2100
- 343,248 · -11.5%
Race, ethnicity, and origin ACS 2023
- Neighborhood character
- Predominantly White (78%)
- Race & ethnicity
- White 78% Hispanic / Latino 6% Two or more races 6% Black 6% Asian 4%
- Hispanic origin (detail)
- Mexican 5%
- Common ancestry
- Slovak 2% Italian 2% Romanian 2%
- Foreign-born
- 8% · Canada, China, South Korea
- Languages at home
- 88% English-only · Spanish 4% Other Asian/Pacific 2% Chinese 1%
Political lean MEDSL · Butler
- 2024 margin
- Strong R (+26.3) · D 36.4% · R 62.7%
- 2008→2024 swing
- -3.6pp toward R · 2008: -22.6pp · 2024: -26.3pp
- All cycles
- 2024: R+26.3 2020: R+24.0 2016: R+28.3 2012: R+26.2 2008: R+22.6
Not yet ingested
- Civics
- —
Market trends
- HPI YoY
- ▼ -203.33%
- Current HPI
- 238.3124
- Rent YoY
- —
- Metro
- Cincinnati, OH-KY-IN
- State GDP YoY
- ▲ 1.98%
- F500 in state
- 48
Industry mix (Fortune 500 HQ in OH)
| Industry | F500 HQs | Revenue |
|---|---|---|
| Insurance | 3 | $145B |
|
||
| Industrial Machinery | 3 | $49B |
|
||
| Financial Services | 3 | $24B |
|
||
| Consumer Goods | 2 | $93B |
|
||
| Aerospace / Defense | 2 | $47B |
|
||
| Utilities | 2 | $33B |
|
||
Price history
1 event — show timeline
- 2026-04-02 Listed $47,100 Zillow
Cash-flow waterfall
monthlySold comps — $/sqft
last 12 mo · ≤1 miLoading sold comps…