 Triplex
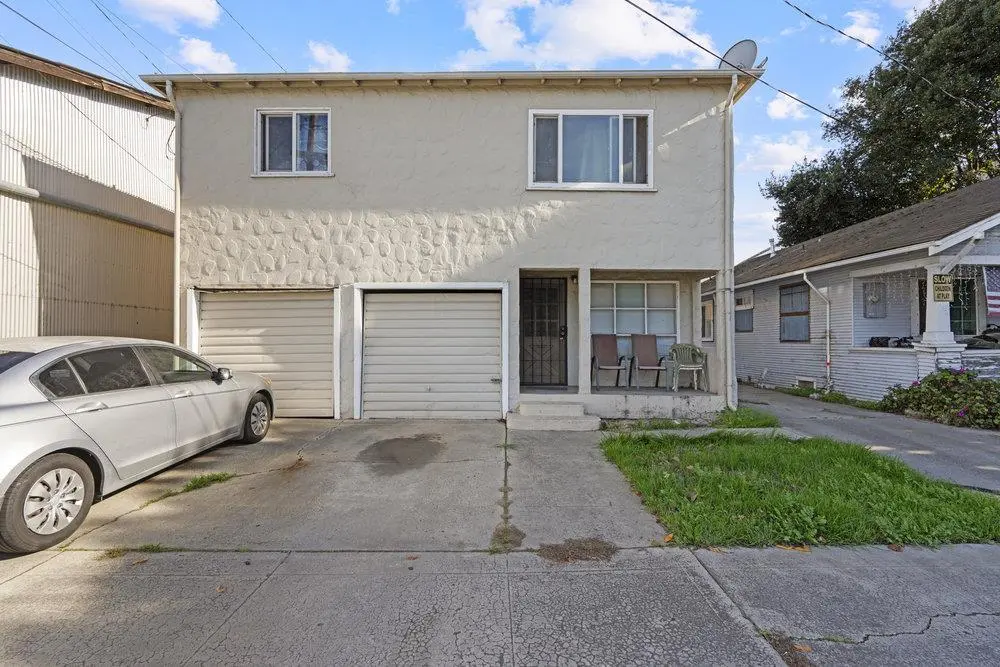
713 Sally St · Hollister, CA
Flood risk 1/10 · Minimal
- FEMA flood zone
- X (unshaded)
- Chance of flooding over 30 yrs
- 0.0%
- Est. flood insurance / yr
- $507 – $1,088
Fire risk 2/10 · Minimal
- Est. fire insurance / yr
- $659 – $1,223
Heat risk 4/10 · Minor
- Hot days now (above 93°F)
- 6 days/yr
- Hot days in 30 yrs
- 12 days/yr
Wind risk 1/10 · Minimal
- Chance of severe wind over 30 yrs
- —
Air-quality risk 8/10 · Major
- Unhealthy air days now
- 16 days/yr
- Unhealthy air days in 30 yrs
- 17 days/yr
Risk factors via First Street. Map © Google.
Why this score? — see what drove the C- grade
The composite is a weighted blend of 9 inputs, each scored 0–100. Each bar is that input's sub-score; the figure is the points it added to the 100-point composite (weight × sub-score).
- Cash flow +21.4/30.0
- ARV discount +7.5/15.0
- DSCR +6.8/10.0
- 1% rule +5.6/10.0
- Schools +4.0/10.0
- Rent growth +3.4/5.0
- Livability +3.4/5.0
- Condition / age +2.5/5.0
- Appreciation +0.0/10.0
$735,000
🖨 Deal sheet 📄 Offer letter ✓ Due diligence
Multi-family units
County records classify this as Multi-Family (2-4 Unit). Listing-text estimate: 3 units. confirmed
Listing remarks MLS
Investor opportunity in Hollister! This property located at 713 Sally Street offers potential for those looking to renovate and add value. The property consists of three units, with two currently occupied. The third unit was recently vacated when they found out the property was up for sale. The property is in poor condition and will require repairs and updates, making it ideal for investors, contractors, or buyers seeking a project with upside potential. The financials in this listing are using current taxes and do not include rent from the vacant unit.
Key facts
- Three units
- Investor opportunity
- 4,950 sq ft lot
Tags
Property features AI
Finance
- Other: Living area reported as 2,784; Property primary ID 741729
- Financial info: Annual rental income: $34,200; Annual gross income: $34,200; Gross scheduled income: $34,200; Gross rent multiplier: 21.49; Total expenses: $17,674; Utility expenses: $5,040; Annual tax amount: $10,884; Unit rents listed: Unit 1 rent $1,350; Unit 3 rent $1,500
Exterior
- Parking: Attached garage; On-street parking available; Additional parking area; Two garage spaces
- Utilities: Public water; Public sewer; Public utilities; Separate gas meters
- Home design: Two-story building; Three total units; Two buildings on the property
- Construction: Concrete slab foundation
- Exterior features: Shingle roof; Neighborhood mixed-use zoning; Tenant pays trash removal and utilities for gas and electric
Interior
- Bedrooms: Unit 1: 2 bedrooms; Unit 2: 2 bedrooms; Unit 3: 3 bedrooms
- Bathrooms: Unit 1: 1 full bathroom; Unit 2: 1 full bathroom; Unit 3: 1 full bathroom and 1 half bathroom
- Heating & cooling: Central forced-air gas heating
- Interior features: Parking available
Neighborhood map
What this means for you Summary
Snapshot
- This is a 3 × 2-bed/1.2-bath units multifamily listed at $735k.
Deal economics
- At list price, monthly cash flow is $1k ($13k/yr) — positive. Per door: $362/mo.
- The deal already cash-flows at list — no discount required.
- Meets the 1% rule at list price ($8k rent vs $735k).
- Recommended offer: $691k (6.0% below list) — sets the bar for market timing.
- Cap rate 8.1% vs local median 3.0% in Hollister — top-decile yield for the area; either an underpriced asset or a hidden risk that comps aren't pricing in. Stress-test before assuming the spread holds.
Location & tenants
- Location reads 68/100 on livability (#288 in CA) — a middle-class / working-renter tenant base. Strengths: amenities A+, health & safety A+, employment A-; Watch: commute F, cost of living F.
- San Benito High (town): math 29% / reading 55% proficiency, ranked #593 of 1,400 in CA (top 42%) — families likely to look elsewhere, expect single-tenant / working-renter base with shorter leases.
- Market conditions: Rents rising (+3.4%/yr); 277 active listings in the ZIP; 1 comparable units currently listed for rent nearby; high-income renter base; 281 units permitted in San Benito County in 2024 (0 in 5+ unit buildings).
- At $7,808/mo this rent would consume 81% of the median local household income ($116k/yr) (locally 1352% of renters already pay >50% of income on rent) — very limited rent-growth headroom before tenants either downsize or default.
Forward outlook
- Local home prices are declining (-3.0%/yr); year-one equity from $5k of loan paydown is wiped out by about $22k of value loss. Plan a longer hold.
- San Benito County population projected at +18% by 2050 — long-run rental-demand tailwind backs the buy-and-hold thesis.
Negotiation context
- It's been on market 88 days — a 6% lower offer ($691k) is reasonable based on typical stale-listing flexibility.
- 4 sale attempts; this cycle's ask has dropped $50k (6%) from the opening price — seller is motivated, your offer sets the floor, not the list.
- Current owner paid $350k; list at $735k implies a 110% gain — meaningful room to come down on a strong offer.
Risks & watch-outs
- Watch-outs: built in 1950 — expect roof / HVAC / electrical / plumbing capex.
Questions for the listing agent
- It's been on market 88 days. Have you received any prior offers? Is the seller open to a 6% concession, seller financing, or rate buy-down credit?
- Can we see the unit-by-unit rent roll, current vacancy, and any below-market leases? What's the average tenancy length?
- What capital expenditures (roof, boiler, parking lot, exteriors) have been made in the last 5 years, and what's planned in the next 2?
- Built in 1950 — when were the roof, HVAC, electrical panel, plumbing, and water heater last replaced?
- Why hasn't it sold? Are there any deal-killer items the seller is aware of (foundation, flood, title, zoning, code violations)?
- Is there a deadline driving the sale (1031 exchange, divorce, estate, relocation)? That informs how much negotiation room exists.
- What's the average days-on-market for RENTAL listings here right now (not sales)? A rising rental-DOM trend means longer vacancies and softer asking-rent achievability than the comps imply.
- What's the recent tenant-quality profile in this submarket — average credit score on applications, eviction rate, late-payment / NSF rate, and stable-employment percentage? A property-management company in the area should have these aggregated.
- How much new apartment / multifamily construction is in the pipeline within 1–3 miles? Heavy new supply (>2% of stock underway) typically softens rents 12–24 months out; light construction supports rent growth.
Investment metrics
- 1% rule
- 1.06% ✓
- Cap rate
- 8.06%
- Cash-on-cash
- 6.33%
- DSCR
- 1.28
- GRM
- 7.8
CMA / ARV
No comps found within radius.
Projected returns pro-forma
-3.0% appreciation · 3.43% rent growth · sell at horizon
- IRR
- -6.1%
- Equity multiple
- 0.77×
- Total profit
- $-46,474
- Equity at exit
- $109,591
- IRR
- 4.1%
- Equity multiple
- 1.31×
- Total profit
- $63,058
- Equity at exit
- $63,549
Cash invested: $205,800 (down + closing). Projections, not guarantees.
Landlord ↔ Tenant lean methodology
- Overall (STATE)
- 18 Strongly Tenant-Friendly
- State California
- 18 Strongly Tenant-Friendly · D+13
- County
- — inherits STATE
- City
- — inherits STATE
ZIP-level market 95023
- Rents YoY
- 3.4%
- Active inventory
- 277
- Price-to-rent
- 23.5×
Monthly cashflow live
- Estimated rent
- $7,808 medium interval (Pro) →
- Mortgage (P&I)
- −$3,854
- Tax from tax record
- −$922 /mo · $11,070/yr
- Insurance
- −$306
- HOA
- −$0
- Vacancy / Maint / Mgmt
- −$1,640
- Net cashflow
- $1,085
Break-even live
3-unit breakdown (identical units grouped — click to expand)
| Units | Beds | Baths | Est. rent |
|---|---|---|---|
| 3× units | 2 | 1.2 | $7,809 |
| #1 | 2 | 1.2 | $2,603 |
| #2 | 2 | 1.2 | $2,603 |
| #3 | 2 | 1.2 | $2,603 |
| Total (3 units) | $7,808 | ||
UW: 25.0% down · 7.5% · 30yr · 1.5% tax · 5.0% vac · 8.0% maint · 8.0% mgmt
Financing live
Cash to close
- Down payment
- $183,750
- Closing costs
- $22,050
- Reserves months
- —
- Total cash needed
- —
Loan-product check · same deal, 3 products live
Conventional
25% down · 7.5% · 30yr
- Down + closing
- —
- Monthly P&I
- —
- Monthly cashflow
- —
- DSCR
- —
- Eligible?
- —
Personal DTI + credit; lowest rate.
DSCR
20% down · 8.5% · 30yr
- Down + closing
- —
- Monthly P&I
- —
- Monthly cashflow
- —
- DSCR
- —
- Eligible?
- —
No personal income docs; deal must DSCR.
Hard money
10% down · 12.0% · 12mo
- Down + closing
- —
- Monthly P&I
- —
- Monthly cashflow
- —
- DSCR
- —
- Eligible?
- —
Short-term bridge; refi at stabilization.
Rent comps 1 comps
| Address | Beds | Baths | Sqft | Rent | $/sqft | DOM | Units | Dist |
|---|---|---|---|---|---|---|---|---|
| 521 Spring Dr Hollister, CA | 6.0 | 4.0 | 2470 | $3,200 | $1.30 | 11d | 1 | 0.95mi |
Listing history 23 events
-
2026-06-18days on market $735,000 Active 88 DOM
-
2026-06-17days on market $735,000 Active 87 DOM
-
2026-06-16days on market $735,000 Active 86 DOM
-
2026-06-15days on market $735,000 Active 85 DOM
-
2026-06-13days on market $735,000 Active 83 DOM
-
2026-06-13days on market $735,000 Active 82 DOM
-
2026-06-09days on market $735,000 Active 79 DOM
-
2026-06-08days on market $735,000 Active 78 DOM
-
2026-06-07days on market $735,000 Active 77 DOM
-
2026-06-05days on market $735,000 Active 74 DOM
-
2026-06-03days on market $735,000 Active 73 DOM
-
2026-06-02days on market $735,000 Active 72 DOM
-
2026-06-01days on market $735,000 Active 71 DOM
-
2026-05-31days on market $735,000 Active 70 DOM
-
2026-05-14status Active 559-char remark
Show marketing remark (559 chars)
Investor opportunity in Hollister! This property located at 713 Sally Street offers potential for those looking to renovate and add value. The property consists of three units, with two currently occupied. The third unit was recently vacated when they found out the property was up for sale. The property is in poor condition and will require repairs and updates, making it ideal for investors, contractors, or buyers seeking a project with upside potential. The financials in this listing are using current taxes and do not include rent from the vacant unit.
-
2026-05-12status Pending 559-char remark
Show marketing remark (559 chars)
Investor opportunity in Hollister! This property located at 713 Sally Street offers potential for those looking to renovate and add value. The property consists of three units, with two currently occupied. The third unit was recently vacated when they found out the property was up for sale. The property is in poor condition and will require repairs and updates, making it ideal for investors, contractors, or buyers seeking a project with upside potential. The financials in this listing are using current taxes and do not include rent from the vacant unit.
-
2026-05-12status Pending (Do Not Show) 559-char remark
Show marketing remark (559 chars)
Investor opportunity in Hollister! This property located at 713 Sally Street offers potential for those looking to renovate and add value. The property consists of three units, with two currently occupied. The third unit was recently vacated when they found out the property was up for sale. The property is in poor condition and will require repairs and updates, making it ideal for investors, contractors, or buyers seeking a project with upside potential. The financials in this listing are using current taxes and do not include rent from the vacant unit.
-
2026-04-22price $735,000 559-char remark
Show marketing remark (559 chars)
Investor opportunity in Hollister! This property located at 713 Sally Street offers potential for those looking to renovate and add value. The property consists of three units, with two currently occupied. The third unit was recently vacated when they found out the property was up for sale. The property is in poor condition and will require repairs and updates, making it ideal for investors, contractors, or buyers seeking a project with upside potential. The financials in this listing are using current taxes and do not include rent from the vacant unit.
-
2026-03-19$785,000 Active 559-char remark
Show marketing remark (559 chars)
Investor opportunity in Hollister! This property located at 713 Sally Street offers potential for those looking to renovate and add value. The property consists of three units, with two currently occupied. The third unit was recently vacated when they found out the property was up for sale. The property is in poor condition and will require repairs and updates, making it ideal for investors, contractors, or buyers seeking a project with upside potential. The financials in this listing are using current taxes and do not include rent from the vacant unit.
-
2000-07-13soldstatus $350,000
ⓘ Source: listings_history table (triggers on properties + properties_extension) + one-shot
backfill from property_details.listing_events for pre-trigger history.
Tax reassessment forecast CA · Resets to sale price
- Current annual tax
- $11,070 · $922/mo
- Projected year-2 tax
- $11,070 · $922/mo
- Expected delta
- $0/yr ($0/mo · 0.0%)
ⓘ Screening estimate from a state-policy table — verify with the county assessor before closing.
Climate risk First Street
- Flood 1/10 Low FEMA zone X (unshaded) · 0% chance over 30 yrs
- Wildfire 2/10 Low
- Heat 4/10 Moderate 6 d/yr ≥93°F today · 12 d/yr by 30 yrs out
- Wind 1/10 Low
- Air quality 8/10 Severe 16 unhealthy d/yr today · 17 by 30 yrs out
Nearby sold comps map
Loading sold comps map…
Walkable amenities ~0.75 mi
Loading nearby amenities…
Taxation est. · year 1
- Rental income
- $93,696
- − Mortgage interest
- −$41,171
- − Property taxes
- −$11,070
- − Insurance
- −$3,675
- − Repairs & maintenance
- −$7,496
- − Management
- −$7,496
- − Depreciation
- −$21,382
- Taxable income
- $1,407
- Est. tax owed @ 24.0%
- −$338
- After-tax cash flow
- $12,684/yr
For passive investors: Depreciation is non-cash, so a rental often shows a tax loss while cash-flowing — sheltering income. Rental losses are passive: they offset passive income freely, and up to $25,000/yr can offset ordinary (W-2) income if you actively participate and your MAGI is under $100k (phasing out to $0 by $150k); unused losses carry forward. On sale, claimed depreciation is recaptured at up to 25%, and gains may owe capital-gains tax (a 1031 exchange can defer both). Figures are a year-1 estimate at your 24.0% rate — not tax advice; consult a CPA.
Schools (NCES district)
- District
- San Benito High
- NCES district ID
- 0634140
- Math proficiency
- 29% ▼ -3.00%
- Reading proficiency
- 55% ▲ 1.00%
- Median HH income
- $69,528
- Composite
- 40.31/100
- National rank
- #7779
- State rank
- #593 of 1400 in CA
Livability — Hollister
- Score
- 68/100
- State rank
- #288
- US rank
- #9766
Category grades
Schools grade is shown separately in the Schools card above.
Census & demographics
- Census place
- Hollister, CA
- County
- San Benito County · 59,889 people
- City population
- 59,889
- Metro
- San Jose-Sunnyvale-Santa Clara, CA
- Population (ZIP)
- 59,889
- Household income
- $116,314
- Rent vs Own
- Severe rent burden
- 1352.0
Population outlook (San Benito County) Hauer SSP2
- Today (2025)
- 65,146 people
- By 2030
- 67,991 · +4.4%
- By 2040
- 72,868 · +11.9%
- By 2050
- 76,832 · +17.9%
- By 2075
- 84,693 · +30.0%
- By 2100
- 85,463 · +31.2%
Race, ethnicity, and origin ACS 2023
- Neighborhood character
- Majority Hispanic (65%)
- Race & ethnicity
- Hispanic / Latino 65% Two or more races 35% White 27% Asian 3% Native American 2%
- Hispanic origin (detail)
- Mexican 58% Puerto Rican 1%
- Common ancestry
- Russian 2% Serbian 1% Lithuanian 1%
- Foreign-born
- 20% · Canada
- Languages at home
- 56% English-only · Spanish 41% Tagalog/Filipino 1% Other Indo-European 1%
Political lean MEDSL · San Benito
- 2024 margin
- D (+12.6) · D 54.9% · R 42.3% · Other 2.8%
- 2008→2024 swing
- -10.2pp toward R · 2008: 22.8pp · 2024: 12.6pp
- All cycles
- 2024: D+12.6 2020: D+24.4 2016: D+20.4 2012: D+17.1 2008: D+22.8
Not yet ingested
- Civics
- —
Market trends
- HPI YoY
- ▼ -532.32%
- Current HPI
- 198.8561
- Rent YoY
- ▲ 3.43%
- Metro
- San Jose-Sunnyvale-Santa Clara, CA
- State GDP YoY
- ▲ 3.21%
- F500 in state
- 116
Industry mix (Fortune 500 HQ in CA)
| Industry | F500 HQs | Revenue |
|---|---|---|
| Technology | 27 | $1,492B |
|
||
| Financial Services | 3 | $174B |
|
||
| Retail | 3 | $44B |
|
||
| Insurance | 3 | $26B |
|
||
| Media / Entertainment | 2 | $115B |
|
||
| Pharmaceuticals / Biotech | 2 | $62B |
|
||
Price history
+110.0% since first listed9 events — show timeline
- 2026-05-14 Relisted — bridgeMLS, Bay East AOR, or Contra Costa AOR
- 2026-05-14 Relisted — MLSListings
- 2026-05-12 Pending — bridgeMLS, Bay East AOR, or Contra Costa AOR
- 2026-05-12 Pending — MLSListings
- 2026-04-22 Price Changed $735,000 bridgeMLS, Bay East AOR, or Contra Costa AOR
- 2026-04-22 Price Changed $735,000 MLSListings
- 2026-03-19 Listed $785,000 MLSListings
- 2026-03-19 Listed $785,000 bridgeMLS, Bay East AOR, or Contra Costa AOR
- 2000-07-13 Sold (Public Records) $350,000 Public Records
Property tax history
+15.3%/yrLatest (2025): $11,070 · +1.7% YoY. Source: county tax records.
Cash-flow waterfall
monthlySold comps — $/sqft
last 12 mo · ≤1 miLoading sold comps…