42636 Mystery Ln · Magnolia, TX
Flood risk No data
- FEMA flood zone
- —
- Chance of flooding over 30 yrs
- —
- Est. flood insurance / yr
- —
Fire risk No data
- Est. fire insurance / yr
- —
Heat risk No data
- Hot days now (above threshold)
- —
- Hot days in 30 yrs
- —
Wind risk No data
- Chance of severe wind over 30 yrs
- —
Air-quality risk No data
- Unhealthy air days now
- —
- Unhealthy air days in 30 yrs
- —
Risk factors via First Street. Map © Google.
Why this score? — see what drove the D- grade
The composite is a weighted blend of 9 inputs, each scored 0–100. Each bar is that input's sub-score; the figure is the points it added to the 100-point composite (weight × sub-score).
- Appreciation +10.0/10.0
- ARV discount +8.4/15.0
- Cash flow +6.0/30.0
- Schools +3.9/10.0
- Livability +3.7/5.0
- Rent growth +2.6/5.0
- Condition / age +2.5/5.0
- 1% rule +1.6/10.0
- DSCR +0.3/10.0
$342,531
🖨 Deal sheet 📄 Offer letter ✓ Due diligence
Listing remarks
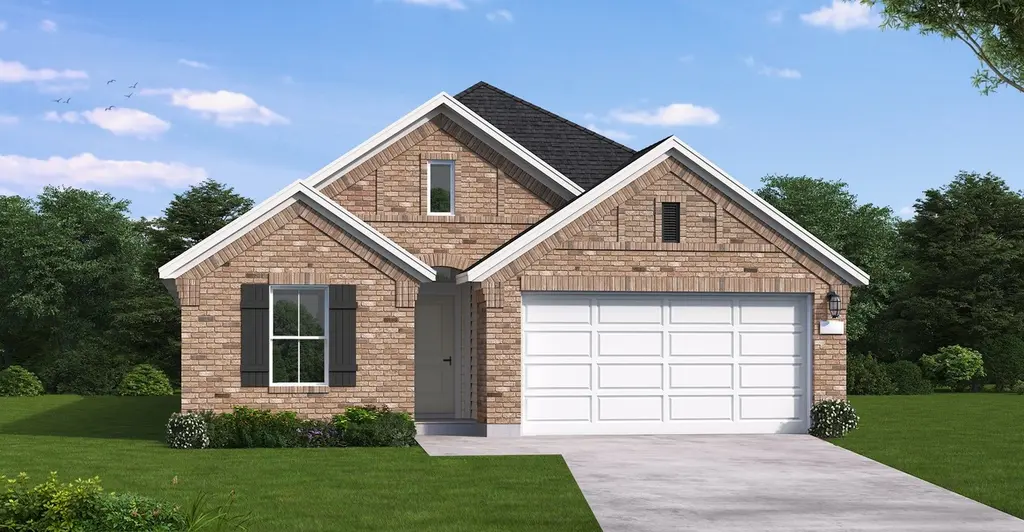
The Gunter floor plan is a thoughtfully designed one-story home featuring four bedrooms and three bathrooms. This layout prioritizes both space and functionality, offering an open-concept design that seamlessly connects the kitchen, dining, and living areas. The primary suite serves as a private retreat, while the additional bedrooms provide versatility for family, guests, or a home office. A three-car tandem garage adds convenience, and the covered outdoor living space enhances the home's appeal, making it an excellent choice for those seeking both comfort and style.
Key facts
- One story home
- Primary suite
- Open concept design
Tags
Property features AI
Finance
- Other: Status: Active; Last modified: 2026-05-30
- Financial info: Listing price $342,531
Exterior
- Parking: 3-car garage / 3 total parking spaces
- Home design: Single-family home (spec); Gunter plan
- Exterior features: Address: 42636 Mystery Ln, Magnolia, TX 77354
Interior
- Bedrooms: 4 bedrooms
- Bathrooms: 3 bathrooms
- Interior features: Spec home (Gunter plan); Living area approximately 2,093
Neighborhood map
What this means for you Summary
Snapshot
- This is a 4-bed/3.0-bath single-family listed at $343k.
Deal economics
- At list price, monthly cash flow is $-660 ($-8k/yr) — negative.
- To cash-flow at today's rent, offer at most $247k (27.9% below list).
- To meet the 1% rule (rent ≥ 1% of price), the offer needs to be $226k (34.1% below list).
- Recommended offer: $226k (34.1% below list) — sets the bar for 1% rule.
Location & tenants
- Location reads 73/100 on livability (#222 in TX) — a middle-class / working-renter tenant base. Strengths: crime A+, cost of living A+, housing A+; Watch: schools D+, amenities F, commute F.
- Magnolia ISD (rural): math 42% / reading 45% proficiency, ranked #247 of 826 in TX (top 30%) — families likely to look elsewhere, expect single-tenant / working-renter base with shorter leases.
- Market conditions: Rents flat; 1604 active listings in the ZIP; high-income renter base; 13,259 units permitted in Montgomery County in 2024 (1,402 in 5+ unit buildings).
Forward outlook
- In year one you build about $37k of equity ($2k loan paydown + $34k appreciation (10.0% local appreciation)).
- Montgomery County population projected at +65% by 2050 — long-run rental-demand tailwind backs the buy-and-hold thesis.
- By year 2, paydown + projected appreciation supports a ~$59k cash-out refi (75% LTV) — recoverable capital for the next deal without selling this one.
Negotiation context
- Only 6 days on market — expect competitive offers; lowballing is unlikely to land.
Questions for the listing agent
- What do current leases actually rent for vs. the listed asking? Can we see a recent rent roll and the last 12 months of T-12 income?
- What does the HOA fee cover, when was the last increase, and are there any pending special assessments or reserve-fund shortfalls?
- Is there a deadline driving the sale (1031 exchange, divorce, estate, relocation)? That informs how much negotiation room exists.
- Schools are D-rated, which usually means shorter tenancies and higher turnover. Who's the typical renter profile here, and what's been the actual vacancy rate?
- The area grade is low — what's the realistic commute time and amenity access for the typical tenant pool here? Any planned neighborhood developments (good or bad) we should know about?
- What's the average days-on-market for RENTAL listings here right now (not sales)? A rising rental-DOM trend means longer vacancies and softer asking-rent achievability than the comps imply.
- What's the recent tenant-quality profile in this submarket — average credit score on applications, eviction rate, late-payment / NSF rate, and stable-employment percentage? A property-management company in the area should have these aggregated.
- How much new for-sale + rental construction is in the pipeline within 1–3 miles? Heavy new supply typically softens prices + rents 12–24 months out; constrained supply supports both.
Investment metrics
- 1% rule
- 0.66% ✗
- Cap rate
- 3.98%
- Cash-on-cash
- -8.26%
- DSCR
- 0.63
- GRM
- 12.7
CMA / ARV
- ARV (on-the-fly)
- $349,531
- Comps found
- 12
Show comp detail 12 sales within ~0.75 mi
| Address | Dist | Beds/Ba | Sqft | Sold | Price | $/sf | Match |
|---|---|---|---|---|---|---|---|
| 42548 Edmund Rucker Ln | 0.08mi | 4/3.0 | 1,942 (-7%) | 1mo | $314,900 | $162 | 83 |
| 42532 Edmund Rucker Ln | 0.12mi | 3/2.0 (-1) | 2,080 (-1%) | 3mo | $372,416 | $179 | 82 |
| 42690 Mystery Ln | 0.09mi | 3/2.0 (-1) | 2,034 (-3%) | 1mo | $338,990 | $167 | 81 |
| 42564 Edmund Rucker Ln | 0.07mi | 3/2.0 (-1) | 2,015 (-4%) | 1mo | $324,990 | $161 | 80 |
| 42595 Rustico Rd | 0.08mi | 3/2.0 (-1) | 1,984 (-5%) | 2mo | $371,900 | $187 | 77 |
| 1503 Velado Ln | 0.17mi | 3/2.0 (-1) | 2,150 (+3%) | 3mo | $339,990 | $158 | 76 |
| 42631 Reminiscent Ln | 0.14mi | 3/2.0 (-1) | 2,176 (+4%) | 3mo | $329,990 | $152 | 76 |
| 42591 Rustico Rd | 0.08mi | 3/2.0 (-1) | 1,950 (-7%) | 2mo | $349,900 | $179 | 74 |
| 42711 Loma Vista Ct | 0.38mi | 3/2.0 (-1) | 2,068 (-1%) | 1mo | $344,990 | $167 | 71 |
| 42546 Summer Crest Rd | 0.33mi | 3/2.0 (-1) | 2,035 (-3%) | 2mo | $320,000 | $157 | 70 |
| 1443 Florecer Ln | 0.16mi | 4/2.5 | 2,356 (+13%) | 3mo | $384,990 | $163 | 68 |
| 42715 Loma Vista Ct | 0.38mi | 3/2.0 (-1) | 1,866 (-11%) | 0mo | $328,990 | $176 | 55 |
Match score weights: distance 35% · size 25% · config 20% · recency 20%. Top-matched comps best support the ARV.
Projected returns pro-forma
10.0% appreciation · 0.32% rent growth · sell at horizon
- IRR
- 17.8%
- Equity multiple
- 2.45×
- Total profit
- $138,659
- Equity at exit
- $308,579
- IRR
- 16.2%
- Equity multiple
- 5.49×
- Total profit
- $430,802
- Equity at exit
- $665,462
Cash invested: $95,909 (down + closing). Projections, not guarantees.
Landlord ↔ Tenant lean methodology
- Overall (STATE)
- 87 Strongly Landlord-Friendly
- State Texas
- 87 Strongly Landlord-Friendly · R+5
- County
- — inherits STATE
- City
- — inherits STATE
ZIP-level market 77354
- Home prices YoY
- 2.4%
- Rents YoY
- 0.3%
- Active inventory
- 1604
- Price-to-rent
- 12.7×
Monthly cashflow live
- Estimated rent
- $2,256 medium interval (Pro) →
- Mortgage (P&I)
- −$1,796
- Tax est. 1.5%
- −$428 /mo · $5,138/yr
- Insurance
- −$143
- HOA
- −$75
- Vacancy / Maint / Mgmt
- −$474
- Net cashflow
- $-660
Break-even live
UW: 25.0% down · 7.5% · 30yr · 1.5% tax · 5.0% vac · 8.0% maint · 8.0% mgmt
Financing live
Cash to close
- Down payment
- $85,633
- Closing costs
- $10,276
- Reserves months
- —
- Total cash needed
- —
Loan-product check · same deal, 3 products live
Conventional
25% down · 7.5% · 30yr
- Down + closing
- —
- Monthly P&I
- —
- Monthly cashflow
- —
- DSCR
- —
- Eligible?
- —
Personal DTI + credit; lowest rate.
DSCR
20% down · 8.5% · 30yr
- Down + closing
- —
- Monthly P&I
- —
- Monthly cashflow
- —
- DSCR
- —
- Eligible?
- —
No personal income docs; deal must DSCR.
Hard money
10% down · 12.0% · 12mo
- Down + closing
- —
- Monthly P&I
- —
- Monthly cashflow
- —
- DSCR
- —
- Eligible?
- —
Short-term bridge; refi at stabilization.
HOA detail
- Monthly dues
- $75 · $900/yr
Listing history 13 events
-
2026-06-18days on market $342,531 Active 6 DOM
-
2026-06-17days on market $342,531 Active 5 DOM
-
2026-06-16days on market $342,531 Active 4 DOM
-
2026-06-15days on market $342,531 Active 3 DOM
-
2026-06-13remarks 574-char remark
-
2026-06-13days on market $342,531 Active 1 DOM
-
2026-06-09days on market $342,531 Active 10 DOM
-
2026-06-08days on market $342,531 Active 9 DOM
-
2026-06-07days on market $342,531 Active 8 DOM
-
2026-06-04days on market $342,531 Active 5 DOM
-
2026-06-03days on market $342,531 Active 4 DOM
-
2026-06-02days on market $342,531 Active 3 DOM
-
2026-06-01days on market $342,531 Active 2 DOM
ⓘ Source: listings_history table (triggers on properties + properties_extension) + one-shot
backfill from property_details.listing_events for pre-trigger history.
Nearby sold comps map
Loading sold comps map…
Walkable amenities ~0.75 mi
Loading nearby amenities…
Taxation est. · year 1
- Rental income
- $27,068
- − Mortgage interest
- −$19,187
- − Property taxes
- −$5,138
- − Insurance
- −$1,713
- − Repairs & maintenance
- −$2,165
- − Management
- −$2,165
- − HOA
- −$900
- − Depreciation
- −$9,965
- Taxable loss
- −$14,165
- Est. tax savings @ 24.0%
- +$3,400
- After-tax cash flow
- $-4,523/yr
For passive investors: Depreciation is non-cash, so a rental often shows a tax loss while cash-flowing — sheltering income. Rental losses are passive: they offset passive income freely, and up to $25,000/yr can offset ordinary (W-2) income if you actively participate and your MAGI is under $100k (phasing out to $0 by $150k); unused losses carry forward. On sale, claimed depreciation is recaptured at up to 25%, and gains may owe capital-gains tax (a 1031 exchange can defer both). Figures are a year-1 estimate at your 24.0% rate — not tax advice; consult a CPA.
Schools (NCES district)
- District
- Magnolia ISD
- NCES district ID
- 4828740
- Math proficiency
- 42% ▼ -7.00%
- Reading proficiency
- 45% ▼ -4.00%
- Median HH income
- $71,692
- Composite
- 39.46/100
- National rank
- #3958
- State rank
- #247 of 826 in TX
Livability — Magnolia
- Score
- 73/100
- State rank
- #222
- US rank
- #5442
Category grades
Schools grade is shown separately in the Schools card above.
Census & demographics
- County
- Montgomery County · 663,713 people
- City population
- 32,847
- Metro
- Houston-The Woodlands-Sugar Land, TX
- Population (ZIP)
- 44,900
- Household income
- $112,504
- Rent vs Own
- Severe rent burden
- 586.0
Population outlook (Montgomery County) Hauer SSP2
- Today (2025)
- 713,896 people
- By 2030
- 805,263 · +12.8%
- By 2040
- 992,708 · +39.1%
- By 2050
- 1,179,590 · +65.2%
- By 2075
- 1,628,084 · +128.1%
- By 2100
- 1,937,880 · +171.5%
Race, ethnicity, and origin ACS 2023
- Neighborhood character
- Predominantly White (66%)
- Race & ethnicity
- White 66% Hispanic / Latino 25% Two or more races 18% Black 3% Asian 1%
- Hispanic origin (detail)
- Mexican 14% Puerto Rican 1%
- Common ancestry
- Lithuanian 4% Slovak 2% Italian 2%
- Foreign-born
- 11% · Canada, Vietnam
- Languages at home
- 83% English-only · Spanish 15% Other Indo-European 1% German/W. Germanic 1%
Political lean MEDSL · Montgomery
- 2024 margin
- Solid R (+45.5) · D 26.8% · R 72.3%
- 2008→2024 swing
- +7.2pp toward D · 2008: -52.7pp · 2024: -45.5pp
- All cycles
- 2024: R+45.5 2020: R+43.8 2016: R+51.4 2012: R+60.7 2008: R+52.7
Not yet ingested
- Civics
- —
Market trends
- HPI YoY
- ▲ 12.09%
- Current HPI
- 512.87
- Rent YoY
- ▲ 0.32%
- Metro
- Houston-The Woodlands-Sugar Land, TX
- State GDP YoY
- ▲ 3.95%
- F500 in state
- 110
Industry mix (Fortune 500 HQ in TX)
| Industry | F500 HQs | Revenue |
|---|---|---|
| Energy | 16 | $1,198B |
|
||
| Technology | 5 | $198B |
|
||
| Engineering / Construction | 4 | $72B |
|
||
| Energy Services | 3 | $60B |
|
||
| Utilities | 3 | $41B |
|
||
| Healthcare | 2 | $330B |
|
||
Cash-flow waterfall
monthlySold comps — $/sqft
last 12 mo · ≤1 miLoading sold comps…