6130 Camino Real #106 · Jurupa Valley, CA
Flood risk 1/10 · Minimal
- FEMA flood zone
- X (unshaded)
- Chance of flooding over 30 yrs
- 0.0%
- Est. flood insurance / yr
- $507 – $1,088
Fire risk 4/10 · Minor
- Est. fire insurance / yr
- $659 – $1,223
Heat risk 8/10 · Major
- Hot days now (above 103°F)
- 7 days/yr
- Hot days in 30 yrs
- 20 days/yr
Wind risk 1/10 · Minimal
- Chance of severe wind over 30 yrs
- —
Air-quality risk 10/10 · Severe
- Unhealthy air days now
- 27 days/yr
- Unhealthy air days in 30 yrs
- 32 days/yr
Risk factors via First Street. Map © Google.
Why this score? — see what drove the C+ grade
The composite is a weighted blend of 9 inputs, each scored 0–100. Each bar is that input's sub-score; the figure is the points it added to the 100-point composite (weight × sub-score).
- Cash flow +30.0/30.0
- DSCR +10.0/10.0
- 1% rule +9.9/10.0
- Schools +3.1/10.0
- Rent growth +2.8/5.0
- Livability +2.5/5.0
- Condition / age +2.5/5.0
- ARV discount +0.0/15.0
- Appreciation +0.0/10.0
$185,250
🖨 Deal sheet 📄 Offer letter ✓ Due diligence
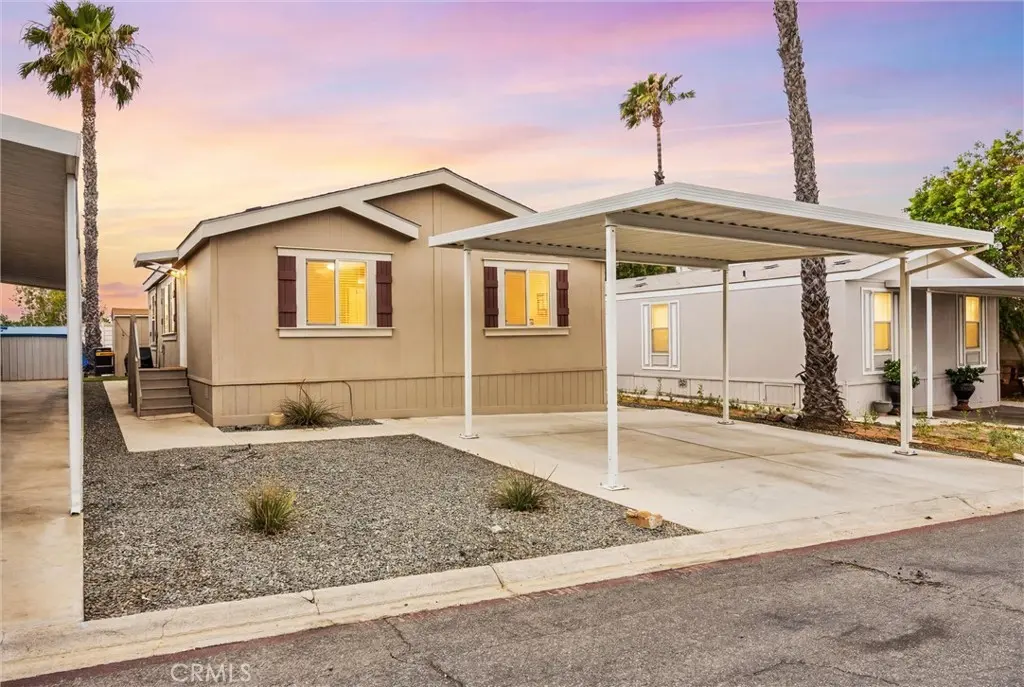
Listing remarks
Welcome to this move-in-ready gem located in the desirable all-age community of Jurupa Hills Cascade! This spacious home features 3 generously sized bedrooms, 2 bathrooms, and an open living and kitchen area that creates a comfortable flow for everyday living and entertaining. The kitchen and both bathrooms showcase coordinating cabinetry and countertops for a clean, cohesive look. Additional interior features include an indoor laundry room, a kitchen pantry, and a walk-in closet in the primary bedroom. Enjoy easy living with low-maintenance front and rear yards, covered parking for 2 cars, and additional storage with the included shed. The washer, dryer, and refrigerator are all included,
Key facts
- Covered parking
- Kitchen pantry
- Walk in closet
Tags
Property features AI
Finance
- Other: Manager approval required for residency; Pets allowed with breed restrictions; Directions within the park: enter and go right at the first stop sign onto Jane Street, then left on Tayo Street; home is on the right
- Financial info: Monthly land lease approximately $1,372 (park-provided amount)
- HOA & community: Park name: Jurupa Hills Cascade; Community features include dog park and street lighting; Land lease (monthly) required
Exterior
- Parking: Covered carport; 2 carport spaces; Driveway parking; Total of 2 parking spaces
- Security: Carbon monoxide detector(s); Smoke detector(s)
- Utilities: District/public water; Public sewer / sewer connected; Standard electric service / electricity connected; Natural gas connected; Cable available; Telephone available in street; Water connected
- Home design: Manufactured/double-wide mobile home (Palm Haven model); One story; Turnkey condition; Mobile home remains on site
- Construction: Shingle/composition roof; Built by Skyline Homes, Inc.; Mobile dimensions approximately 13 ft wide by 44 ft long
- Exterior features: Community pool; Yard; One shed on the property; No fencing
Interior
- Kitchen: Dishwasher; Microwave; Garbage disposal; Refrigerator; Gas water heater; Water heater unit
- Bedrooms: Primary bedroom on main floor; All bedrooms on ground level
- Flooring: Vinyl flooring; Carpet
- Bathrooms: One full bathroom; One three-quarter bathroom; Bathrooms include bathtub and shower (shower in tub)
- Heating & cooling: Central cooling; Central furnace heating
- Interior features: Open floor plan; Unfurnished; Panel doors; Blinds and window screens; Carbon monoxide and smoke detectors; Single-story home (one level); Main-floor primary bedroom
- Laundry & utility: In-unit laundry; Washer and dryer included; Washer hookup; Gas dryer hookup
Neighborhood map
What this means for you Summary
Snapshot
- This is a 3-bed/2.0-bath manufactured listed at $185k.
Deal economics
- At list price, monthly cash flow is $1k ($13k/yr) — positive.
- The deal already cash-flows at list — no discount required.
- Meets the 1% rule at list price ($3k rent vs $185k).
- Recommended offer: $182k (1.5% below list) — sets the bar for market timing.
- Cap rate 13.1% vs local median 2.9% in Jurupa Valley — top-decile yield for the area; either an underpriced asset or a hidden risk that comps aren't pricing in. Stress-test before assuming the spread holds.
Location & tenants
- Location reads 49/100 on livability (#1,170 in CA) — a working-class tenant base; expect higher turnover. Strengths: housing A+, employment A-; Watch: amenities F, commute F, cost of living F.
- Jurupa Unified (suburban): math 25% / reading 38% proficiency, ranked #953 of 1,400 in CA (top 68%) — families likely to look elsewhere, expect single-tenant / working-renter base with shorter leases; 64% free/reduced lunch — lower-income household profile, screen leases tightly.
- Zoned schools: Indian Hills Elementary (459 students, 75% FRL); Jurupa Middle (1,144 students, 75% FRL); Patriot High (math 24% / reading 24%, grade F, #826 of 1,170 statewide, top 80%, 2,532 students, 72% FRL).
- Market conditions: Rents rising (+1.3%/yr); 202 active listings in the ZIP; 1 comparable units currently listed for rent nearby; solid renter incomes; 9,195 units permitted in Riverside County in 2024 (1,512 in 5+ unit buildings).
- This rent runs 35% of the median local income ($95k/yr) — at the standard rent-burdened threshold; future hikes will face affordability resistance.
Forward outlook
- Local home prices are declining (-3.0%/yr); year-one equity from $1k of loan paydown is wiped out by about $6k of value loss. Plan a longer hold.
- Riverside County population projected at +22% by 2050 — long-run rental-demand tailwind backs the buy-and-hold thesis.
- At projected returns (-3.0% appreciation + 1.3% rent growth), your $52k cash investment doubles in ~6 years — after that, you're playing with house money.
Negotiation context
- It's been on market 21 days — a 2% lower offer ($182k) is reasonable based on typical stale-listing flexibility.
Risks & watch-outs
- Climate carrying-cost: extreme-heat days projected 7→20/yr by 2055 (HVAC capex compounding) — expect insurance premiums to compound above CPI over the hold.
Questions for the listing agent
- Is there a deadline driving the sale (1031 exchange, divorce, estate, relocation)? That informs how much negotiation room exists.
- Schools are F-rated, which usually means shorter tenancies and higher turnover. Who's the typical renter profile here, and what's been the actual vacancy rate?
- What's the average days-on-market for RENTAL listings here right now (not sales)? A rising rental-DOM trend means longer vacancies and softer asking-rent achievability than the comps imply.
- What's the recent tenant-quality profile in this submarket — average credit score on applications, eviction rate, late-payment / NSF rate, and stable-employment percentage? A property-management company in the area should have these aggregated.
- How much new for-sale + rental construction is in the pipeline within 1–3 miles? Heavy new supply typically softens prices + rents 12–24 months out; constrained supply supports both.
Investment metrics
- 1% rule
- 1.49% ✓
- Cap rate
- 13.06%
- Cash-on-cash
- 24.18%
- DSCR
- 2.08
- GRM
- 5.6
CMA / ARV
- ARV (on-the-fly)
- $146,124
- Comps found
- 12
Show comp detail 12 sales within ~0.75 mi
| Address | Dist | Beds/Ba | Sqft | Sold | Price | $/sf | Match |
|---|---|---|---|---|---|---|---|
| 6130 Camino Real #238 | 0.16mi | 3/2.0 | 1,196 (+1%) | 2mo | $190,000 | $159 | 90 |
| 6130 Camino Real #130 | 0.09mi | 3/2.0 | 1,248 (+5%) | 9mo | $135,000 | $108 | 80 |
| 6130 Camino Real #47 | 0.20mi | 3/2.0 | 1,176 (-1%) | 11mo | $145,000 | $123 | 80 |
| 6130 Camino Real #97 | 0.09mi | 2/2.0 (-1) | 1,152 (-3%) | 11mo | $120,000 | $104 | 77 |
| 6130 Camino Real #251 | 0.09mi | 3/2.0 | 1,296 (+9%) | 5mo | $132,000 | $102 | 77 |
| 6130 Camino Real #126 | 0.09mi | 3/2.0 | 1,040 (-12%) | 2mo | $155,000 | $149 | 74 |
| 6130 Camino Real #230 | 0.17mi | 3/2.0 | 1,250 (+5%) | 14mo | $170,000 | $136 | 72 |
| 6130 Camino Real #112 | 0.05mi | 2/2.0 (-1) | 1,040 (-12%) | 1mo | $149,000 | $143 | 71 |
| 6130 Camino Real #95 | 0.09mi | 4/2.0 (+1) | 1,320 (+11%) | 3mo | $166,800 | $126 | 70 |
| 6130 Camino Real #181 | 0.09mi | 3/2.0 | 1,344 (+13%) | 15mo | $155,000 | $115 | 61 |
| 6130 Camino Real #244 | 0.09mi | 2/2.0 (-1) | 1,344 (+13%) | 13mo | $120,000 | $89 | 58 |
| 6130 Camino Real #253 | 0.16mi | 3/2.0 | 1,344 (+13%) | 15mo | $165,000 | $123 | 58 |
Match score weights: distance 35% · size 25% · config 20% · recency 20%. Top-matched comps best support the ARV.
Projected returns pro-forma
-3.0% appreciation · 1.31% rent growth · sell at horizon
- IRR
- 15.6%
- Equity multiple
- 1.61×
- Total profit
- $31,886
- Equity at exit
- $27,621
- IRR
- 23.0%
- Equity multiple
- 2.83×
- Total profit
- $95,000
- Equity at exit
- $16,017
Cash invested: $51,870 (down + closing). Projections, not guarantees.
Landlord ↔ Tenant lean methodology
- Overall (STATE)
- 18 Strongly Tenant-Friendly
- State California
- 18 Strongly Tenant-Friendly · D+13
- County
- — inherits STATE
- City
- — inherits STATE
ZIP-level market 92509
- Rents YoY
- 1.3%
- Active inventory
- 202
- Price-to-rent
- 5.6×
Monthly cashflow live
- Estimated rent
- $2,754 medium interval (Pro) →
- Mortgage (P&I)
- −$971
- Tax from tax record
- −$82 /mo · $983/yr
- Insurance
- −$77
- HOA
- −$0
- Vacancy / Maint / Mgmt
- −$578
- Net cashflow
- $1,045
Break-even live
UW: 25.0% down · 7.5% · 30yr · 1.5% tax · 5.0% vac · 8.0% maint · 8.0% mgmt
Financing live
Cash to close
- Down payment
- $46,312
- Closing costs
- $5,558
- Reserves months
- —
- Total cash needed
- —
Loan-product check · same deal, 3 products live
Conventional
25% down · 7.5% · 30yr
- Down + closing
- —
- Monthly P&I
- —
- Monthly cashflow
- —
- DSCR
- —
- Eligible?
- —
Personal DTI + credit; lowest rate.
DSCR
20% down · 8.5% · 30yr
- Down + closing
- —
- Monthly P&I
- —
- Monthly cashflow
- —
- DSCR
- —
- Eligible?
- —
No personal income docs; deal must DSCR.
Hard money
10% down · 12.0% · 12mo
- Down + closing
- —
- Monthly P&I
- —
- Monthly cashflow
- —
- DSCR
- —
- Eligible?
- —
Short-term bridge; refi at stabilization.
Rent comps 1 comps
| Address | Beds | Baths | Sqft | Rent | $/sqft | DOM | Units | Dist |
|---|---|---|---|---|---|---|---|---|
| 6322 Brian Cir Jurupa Valley, CA | 3.0 | 2.0 | 1177 | $2,800 | $2.38 | 43d | 1 | 0.46mi |
Listing history 15 events
-
2026-06-18days on market $185,250 Active 21 DOM
-
2026-06-17pricedays on market $185,250 Active 20 DOM
-
2026-06-16days on market $195,000 Active 19 DOM
-
2026-06-15days on market $195,000 Active 18 DOM
-
2026-06-13days on market $195,000 Active 16 DOM
-
2026-06-13days on market $195,000 Active 15 DOM
-
2026-06-09days on market $195,000 Active 12 DOM
-
2026-06-08days on market $195,000 Active 11 DOM
-
2026-06-07days on market $195,000 Active 10 DOM
-
2026-06-04days on market $195,000 Active 7 DOM
-
2026-06-03days on market $195,000 Active 6 DOM
-
2026-06-02days on market $195,000 Active 5 DOM
-
2026-06-01days on market $195,000 Active 4 DOM
-
2026-05-31days on market $195,000 Active 3 DOM
-
2026-05-28$195,000 Active
ⓘ Source: listings_history table (triggers on properties + properties_extension) + one-shot
backfill from property_details.listing_events for pre-trigger history.
Tax reassessment forecast CA · Resets to sale price
- Current annual tax
- $983 · $82/mo
- Projected year-2 tax
- $1,408 · $117/mo
- Expected delta
- +$425/yr (+$35/mo · 43.2%)
ⓘ Screening estimate from a state-policy table — verify with the county assessor before closing.
Climate risk First Street
- Flood 1/10 Low FEMA zone X (unshaded) · 0% chance over 30 yrs
- Wildfire 4/10 Moderate
- Heat 8/10 Severe 7 d/yr ≥103°F today · 20 d/yr by 30 yrs out
- Wind 1/10 Low
- Air quality 10/10 Extreme 27 unhealthy d/yr today · 32 by 30 yrs out
Nearby sold comps map
Loading sold comps map…
Walkable amenities ~0.75 mi
Loading nearby amenities…
Taxation est. · year 1
- Rental income
- $33,048
- − Mortgage interest
- −$10,377
- − Property taxes
- −$983
- − Insurance
- −$926
- − Repairs & maintenance
- −$2,644
- − Management
- −$2,644
- − Depreciation
- −$5,389
- Taxable income
- $10,085
- Est. tax owed @ 24.0%
- −$2,420
- After-tax cash flow
- $10,120/yr
For passive investors: Depreciation is non-cash, so a rental often shows a tax loss while cash-flowing — sheltering income. Rental losses are passive: they offset passive income freely, and up to $25,000/yr can offset ordinary (W-2) income if you actively participate and your MAGI is under $100k (phasing out to $0 by $150k); unused losses carry forward. On sale, claimed depreciation is recaptured at up to 25%, and gains may owe capital-gains tax (a 1031 exchange can defer both). Figures are a year-1 estimate at your 24.0% rate — not tax advice; consult a CPA.
Schools (NCES district)
- District
- Jurupa Unified
- NCES district ID
- 0619260
- Math proficiency
- 25% ▲ 2.00%
- Reading proficiency
- 38% ▲ 2.00%
- Median HH income
- $58,100
- Composite
- 30.97/100
- National rank
- #11327
- State rank
- #953 of 1400 in CA
Livability — Jurupa Valley
- Score
- 49/100
- State rank
- #1170
- US rank
- #25915
Category grades
Schools grade is shown separately in the Schools card above.
Census & demographics
- Census place
- Jurupa Valley, CA
- County
- Riverside County · 2,287,001 people
- City population
- 119,165
- Metro
- Riverside-San Bernardino-Ontario, CA
- Population (ZIP)
- 81,182
- Household income
- $95,355
- Rent vs Own
- Severe rent burden
- 1694.0
Population outlook (Riverside County) Hauer SSP2
- Today (2025)
- 2,664,475 people
- By 2030
- 2,802,692 · +5.2%
- By 2040
- 3,050,904 · +14.5%
- By 2050
- 3,256,783 · +22.2%
- By 2075
- 3,655,058 · +37.2%
- By 2100
- 3,766,594 · +41.4%
Race, ethnicity, and origin ACS 2023
- Neighborhood character
- Predominantly Hispanic (74%)
- Race & ethnicity
- Hispanic / Latino 74% White 17% Two or more races 16% Black 4% Asian 4% Native American 1%
- Hispanic origin (detail)
- Mexican 67%
- Common ancestry
- Lithuanian 1%
- Foreign-born
- 28% · Canada, China, Vietnam
- Languages at home
- 42% English-only · Spanish 54% Other Indo-European 1% Tagalog/Filipino 1%
Political lean MEDSL · Riverside
- 2024 margin
- Toss-up / Even · D 48.0% · R 49.3% · Other 2.6%
- 2008→2024 swing
- -3.6pp toward R · 2008: 2.3pp · 2024: -1.3pp
- All cycles
- 2024: R+1.3 2020: D+8.0 2016: D+4.3 2012: R+0.4 2008: D+2.3
Not yet ingested
- Civics
- —
Market trends
- HPI YoY
- ▼ -374.91%
- Current HPI
- 464.8939
- Rent YoY
- ▲ 1.31%
- Metro
- Riverside-San Bernardino-Ontario, CA
- State GDP YoY
- ▲ 3.21%
- F500 in state
- 116
Industry mix (Fortune 500 HQ in CA)
| Industry | F500 HQs | Revenue |
|---|---|---|
| Technology | 27 | $1,492B |
|
||
| Financial Services | 3 | $174B |
|
||
| Retail | 3 | $44B |
|
||
| Insurance | 3 | $26B |
|
||
| Media / Entertainment | 2 | $115B |
|
||
| Pharmaceuticals / Biotech | 2 | $62B |
|
||
Price history
1 event — show timeline
- 2026-05-28 Listed $195,000 CRMLS
Property tax history
+1.6%/yrLatest (2025): $983 · +5.4% YoY. Source: county tax records.
Cash-flow waterfall
monthlySold comps — $/sqft
last 12 mo · ≤1 miLoading sold comps…