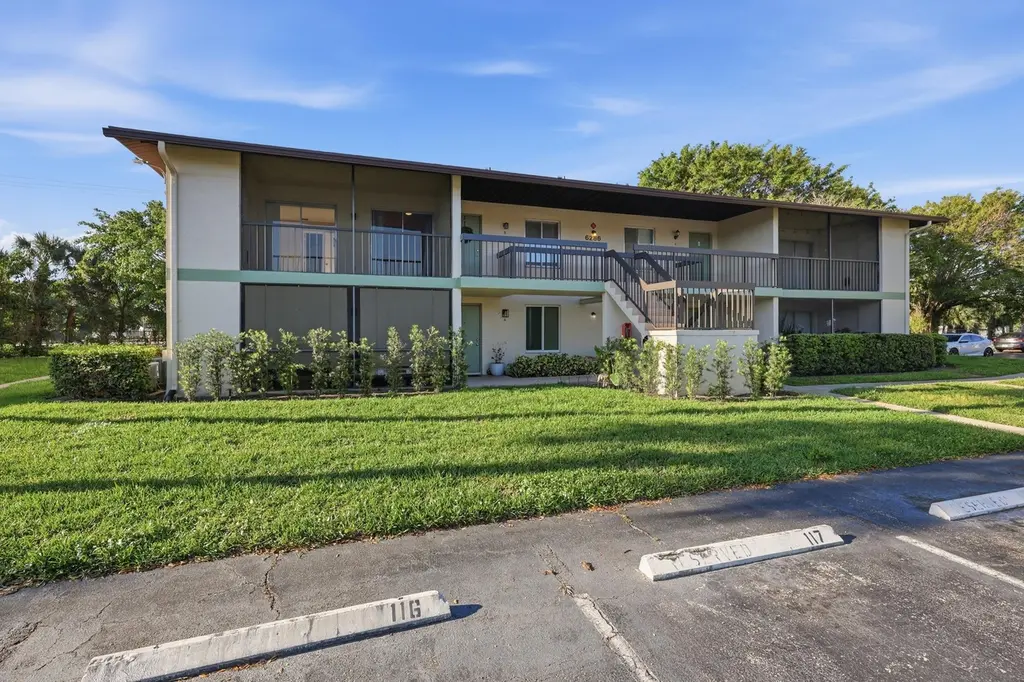
6286 Chasewood Dr Unit E · Jupiter, FL
Flood risk 1/10 · Minimal
- FEMA flood zone
- X (unshaded)
- Chance of flooding over 30 yrs
- 0.0%
- Est. flood insurance / yr
- $507 – $1,088
Fire risk 1/10 · Minimal
- Est. fire insurance / yr
- $947 – $1,759
Heat risk 10/10 · Severe
- Hot days now (above 106°F)
- 7 days/yr
- Hot days in 30 yrs
- 24 days/yr
Wind risk 10/10 · Severe
- Chance of severe wind over 30 yrs
- 99.0%
Air-quality risk 2/10 · Minimal
- Unhealthy air days now
- 1 days/yr
- Unhealthy air days in 30 yrs
- 2 days/yr
Risk factors via First Street. Map © Google.
Why this score? — see what drove the D- grade
The composite is a weighted blend of 9 inputs, each scored 0–100. Each bar is that input's sub-score; the figure is the points it added to the 100-point composite (weight × sub-score).
- Cash flow +10.2/30.0
- ARV discount +7.5/15.0
- 1% rule +5.4/10.0
- Schools +4.3/10.0
- Livability +3.5/5.0
- Rent growth +3.0/5.0
- DSCR +2.9/10.0
- Condition / age +2.5/5.0
- Appreciation +0.0/10.0
$240,000
🖨 Deal sheet 📄 Offer letter ✓ Due diligence
Listing remarks
Experience the best of Jupiter in this well-maintained, 2/2 condo featuring airy vaulted ceilings This home offers the ultimate Florida lifestyle. Located just minutes from pristine beaches, A-rated schools, PBI airport, medical care and public golf and so much more. Communities amenities include a heated pool, tennis, clubhouse, and car wash. Enjoy the screened patio, two assigned parking spots, a pet-friendly community, and with separate boat/trailer storage. HOA fees cover water, basic cable, building insurance, and maintenance. Investor-friendly: rent immediately (90-day min). Washer and dryer in unit. Move in ready
Key facts
- Screened patio
- Vaulted ceilings
- Move in ready
Tags
Property features AI
Finance
- Financial info: Pets allowed (restrictions possible)
- HOA & community: Homeowners association (monthly fee); Monthly HOA fee: $470; HOA covers cable TV, insurance, grounds maintenance, trash, water and common areas; Community amenities: clubhouse, pool, tennis courts, pickleball courts, picnic area, community room, sidewalks, street lights, parking
Exterior
- Parking: Assigned parking; Guest parking; 2 open parking spaces (2 total parking)
- Security: Smoke detector(s)
- Utilities: Public water; Public sewer; Cable available; Sewer available; Water available
- Home design: Condominium; One level; Entry-level living area; Faces east
- Construction: Block/CBS construction; Composition/shingle roof; 2 total stories
- Exterior features: Open porch; Porch
Interior
- Kitchen: Electric range; Microwave; Dishwasher; Disposal; Refrigerator; Electric water heater
- Bedrooms: 2 main-level bedrooms
- Flooring: Ceramic tile
- Bathrooms: 2 full bathrooms
- Heating & cooling: Central electric heating; Central individual air conditioning; Ceiling fans
- Interior features: High ceilings; Vaulted ceilings; Walk-in closet(s); Split bedroom layout; Unfurnished
- Laundry & utility: Laundry closet with inside electric dryer hookup
Neighborhood map
What this means for you Summary
Snapshot
- This is a 2-bed/2.0-bath condo listed at $240k.
Deal economics
- At list price, monthly cash flow is $-135 ($-2k/yr) — negative.
- To cash-flow at today's rent, offer at most $216k (10.0% below list).
- Meets the 1% rule at list price ($2k rent vs $240k).
- Recommended offer: $216k (10.0% below list) — sets the bar for cash-flow.
- Cap rate 5.6% vs local median 2.6% in Jupiter — top-decile yield for the area; either an underpriced asset or a hidden risk that comps aren't pricing in. Stress-test before assuming the spread holds.
Location & tenants
- Location reads 70/100 on livability (#415 in FL) — a middle-class / working-renter tenant base. Strengths: crime A+, employment A+, housing A+; Watch: amenities F, commute F, cost of living F.
- Palm Beach (suburban): math 46% / reading 53% proficiency, ranked #34 of 73 in FL (top 47%) — families likely to look elsewhere, expect single-tenant / working-renter base with shorter leases.
- Zoned schools: Jerry Thomas Elementary School (math 60% / reading 67%, grade B, #564 of 2,144 statewide, top 27%, 718 students, 41% FRL); Independence Middle School (math 71% / reading 67%, grade A, #68 of 571 statewide, top 12%, 1,166 students, 25% FRL); Jupiter High School (math 56% / reading 64%, grade C+, #106 of 667 statewide, top 16%, 3,087 students, 28% FRL) — zoned schools average 31% FRL vs 52% district-wide (21 pts lower); this property's tenant base skews higher-income than the district average.
- Zoned-school proficiency averages 64% at this address vs 50% district-wide (+15 pts) — the actual schools serving this property are materially stronger than the Palm Beach average implies; a family-tenant draw the district grade alone would hide.
- Market conditions: Rents rising (+1.9%/yr); 321 active listings in the ZIP; 26 comparable units currently listed for rent nearby; rentals at typical pace (median 20d on market — plan ~3-4 weeks tenant-placement turnaround); solid renter incomes; 3,974 units permitted in Palm Beach County in 2024 (1,012 in 5+ unit buildings).
Forward outlook
- Local home prices are declining (-3.0%/yr); year-one equity from $2k of loan paydown is wiped out by about $7k of value loss. Plan a longer hold.
- Palm Beach County population projected at +30% by 2050 — long-run rental-demand tailwind backs the buy-and-hold thesis.
Negotiation context
- It's been on market 86 days — a 6% lower offer ($226k) is reasonable based on typical stale-listing flexibility.
- Current owner paid $61k; list at $240k implies a 293% gain — meaningful room to come down on a strong offer.
Risks & watch-outs
- Climate carrying-cost: severe wind risk, 99% chance of damaging wind over 30y; extreme-heat days projected 7→24/yr by 2055 (HVAC capex compounding) — expect insurance premiums to compound above CPI over the hold.
Questions for the listing agent
- What do current leases actually rent for vs. the listed asking? Can we see a recent rent roll and the last 12 months of T-12 income?
- It's been on market 86 days. Have you received any prior offers? Is the seller open to a 10% concession, seller financing, or rate buy-down credit?
- What does the HOA fee cover, when was the last increase, and are there any pending special assessments or reserve-fund shortfalls?
- Any open or pending special assessments — roof, HVAC, plumbing, elevator, façade? What's the per-unit balance and payoff schedule, and is the seller paying it off at close or rolling it to the buyer?
- Why hasn't it sold? Are there any deal-killer items the seller is aware of (foundation, flood, title, zoning, code violations)?
- Is there a deadline driving the sale (1031 exchange, divorce, estate, relocation)? That informs how much negotiation room exists.
- Schools are A-rated — typically a magnet for longer-tenancy family renters. What's the average tenant stay here, and is there a school-zone premium baked into asking?
- The area grade is low — what's the realistic commute time and amenity access for the typical tenant pool here? Any planned neighborhood developments (good or bad) we should know about?
- What's the average days-on-market for RENTAL listings here right now (not sales)? A rising rental-DOM trend means longer vacancies and softer asking-rent achievability than the comps imply.
- What's the recent tenant-quality profile in this submarket — average credit score on applications, eviction rate, late-payment / NSF rate, and stable-employment percentage? A property-management company in the area should have these aggregated.
- How much new apartment / multifamily construction is in the pipeline within 1–3 miles? Heavy new supply (>2% of stock underway) typically softens rents 12–24 months out; light construction supports rent growth.
Investment metrics
- 1% rule
- 1.04% ✓
- Cap rate
- 5.62%
- Cash-on-cash
- -2.42%
- DSCR
- 0.89
- GRM
- 8.0
CMA / ARV
No comps found within radius.
Projected returns pro-forma
-3.0% appreciation · 1.86% rent growth · sell at horizon
- IRR
- -21.8%
- Equity multiple
- 0.26×
- Total profit
- $-50,037
- Equity at exit
- $35,785
- IRR
- -19.1%
- Equity multiple
- 0.04×
- Total profit
- $-64,769
- Equity at exit
- $20,751
Cash invested: $67,200 (down + closing). Projections, not guarantees.
Landlord ↔ Tenant lean methodology
- Overall (STATE)
- 87 Strongly Landlord-Friendly
- State Florida
- 87 Strongly Landlord-Friendly · R+3
- County
- — inherits STATE
- City
- — inherits STATE
ZIP-level market 33458
- Rents YoY
- 1.9%
- Active inventory
- 321
- Price-to-rent
- 8.0×
Monthly cashflow live
- Estimated rent
- $2,500 high interval (Pro) →
- Mortgage (P&I)
- −$1,259
- Tax from tax record
- −$282 /mo · $3,380/yr
- Insurance
- −$100
- HOA
- −$470
- Vacancy / Maint / Mgmt
- −$525
- Net cashflow
- $-135
Break-even live
UW: 25.0% down · 7.5% · 30yr · 1.5% tax · 5.0% vac · 8.0% maint · 8.0% mgmt
Financing live
Cash to close
- Down payment
- $60,000
- Closing costs
- $7,200
- Reserves months
- —
- Total cash needed
- —
Loan-product check · same deal, 3 products live
Conventional
25% down · 7.5% · 30yr
- Down + closing
- —
- Monthly P&I
- —
- Monthly cashflow
- —
- DSCR
- —
- Eligible?
- —
Personal DTI + credit; lowest rate.
DSCR
20% down · 8.5% · 30yr
- Down + closing
- —
- Monthly P&I
- —
- Monthly cashflow
- —
- DSCR
- —
- Eligible?
- —
No personal income docs; deal must DSCR.
Hard money
10% down · 12.0% · 12mo
- Down + closing
- —
- Monthly P&I
- —
- Monthly cashflow
- —
- DSCR
- —
- Eligible?
- —
Short-term bridge; refi at stabilization.
Rent comps 26 comps
| Address | Beds | Baths | Sqft | Rent | $/sqft | DOM | Units | Dist |
|---|---|---|---|---|---|---|---|---|
| 6285 Chasewood Dr Unit F Jupiter, FL | 2.0 | 2.0 | 860 | $2,225 | $2.59 | 2d | 1 | 0.06mi |
| 6314 Chasewood Dr Unit A Jupiter, FL | 2.0 | 2.0 | 860 | $1,900 | $2.21 | 21d | 1 | 0.07mi |
| 6299 Chasewood Dr Unit D Jupiter, FL | 2.0 | 2.0 | 980 | $2,400 | $2.45 | 4d | 1 | 0.07mi |
| 6328 Chasewood Dr Unit C Jupiter, FL | 2.0 | 2.0 | 860 | $2,400 | $2.79 | 14d | 1 | 0.10mi |
| 6485 Chasewood Dr Unit G Jupiter, FL | 2.0 | 2.0 | 980 | $2,500 | $2.55 | 24d | 1 | 0.10mi |
| 6489 Chasewood Dr Unit D Jupiter, FL | 2.0 | 2.0 | 980 | $2,250 | $2.30 | 2d | 1 | 0.11mi |
| 6341 Chasewood Dr Unit C Jupiter, FL | 2.0 | 2.0 | 980 | $2,300 | $2.35 | 24d | 1 | 0.13mi |
| 6327 Chasewood Dr Jupiter, FL | 2.0 | 2.0 | 980 | $2,600 | $2.65 | 17d | 2 | 0.23mi |
| 6540 Chasewood Dr Unit F Jupiter, FL | 2.0 | 2.0 | 1007 | $2,950 | $2.93 | 24d | 1 | 0.23mi |
| 6531 Chasewood Dr Unit H Jupiter, FL | 2.0 | 2.0 | 1007 | $2,350 | $2.33 | 5d | 1 | 0.26mi |
| 178 Pinewood Ct Jupiter, FL | 2.0 | 2.0 | 1049 | $2,200 | $2.10 | 24d | 1 | 0.33mi |
| 113 Pinewood Ct Jupiter, FL | 2.0 | 2.0 | 1049 | $2,400 | $2.29 | 5d | 1 | 0.38mi |
| 6705 Mallard Cove Rd Jupiter, FL | 1.0–2.0 | 1.0–2.0 | 820 | $2,075 | $2.53 | 2d | 22 | 0.46mi |
| 154 Banyan Cir Jupiter, FL | 3.0 | 2.0 | 1003 | $1,950 | $1.94 | 21d | 1 | 0.49mi |
| 139 Deerfield Ct Jupiter, FL | 2.0 | 2.0 | 1049 | $2,600 | $2.48 | 22d | 1 | 0.50mi |
| 125 Doe Trl Jupiter, FL | 3.0 | 1.0 | 891 | $3,000 | $3.37 | 21d | 1 | 0.62mi |
| 125 Doe Trl Jupiter, FL | 3.0 | 1.0 | 891 | $3,200 | $3.59 | 24d | 1 | 0.62mi |
| 808 Iroquois St Jupiter, FL | 3.0 | 1.0 | 1028 | $3,290 | $3.20 | 1d | 1 | 0.82mi |
| 808 Iroquois St Jupiter, FL | 3.0 | 1.0 | 1028 | $3,290 | $3.20 | 15d | 1 | 0.82mi |
| 404 S Caloosahatchee Ave Jupiter, FL | 3.0 | 2.0 | 1115 | $3,200 | $2.87 | 24d | 1 | 0.88mi |
| 6674 4th St Jupiter, FL | 3.0 | 2.0 | 1064 | $3,550 | $3.34 | 24d | 1 | 1.00mi |
| 1329 Chippewa St Jupiter, FL | 2.0 | 2.0 | 1038 | $3,100 | $2.99 | 24d | 1 | 1.02mi |
| 713 Suwanee Ave Jupiter, FL | 3.0 | 1.5 | 962 | $3,500 | $3.64 | 11d | 1 | 1.04mi |
| 996 Mohican Blvd Jupiter, FL | 3.0 | 2.0 | 962 | $3,550 | $3.69 | 20d | 1 | 1.16mi |
| 915 Riverwood Ln Jupiter, FL | 2.0 | 2.0 | 783 | $1,950 | $2.49 | 12d | 1 | 1.44mi |
| 2683 Sunbury Dr Jupiter, FL | 1.0 | 1.0 | 600 | $2,200 | $3.67 | 17d | 1 | 1.45mi |
HOA detail condo
- Monthly dues
- $470 · $5,640/yr
- Likely covers
- watercableinsurancepoolparking
- Assessments
- None detected in remarks — confirm with the listing agent.
Listing history 19 events
-
2026-06-18days on market $240,000 Active 86 DOM
-
2026-06-17days on market $240,000 Active 85 DOM
-
2026-06-16days on market $240,000 Active 84 DOM
-
2026-06-15days on market $240,000 Active 83 DOM
-
2026-06-13days on market $240,000 Active 81 DOM
-
2026-06-09days on market $240,000 Active 77 DOM
-
2026-06-08days on market $240,000 Active 76 DOM
-
2026-06-07days on market $240,000 Active 75 DOM
-
2026-06-04days on market $240,000 Active 72 DOM
-
2026-06-03days on market $240,000 Active 71 DOM
-
2026-06-02days on market $240,000 Active 70 DOM
-
2026-06-01days on market $240,000 Active 69 DOM
-
2026-05-31days on market $240,000 Active 68 DOM
-
2026-04-24price $240,000
-
2026-03-24$250,000 Active
-
2001-03-12soldstatus $61,000
-
1995-07-26soldstatus $55,800
-
1992-11-12soldstatus $52,500
-
1983-09-01soldstatus $44,500
ⓘ Source: listings_history table (triggers on properties + properties_extension) + one-shot
backfill from property_details.listing_events for pre-trigger history.
Tax reassessment forecast FL · Resets to sale price
- Current annual tax
- $3,380 · $282/mo
- Projected year-2 tax
- $3,380 · $282/mo
- Expected delta
- $0/yr ($0/mo · 0.0%)
ⓘ Screening estimate from a state-policy table — verify with the county assessor before closing.
Climate risk First Street
- Flood 1/10 Low FEMA zone X (unshaded) · 0% chance over 30 yrs
- Wildfire 1/10 Low
- Heat 10/10 Extreme 7 d/yr ≥106°F today · 24 d/yr by 30 yrs out
- Wind 10/10 Extreme 99% chance of damaging wind over 30 yrs
- Air quality 2/10 Low 1 unhealthy d/yr today · 2 by 30 yrs out
Nearby sold comps map
Loading sold comps map…
Walkable amenities ~0.75 mi
Loading nearby amenities…
Taxation est. · year 1
- Rental income
- $29,997
- − Mortgage interest
- −$13,444
- − Property taxes
- −$3,380
- − Insurance
- −$1,200
- − Repairs & maintenance
- −$2,400
- − Management
- −$2,400
- − HOA
- −$5,640
- − Depreciation
- −$6,982
- Taxable loss
- −$5,448
- Est. tax savings @ 24.0%
- +$1,308
- After-tax cash flow
- $-318/yr
For passive investors: Depreciation is non-cash, so a rental often shows a tax loss while cash-flowing — sheltering income. Rental losses are passive: they offset passive income freely, and up to $25,000/yr can offset ordinary (W-2) income if you actively participate and your MAGI is under $100k (phasing out to $0 by $150k); unused losses carry forward. On sale, claimed depreciation is recaptured at up to 25%, and gains may owe capital-gains tax (a 1031 exchange can defer both). Figures are a year-1 estimate at your 24.0% rate — not tax advice; consult a CPA.
Schools (NCES district)
- District
- Palm Beach
- NCES district ID
- 1201500
- Math proficiency
- 46% ▼ -16.00%
- Reading proficiency
- 53% ▼ -4.00%
- Median HH income
- $53,943
- Composite
- 42.72/100
- National rank
- #3160
- State rank
- #34 of 73 in FL
Livability — Jupiter
- Score
- 70/100
- State rank
- #415
- US rank
- #7386
Category grades
Schools grade is shown separately in the Schools card above.
Census & demographics
- County
- Palm Beach County · 1,438,312 people
- City population
- 68,420
- Metro
- Miami-Fort Lauderdale-Pompano Beach, FL
- Population (ZIP)
- 55,512
- Household income
- $109,729
- Rent vs Own
- Severe rent burden
- 1458.0
Population outlook (Palm Beach County) Hauer SSP2
- Today (2025)
- 1,637,487 people
- By 2030
- 1,743,255 · +6.5%
- By 2040
- 1,948,712 · +19.0%
- By 2050
- 2,132,979 · +30.3%
- By 2075
- 2,530,027 · +54.5%
- By 2100
- 2,706,979 · +65.3%
Race, ethnicity, and origin ACS 2023
- Neighborhood character
- Predominantly White (70%)
- Race & ethnicity
- White 70% Hispanic / Latino 21% Two or more races 14% Black 3% Asian 2%
- Hispanic origin (detail)
- Mexican 6% Puerto Rican 3% Cuban 2%
- Common ancestry
- Romanian 3% Lithuanian 2% Iranian 2%
- Foreign-born
- 17% · Canada, Jamaica, China
- Languages at home
- 78% English-only · Spanish 16% Other Indo-European 3% German/W. Germanic 1%
Political lean MEDSL · Palm Beach
- 2024 margin
- Toss-up / Even · D 50.0% · R 49.2%
- 2008→2024 swing
- -22.1pp toward R · 2008: 22.9pp · 2024: 0.8pp
- All cycles
- 2024: D+0.8 2020: D+12.8 2016: D+15.3 2012: D+17.0 2008: D+22.9
Not yet ingested
- Civics
- —
Market trends
- HPI YoY
- ▼ -277.55%
- Current HPI
- 376.5
- Rent YoY
- ▲ 1.86%
- Metro
- Miami-Fort Lauderdale-Pompano Beach, FL
- State GDP YoY
- ▲ 3.28%
- F500 in state
- 36
Industry mix (Fortune 500 HQ in FL)
| Industry | F500 HQs | Revenue |
|---|---|---|
| Industrial Technology | 2 | $29B |
|
||
| Insurance | 2 | $17B |
|
||
| Retail | 1 | $60B |
|
||
| Technology Distribution | 1 | $58B |
|
||
| Homebuilding | 1 | $35B |
|
||
| Technology Manufacturing | 1 | $35B |
|
||
Price history
+439.3% since first listed6 events — show timeline
- 2026-04-24 Price Changed $240,000 Beaches MLS
- 2026-03-24 Listed $250,000 Beaches MLS
- 2001-03-12 Sold (Public Records) $61,000 Public Records
- 1995-07-26 Sold (Public Records) $55,800 Public Records
- 1992-11-12 Sold (Public Records) $52,500 Public Records
- 1983-09-01 Sold (Public Records) $44,500 Public Records
Property tax history
+7.0%/yrLatest (2025): $3,380 · +1.3% YoY. Source: county tax records.
Cash-flow waterfall
monthlySold comps — $/sqft
last 12 mo · ≤1 miLoading sold comps…