 Multi-family
3480 Idlewood Dr · Soda Bay, CA
Flood risk 1/10 · Minimal
- FEMA flood zone
- X (unshaded)
- Chance of flooding over 30 yrs
- 0.0%
- Est. flood insurance / yr
- $507 – $1,088
Fire risk 9/10 · Severe
- Est. fire insurance / yr
- $659 – $1,223
Heat risk 5/10 · Moderate
- Hot days now (above 100°F)
- 8 days/yr
- Hot days in 30 yrs
- 17 days/yr
Wind risk 1/10 · Minimal
- Chance of severe wind over 30 yrs
- —
Air-quality risk 10/10 · Severe
- Unhealthy air days now
- 32 days/yr
- Unhealthy air days in 30 yrs
- 32 days/yr
Risk factors via First Street. Map © Google.
Why this score? — see what drove the D+ grade
The composite is a weighted blend of 9 inputs, each scored 0–100. Each bar is that input's sub-score; the figure is the points it added to the 100-point composite (weight × sub-score).
- Cash flow +16.8/30.0
- ARV discount +11.9/15.0
- DSCR +5.2/10.0
- 1% rule +4.3/10.0
- Livability +3.0/5.0
- Rent growth +2.5/5.0
- Schools +2.5/10.0
- Condition / age +2.5/5.0
- Appreciation +0.0/10.0
$380,000
🖨 Deal sheet 📄 Offer letter ✓ Due diligence
Multi-family units
County records classify this as Multi-Family (2-4 Unit). Listing-text estimate: 1 unit. estimate disagrees with records
Listing remarks
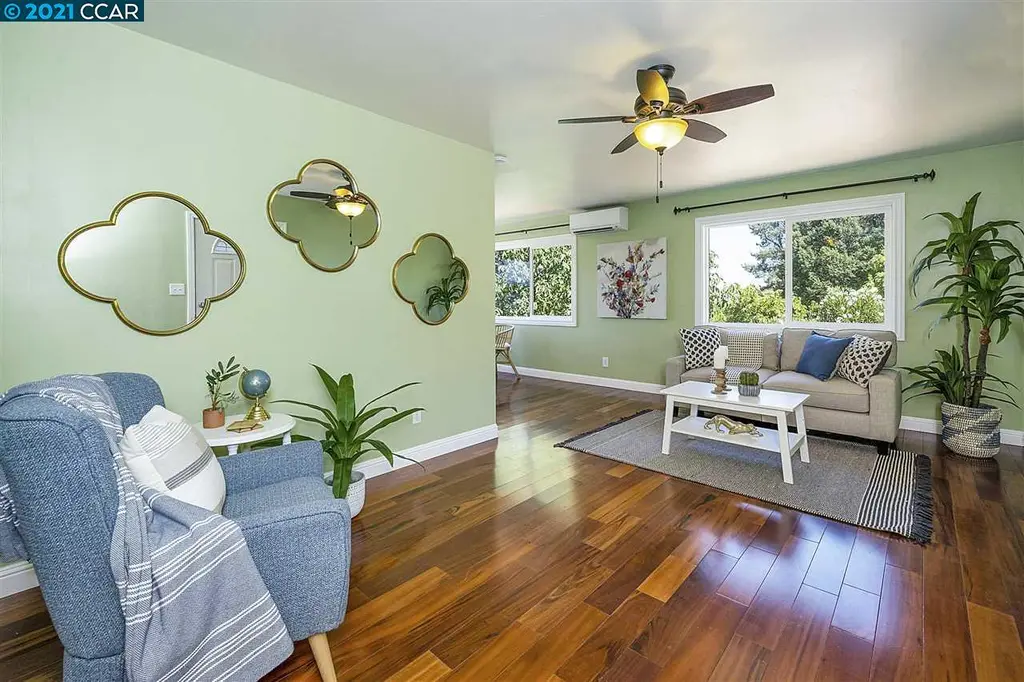
Welcome to 3480 Idlewood Dr in the desirable Riviera West community, the closest neighborhood to Konocti Harbor Resort. Tucked away off a quiet street, this well-maintained property offers a vacation-like atmosphere with breathtaking views of Clear Lake. This home features two separate units, each offering 2 bedrooms and 1 bathroom, perfect for multi-family living or investors looking for rental potential. The lower unit boasts a naturally cool and energy-efficient environment, as its back wall is subterranean, keeping it comfortably cool in the summer and warm in the winter. The expansive yard offers endless outdoor possibilities, with plenty of space for a boat or RV. Enjoy the convenienc
Key facts
- Clubhouse
- Community pool
- Two separate units
Tags
Neighborhood map
What this means for you Summary
Snapshot
- This is a 3-bed/2.0-bath multifamily listed at $380k.
Deal economics
- At list price, monthly cash flow is $244 ($3k/yr) — positive.
- The deal already cash-flows at list — no discount required.
- To meet the 1% rule (rent ≥ 1% of price), the offer needs to be $354k (6.8% below list).
- Recommended offer: $334k (12.0% below list) — sets the bar for market timing.
- Cap rate 7.1% vs local median 3.6% in Soda Bay — top-decile yield for the area; either an underpriced asset or a hidden risk that comps aren't pricing in. Stress-test before assuming the spread holds.
Location & tenants
- Location reads 60/100 on livability (#595 in CA) — a middle-class / working-renter tenant base. Strengths: employment A+, housing A+; Watch: health & safety C-, schools D-, crime F.
- Kelseyville Unified (town): math 18% / reading 33% proficiency, ranked #1,150 of 1,400 in CA (top 82%) — low school quality limits family demand, transient renter base, plan for 1-2y turnover; 68% free/reduced lunch — lower-income household profile, screen leases tightly.
- Market conditions: 268 active listings in the ZIP; 107 units permitted in Lake County in 2024 (40 in 5+ unit buildings).
- At $3,542/mo this rent would consume 68% of the median local household income ($63k/yr) (locally 194% of renters already pay >50% of income on rent) — very limited rent-growth headroom before tenants either downsize or default.
Forward outlook
- Local home prices are declining (-3.0%/yr); year-one equity from $3k of loan paydown is wiped out by about $11k of value loss. Plan a longer hold.
- Lake County population projected at -15% by 2050 — secular population decline; favor cash flow + early exit over multi-decade hold.
Negotiation context
- It's been on market 349 days — a 12% lower offer ($334k) is reasonable based on typical stale-listing flexibility.
- 12 sale attempts since 31y ago; this cycle's ask is 28048% above the opening price — seller raised mid-cycle; expect resistance to lowballs.
Risks & watch-outs
- Climate carrying-cost: severe wildfire risk; extreme-heat days projected 8→17/yr by 2055 (HVAC capex compounding) — expect insurance premiums to compound above CPI over the hold.
Questions for the listing agent
- It's been on market 349 days. Have you received any prior offers? Is the seller open to a 12% concession, seller financing, or rate buy-down credit?
- Built in 1977 — when were the roof, HVAC, electrical panel, plumbing, and water heater last replaced?
- What does the HOA fee cover, when was the last increase, and are there any pending special assessments or reserve-fund shortfalls?
- Why hasn't it sold? Are there any deal-killer items the seller is aware of (foundation, flood, title, zoning, code violations)?
- Is there a deadline driving the sale (1031 exchange, divorce, estate, relocation)? That informs how much negotiation room exists.
- Schools are D-rated, which usually means shorter tenancies and higher turnover. Who's the typical renter profile here, and what's been the actual vacancy rate?
- Crime grade is F in this area — have there been break-ins, vandalism, or insurance claims at this property in the last 3 years? What carrier currently insures it and at what premium?
- The area grade is low — what's the realistic commute time and amenity access for the typical tenant pool here? Any planned neighborhood developments (good or bad) we should know about?
- What's the average days-on-market for RENTAL listings here right now (not sales)? A rising rental-DOM trend means longer vacancies and softer asking-rent achievability than the comps imply.
- What's the recent tenant-quality profile in this submarket — average credit score on applications, eviction rate, late-payment / NSF rate, and stable-employment percentage? A property-management company in the area should have these aggregated.
- How much new apartment / multifamily construction is in the pipeline within 1–3 miles? Heavy new supply (>2% of stock underway) typically softens rents 12–24 months out; light construction supports rent growth.
Investment metrics
- 1% rule
- 0.93% ✗
- Cap rate
- 7.06%
- Cash-on-cash
- 2.76%
- DSCR
- 1.12
- GRM
- 8.9
CMA / ARV
- ARV (median comp)
- $421,593
- List price
- $380,000
- Delta
- -9.87%
- Verdict
- FAIR
- Comps
- 20 within 1.0 mi
Projected returns pro-forma
-3.0% appreciation · 3.0% rent growth · sell at horizon
- IRR
- -11.9%
- Equity multiple
- 0.57×
- Total profit
- $-46,001
- Equity at exit
- $56,659
- IRR
- -2.8%
- Equity multiple
- 0.81×
- Total profit
- $-19,976
- Equity at exit
- $32,855
Cash invested: $106,400 (down + closing). Projections, not guarantees.
Landlord ↔ Tenant lean methodology
- Overall (STATE)
- 18 Strongly Tenant-Friendly
- State California
- 18 Strongly Tenant-Friendly · D+13
- County
- — inherits STATE
- City
- — inherits STATE
ZIP-level market 95451
- Active inventory
- 268
- Price-to-rent
- 17.9×
Monthly cashflow live
- Estimated rent
- $3,542 medium interval (Pro) →
- Mortgage (P&I)
- −$1,993
- Tax from tax record
- −$368 /mo · $4,412/yr
- Insurance
- −$158
- HOA
- −$35
- Vacancy / Maint / Mgmt
- −$744
- Net cashflow
- $244
Break-even live
2-unit breakdown (identical units grouped — click to expand)
| Units | Beds | Baths | Est. rent |
|---|---|---|---|
| 2× units | 2 | 1 | $3,542 |
| #1 | 2 | 1 | $1,771 |
| #2 | 2 | 1 | $1,771 |
| Total (2 units) | $3,542 | ||
UW: 25.0% down · 7.5% · 30yr · 1.5% tax · 5.0% vac · 8.0% maint · 8.0% mgmt
Financing live
Cash to close
- Down payment
- $95,000
- Closing costs
- $11,400
- Reserves months
- —
- Total cash needed
- —
Loan-product check · same deal, 3 products live
Conventional
25% down · 7.5% · 30yr
- Down + closing
- —
- Monthly P&I
- —
- Monthly cashflow
- —
- DSCR
- —
- Eligible?
- —
Personal DTI + credit; lowest rate.
DSCR
20% down · 8.5% · 30yr
- Down + closing
- —
- Monthly P&I
- —
- Monthly cashflow
- —
- DSCR
- —
- Eligible?
- —
No personal income docs; deal must DSCR.
Hard money
10% down · 12.0% · 12mo
- Down + closing
- —
- Monthly P&I
- —
- Monthly cashflow
- —
- DSCR
- —
- Eligible?
- —
Short-term bridge; refi at stabilization.
HOA detail
- Monthly dues
- $35 · $420/yr
Listing history 39 events
-
2026-06-19days on market $380,000 Active 349 DOM
-
2026-06-18days on market $380,000 Active 348 DOM
-
2026-06-17days on market $380,000 Active 347 DOM
-
2026-06-16days on market $380,000 Active 346 DOM
-
2026-06-15days on market $380,000 Active 345 DOM
-
2026-06-14days on market $380,000 Active 343 DOM
-
2026-06-12days on market $380,000 Active 342 DOM
-
2026-06-09days on market $380,000 Active 339 DOM
-
2026-06-08days on market $380,000 Active 338 DOM
-
2026-06-07days on market $380,000 Active 337 DOM
-
2026-06-07days on market $380,000 Active 336 DOM
-
2026-06-03days on market $380,000 Active 333 DOM
-
2026-06-02statusdays on market $380,000 Active 332 DOM
-
2025-04-05historical $1,350
-
2025-03-07$1,350
-
2025-03-01$398,000 Active
-
2025-01-07historical $1,350
-
2024-12-11$1,350
-
2024-12-11historical $1,350
-
2024-10-25$1,350
-
2021-10-08soldstatus $383,000
-
2021-10-07soldstatus $383,000 Sold
-
2021-09-15status Pending
-
2021-07-16$390,000 New
-
2014-08-29soldstatus $150,000 Closed
-
2014-08-29soldstatus $150,000
-
2014-06-28status Backup Offers Accepted
-
2014-04-09$165,000 Active
-
2013-03-31historical
-
2012-09-25$148,500
-
2009-06-12historical
-
2007-04-02$250,000
-
2006-08-28historical
-
2006-02-28$375,000
-
2000-10-05soldstatus $140,000
-
2000-06-22soldstatus $91,000
-
1996-10-07$99,500
-
1996-01-02$115,000
-
1995-06-01$125,000
ⓘ Source: listings_history table (triggers on properties + properties_extension) + one-shot
backfill from property_details.listing_events for pre-trigger history.
Tax reassessment forecast CA · Resets to sale price
- Current annual tax
- $4,412 · $368/mo
- Projected year-2 tax
- $4,412 · $368/mo
- Expected delta
- $0/yr ($0/mo · 0.0%)
ⓘ Screening estimate from a state-policy table — verify with the county assessor before closing.
Climate risk First Street
- Flood 1/10 Low FEMA zone X (unshaded) · 0% chance over 30 yrs
- Wildfire 9/10 Extreme
- Heat 5/10 Major 8 d/yr ≥100°F today · 17 d/yr by 30 yrs out
- Wind 1/10 Low
- Air quality 10/10 Extreme 32 unhealthy d/yr today · 32 by 30 yrs out
Nearby sold comps map
Loading sold comps map…
Walkable amenities ~0.75 mi
Loading nearby amenities…
Taxation est. · year 1
- Rental income
- $42,504
- − Mortgage interest
- −$21,286
- − Property taxes
- −$4,412
- − Insurance
- −$1,900
- − Repairs & maintenance
- −$3,400
- − Management
- −$3,400
- − HOA
- −$420
- − Depreciation
- −$11,055
- Taxable loss
- −$3,369
- Est. tax savings @ 24.0%
- +$809
- After-tax cash flow
- $3,741/yr
For passive investors: Depreciation is non-cash, so a rental often shows a tax loss while cash-flowing — sheltering income. Rental losses are passive: they offset passive income freely, and up to $25,000/yr can offset ordinary (W-2) income if you actively participate and your MAGI is under $100k (phasing out to $0 by $150k); unused losses carry forward. On sale, claimed depreciation is recaptured at up to 25%, and gains may owe capital-gains tax (a 1031 exchange can defer both). Figures are a year-1 estimate at your 24.0% rate — not tax advice; consult a CPA.
Schools (NCES district)
- District
- Kelseyville Unified
- NCES district ID
- 0619320
- Math proficiency
- 18% ▼ -1.00%
- Reading proficiency
- 33% ▲ 4.00%
- Median HH income
- $47,210
- Composite
- 25.19/100
- National rank
- #12920
- State rank
- #1150 of 1400 in CA
Livability — Soda Bay
- Score
- 60/100
- State rank
- #595
- US rank
- #19239
Category grades
Schools grade is shown separately in the Schools card above.
Census & demographics
- County
- Lake County · 24,333 people
- Metro
- Clearlake, CA
- Population (ZIP)
- 12,592
- Household income
- $62,568
- Rent vs Own
- Severe rent burden
- 194.0
Population outlook (Lake County) Hauer SSP2
- Today (2025)
- 62,396 people
- By 2030
- 60,626 · -2.8%
- By 2040
- 56,453 · -9.5%
- By 2050
- 53,054 · -15.0%
- By 2075
- 47,663 · -23.6%
- By 2100
- 41,804 · -33.0%
Race, ethnicity, and origin ACS 2023
- Neighborhood character
- Majority White (57%)
- Race & ethnicity
- White 57% Hispanic / Latino 38% Two or more races 11% Black 1%
- Hispanic origin (detail)
- Mexican 35%
- Common ancestry
- Russian 3% Slovak 3% Italian 2%
- Foreign-born
- 14% · Canada
- Languages at home
- 71% English-only · Spanish 28% German/W. Germanic 1%
Political lean MEDSL · Lake
- 2024 margin
- Toss-up / Even · D 47.8% · R 49.2% · Other 3.0%
- 2008→2024 swing
- -20.6pp toward R · 2008: 19.3pp · 2024: -1.4pp
- All cycles
- 2024: R+1.4 2020: D+6.3 2016: D+3.7 2012: D+16.5 2008: D+19.3
Not yet ingested
- Civics
- —
Market trends
- HPI YoY
- ▼ -158.45%
- Current HPI
- 168.6995
- Rent YoY
- —
- Metro
- Clearlake, CA
- State GDP YoY
- ▲ 3.21%
- F500 in state
- 116
Industry mix (Fortune 500 HQ in CA)
| Industry | F500 HQs | Revenue |
|---|---|---|
| Technology | 27 | $1,492B |
|
||
| Financial Services | 3 | $174B |
|
||
| Retail | 3 | $44B |
|
||
| Insurance | 3 | $26B |
|
||
| Media / Entertainment | 2 | $115B |
|
||
| Pharmaceuticals / Biotech | 2 | $62B |
|
||
Price history
-98.9% since first listed26 events — show timeline
- 2025-04-05 Rental Removed $1,350 PROPERTYWARE
- 2025-03-07 Listed for Rent $1,350 PROPERTYWARE
- 2025-03-01 Listed $398,000 BAREIS
- 2025-01-07 Rental Removed $1,350 PROPERTYWARE
- 2024-12-11 Listed for Rent $1,350 PROPERTYWARE
- 2024-12-11 Rental Removed $1,350 RENTALBEAST
- 2024-10-25 Listed for Rent $1,350 RENTALBEAST
- 2021-10-08 Sold (Public Records) $383,000 Public Records
- 2021-10-07 Sold (MLS) $383,000 bridgeMLS, Bay East AOR, or Contra Costa AOR
- 2021-09-15 Pending — bridgeMLS, Bay East AOR, or Contra Costa AOR
- 2021-07-16 Listed $390,000 bridgeMLS, Bay East AOR, or Contra Costa AOR
- 2014-08-29 Sold (Public Records) $150,000 Public Records
- 2014-08-29 Sold (MLS) $150,000 CRMLS
- 2014-06-28 Pending — CRMLS
- 2014-04-09 Listed $165,000 CRMLS
- 2013-03-31 Listing Removed — CRMLS
- 2012-09-25 Listed $148,500 CRMLS
- 2009-06-12 Listing Removed — CRMLS
- 2007-04-02 Listed $250,000 CRMLS
- 2006-08-28 Listing Removed — CRMLS
- 2006-02-28 Listed $375,000 CRMLS
- 2000-10-05 Sold (Public Records) $140,000 Public Records
- 2000-06-22 Sold (Public Records) $91,000 Public Records
- 1996-10-07 Listed $99,500 San Francisco MLS
- 1996-01-02 Listed $115,000 San Francisco MLS
- 1995-06-01 Listed $125,000 San Francisco MLS
Property tax history
+7.2%/yrLatest (2025): $4,412 · +1.7% YoY. Source: county tax records.
Cash-flow waterfall
monthlySold comps — $/sqft
last 12 mo · ≤1 miLoading sold comps…