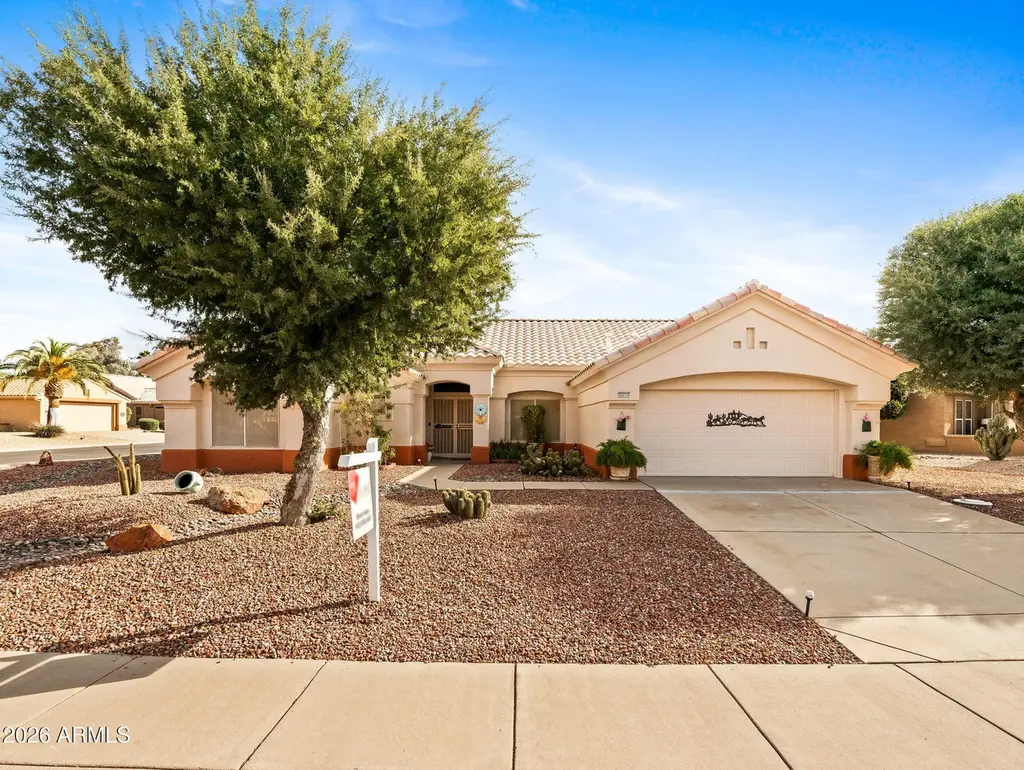
22715 N Mazatlan Dr · Sun City West, AZ
Flood risk 1/10 · Minimal
- FEMA flood zone
- X (shaded)
- Chance of flooding over 30 yrs
- 0.0%
- Est. flood insurance / yr
- $507 – $1,088
Fire risk 5/10 · Moderate
- Est. fire insurance / yr
- $610 – $1,132
Heat risk 9/10 · Severe
- Hot days now (above 113°F)
- 5 days/yr
- Hot days in 30 yrs
- 13 days/yr
Wind risk 1/10 · Minimal
- Chance of severe wind over 30 yrs
- —
Air-quality risk 2/10 · Minimal
- Unhealthy air days now
- 1 days/yr
- Unhealthy air days in 30 yrs
- 1 days/yr
Risk factors via First Street. Map © Google.
Why this score? — see what drove the D- grade
The composite is a weighted blend of 9 inputs, each scored 0–100. Each bar is that input's sub-score; the figure is the points it added to the 100-point composite (weight × sub-score).
- ARV discount +15.0/15.0
- Cash flow +7.6/30.0
- Rent growth +4.3/5.0
- Schools +3.3/10.0
- Livability +3.2/5.0
- Condition / age +2.5/5.0
- DSCR +1.7/10.0
- 1% rule +1.4/10.0
- Appreciation +0.0/10.0
$360,000
🖨 Deal sheet (PDF) 📄 Offer letter ✓ Due diligence
Listing remarks MLS
BIG PRICE ADJUSTMENT!! The home you've been waiting for is finally here. Nestled in one of the most desirable neighborhoods in Sun City West. This unique ''island'' community is surrounded by a stunning golf course, where every resident takes pride in their home and enjoys the best of Sun City living. This popular two-bedroom floor plan offers comfort, style, and exceptional value. Don't miss your chance to see it in person today!
Key facts
- 0.24 acre lot
- 2 garage spots
- Community pool
Neighborhood map
What this means for you Summary
Snapshot
- This is a 2-bed/3.0-bath single-family listed at $360k.
Deal economics
- At list price, monthly cash flow is $-428 ($-5k/yr) — negative.
- To cash-flow at today's rent, offer at most $284k (21.0% below list).
- To meet the 1% rule (rent ≥ 1% of price), the offer needs to be $230k (36.0% below list).
- Recommended offer: $230k (36.0% below list) — sets the bar for 1% rule.
Location & tenants
- Location reads 63/100 on livability (#106 in AZ) — a middle-class / working-renter tenant base. Strengths: housing A+, crime B, cost of living B; Watch: health & safety D, amenities F, commute F.
- Dysart Unified District (4243) (suburban): math 34% / reading 40% proficiency, ranked #73 of 249 in AZ (top 29%) — families likely to look elsewhere, expect single-tenant / working-renter base with shorter leases.
- Zoned schools: Kingswood Elementary School (math 29% / reading 33%, grade F, #525 of 1,109 statewide, top 48%, 791 students, 59% FRL); Willow Canyon High School (math 36% / reading 44%, grade F, #70 of 381 statewide, top 18%, 1,787 students, 32% FRL) — zoned schools at 45% FRL track the district average.
- Market conditions: Rents rising fast (+7.0%/yr); 124 active listings in the ZIP; 14 comparable units currently listed for rent nearby; rentals at typical pace (median 24d on market — plan ~3-4 weeks tenant-placement turnaround); 36,011 units permitted in Maricopa County in 2024 (12,801 in 5+ unit buildings).
- This rent runs 43% of the median local income ($64k/yr) — at the standard rent-burdened threshold; future hikes will face affordability resistance.
Forward outlook
- Local home prices are declining (-3.0%/yr); year-one equity from $2k of loan paydown is wiped out by about $11k of value loss. Plan a longer hold.
- Maricopa County population projected at +38% by 2050 — long-run rental-demand tailwind backs the buy-and-hold thesis.
Negotiation context
- It's been on market 123 days — a 12% lower offer ($317k) is reasonable based on typical stale-listing flexibility.
- Current owner paid $230k; list at $360k implies a 57% gain — meaningful room to come down on a strong offer.
Risks & watch-outs
- Climate carrying-cost: moderate wildfire risk; extreme-heat days projected 5→13/yr by 2055 (HVAC capex compounding) — expect insurance premiums to compound above CPI over the hold.
Questions for the listing agent
- What do current leases actually rent for vs. the listed asking? Can we see a recent rent roll and the last 12 months of T-12 income?
- It's been on market 123 days. Have you received any prior offers? Is the seller open to a 36% concession, seller financing, or rate buy-down credit?
- Why hasn't it sold? Are there any deal-killer items the seller is aware of (foundation, flood, title, zoning, code violations)?
- Is there a deadline driving the sale (1031 exchange, divorce, estate, relocation)? That informs how much negotiation room exists.
- Schools are D-rated, which usually means shorter tenancies and higher turnover. Who's the typical renter profile here, and what's been the actual vacancy rate?
- The area grade is low — what's the realistic commute time and amenity access for the typical tenant pool here? Any planned neighborhood developments (good or bad) we should know about?
- What's the average days-on-market for RENTAL listings here right now (not sales)? A rising rental-DOM trend means longer vacancies and softer asking-rent achievability than the comps imply.
- What's the recent tenant-quality profile in this submarket — average credit score on applications, eviction rate, late-payment / NSF rate, and stable-employment percentage? A property-management company in the area should have these aggregated.
- How much new for-sale + rental construction is in the pipeline within 1–3 miles? Heavy new supply typically softens prices + rents 12–24 months out; constrained supply supports both.
Investment metrics
- 1% rule
- 0.64% ✗
- Cap rate
- 4.87%
- Cash-on-cash
- -5.10%
- DSCR
- 0.77
- GRM
- 13.0
CMA / ARV
- ARV (median comp)
- $435,594
- List price
- $360,000
- Delta
- -17.35%
- Verdict
- UNDERPRICED
- Comps
- 20 within 1.0 mi
Show comp detail 12 sales within ~0.75 mi
| Address | Dist | Beds/Ba | Sqft | Sold | Price | $/sf | Match |
|---|---|---|---|---|---|---|---|
| 22703 N Mazatlan Dr | 0.03mi | 2/2.0 | 1,717 (+1%) | 4mo | $410,000 | $239 | 89 |
| 15137 W Black Gold Ln | 0.22mi | 2/2.5 | 1,825 (+8%) | 2mo | $500,000 | $274 | 73 |
| 15363 W Black Gold Ln | 0.27mi | 2/2.0 | 1,547 (-9%) | 2mo | $389,000 | $251 | 67 |
| 15352 W Blackgold Ln | 0.24mi | 2/2.0 | 1,854 (+10%) | 3mo | $489,000 | $264 | 67 |
| 15219 W Vía Manana -- | 0.48mi | 2/2.0 | 1,786 (+6%) | 2mo | $413,000 | $231 | 63 |
| 15173 W Via Manana -- | 0.43mi | 3/2.0 (+1) | 1,614 (-5%) | 2mo | $345,000 | $214 | 62 |
| 15331 W Ganado Dr | 0.29mi | 2/2.0 | 1,872 (+11%) | 4mo | $432,000 | $231 | 62 |
| 15240 W Via Montoya -- | 0.55mi | 2/2.0 | 1,778 (+5%) | 0mo | $385,000 | $217 | 62 |
| 15303 W Gunsight Dr | 0.43mi | 2/2.0 | 1,872 (+11%) | 0mo | $420,000 | $224 | 58 |
| 14840 W Corral Dr | 0.39mi | 2/2.0 | 1,922 (+14%) | 3mo | $389,000 | $202 | 53 |
| 14617 W Las Brizas Ln | 0.70mi | 2/2.0 | 1,824 (+8%) | 3mo | $459,900 | $252 | 48 |
| 14645 W Via Manana -- | 0.71mi | 2/2.0 | 1,858 (+10%) | 5mo | $365,000 | $196 | 43 |
Match score weights: distance 35% · size 25% · config 20% · recency 20%. Top-matched comps best support the ARV.
Projected returns pro-forma
-3.0% appreciation · 7.03% rent growth · sell at horizon
- IRR
- -21.1%
- Equity multiple
- 0.25×
- Total profit
- $-76,004
- Equity at exit
- $53,677
- IRR
- -8.0%
- Equity multiple
- 0.42×
- Total profit
- $-58,404
- Equity at exit
- $31,126
Cash invested: $100,800 (down + closing). Projections, not guarantees.
Landlord ↔ Tenant lean methodology
- Overall (STATE)
- 87 Strongly Landlord-Friendly
- State Arizona
- 87 Strongly Landlord-Friendly · R+3
- County
- — inherits STATE
- City
- — inherits STATE
ZIP-level market 85375
- Rents YoY
- 7.0%
- Active inventory
- 124
- Price-to-rent
- 13.0×
Monthly cashflow live
- Estimated rent
- $2,305 high interval (Pro) →
- Mortgage (P&I)
- −$1,888
- Tax from tax record
- −$211 /mo · $2,535/yr
- Insurance
- −$150
- HOA
- −$0
- Vacancy / Maint / Mgmt
- −$484
- Net cashflow
- $-428
Break-even live
Sensitivity live
| Price | -10% $-225 | -5% $-326 | +0% $-428 | +5% $-530 | +10% $-632 |
|---|---|---|---|---|---|
| Rent | -10% $-610 | -5% $-519 | +0% $-428 | +5% $-337 | +10% $-246 |
| Rate | -1.0pp $-247 | -0.5pp $-337 | base $-428 | +0.5pp $-522 | +1.0pp $-617 |
UW: 25.0% down · 7.5% · 30yr · 1.5% tax · 5.0% vac · 8.0% maint · 8.0% mgmt
Financing live
Cash to close
- Down payment
- $90,000
- Closing costs
- $10,800
- Reserves months
- —
- Total cash needed
- —
Loan-product check · same deal, 3 products live
Conventional
25% down · 7.5% · 30yr
- Down + closing
- —
- Monthly P&I
- —
- Monthly cashflow
- —
- DSCR
- —
- Eligible?
- —
Personal DTI + credit; lowest rate.
DSCR
20% down · 8.5% · 30yr
- Down + closing
- —
- Monthly P&I
- —
- Monthly cashflow
- —
- DSCR
- —
- Eligible?
- —
No personal income docs; deal must DSCR.
Hard money
10% down · 12.0% · 12mo
- Down + closing
- —
- Monthly P&I
- —
- Monthly cashflow
- —
- DSCR
- —
- Eligible?
- —
Short-term bridge; refi at stabilization.
Rent comps 14 comps
| Address | Beds | Baths | Sqft | Rent | $/sqft | DOM | Units | Dist |
|---|---|---|---|---|---|---|---|---|
| 15136 W Corral Dr Sun City West, AZ | 3.0 | 2.0 | 1856 | $2,100 | $1.13 | 16d | 1 | 0.16mi |
| 15138 W Las Brizas Ln Sun City West, AZ | 2.0 | 2.0 | 1842 | $2,895 | $1.57 | 19d | 1 | 0.17mi |
| 15438 W Domingo Ln Sun City West, AZ | 2.0 | 2.0 | 1438 | $1,950 | $1.36 | 0d | 1 | 0.54mi |
| 14759 W Gunsight Dr Sun City West, AZ | 2.0 | 2.0 | 1348 | $1,599 | $1.19 | 23d | 1 | 0.60mi |
| 14759 W Gunsight Dr Sun City West, AZ | 2.0 | 2.0 | 1348 | $1,699 | $1.26 | 45d | 1 | 0.60mi |
| 14608 W Horizon Dr Sun City West, AZ | 2.0 | 2.0 | 1778 | $2,000 | $1.12 | 45d | 1 | 0.76mi |
| 21601 N 147th Dr Sun City West, AZ | 2.0 | 2.0 | 1269 | $2,695 | $2.12 | 19d | 1 | 0.94mi |
| 14668 W Soft Wind Dr Surprise, AZ | 3.0 | 2.5 | 1794 | $1,995 | $1.11 | 45d | 1 | 1.04mi |
| 14234 W Via Tercero Sun City West, AZ | 2.0 | 2.0 | 1653 | $2,500 | $1.51 | 45d | 1 | 1.11mi |
| 22520 N Via de la Caballa Sun City West, AZ | 2.0 | 2.0 | 1438 | $3,400 | $2.36 | 18d | 1 | 1.25mi |
| 15707 W Cimarron Dr Surprise, AZ | 2.0 | 2.0 | 1183 | $1,745 | $1.48 | 23d | 1 | 1.30mi |
| 14113 W Robertson Dr Sun City West, AZ | 2.0 | 1.5 | 1410 | $3,800 | $2.70 | 45d | 1 | 1.34mi |
| 20813 N 147th Dr Sun City West, AZ | 2.0 | 1.5 | 1733 | $4,500 | $2.60 | 16d | 1 | 1.44mi |
| 21640 N Casa Royale Dr Surprise, AZ | 3.0 | 2.5 | 1894 | $2,195 | $1.16 | 18d | 1 | 1.45mi |
Listing history 19 events
-
2026-06-21days on market $360,000 Active 123 DOM
-
2026-06-18days on market $360,000 Active 120 DOM
-
2026-06-17days on market $360,000 Active 119 DOM
-
2026-06-16days on market $360,000 Active 118 DOM
-
2026-06-15days on market $360,000 Active 117 DOM
-
2026-06-13days on market $360,000 Active 115 DOM
-
2026-06-09days on market $360,000 Active 111 DOM
-
2026-06-08days on market $360,000 Active 110 DOM
-
2026-06-07days on market $360,000 Active 109 DOM
-
2026-06-04days on market $360,000 Active 106 DOM
-
2026-06-03days on market $360,000 Active 105 DOM
-
2026-06-02days on market $360,000 Active 104 DOM
-
2026-06-01days on market $360,000 Active 103 DOM
-
2026-05-31days on market $360,000 Active 102 DOM
-
2026-05-05price $360,000 436-char remark
Show marketing remark (436 chars)
BIG PRICE ADJUSTMENT!! The home you've been waiting for is finally here. Nestled in one of the most desirable neighborhoods in Sun City West. This unique ''island'' community is surrounded by a stunning golf course, where every resident takes pride in their home and enjoys the best of Sun City living. This popular two-bedroom floor plan offers comfort, style, and exceptional value. Don't miss your chance to see it in person today!
-
2026-03-17price $380,000 436-char remark
Show marketing remark (436 chars)
BIG PRICE ADJUSTMENT!! The home you've been waiting for is finally here. Nestled in one of the most desirable neighborhoods in Sun City West. This unique ''island'' community is surrounded by a stunning golf course, where every resident takes pride in their home and enjoys the best of Sun City living. This popular two-bedroom floor plan offers comfort, style, and exceptional value. Don't miss your chance to see it in person today!
-
2026-02-18$400,000 Active 436-char remark
Show marketing remark (436 chars)
BIG PRICE ADJUSTMENT!! The home you've been waiting for is finally here. Nestled in one of the most desirable neighborhoods in Sun City West. This unique ''island'' community is surrounded by a stunning golf course, where every resident takes pride in their home and enjoys the best of Sun City living. This popular two-bedroom floor plan offers comfort, style, and exceptional value. Don't miss your chance to see it in person today!
-
2005-04-29soldstatus $229,900
-
1996-11-13soldstatus $134,175
ⓘ Source: listings_history table (triggers on properties + properties_extension) + one-shot
backfill from property_details.listing_events for pre-trigger history.
Tax reassessment forecast AZ · Resets to sale price
- Current annual tax
- $2,535 · $211/mo
- Projected year-2 tax
- $2,535 · $211/mo
- Expected delta
- $0/yr ($0/mo · 0.0%)
ⓘ Screening estimate from a state-policy table — verify with the county assessor before closing.
Climate risk First Street
- Flood 1/10 Low FEMA zone X (shaded) · 0% chance over 30 yrs
- Wildfire 5/10 Major
- Heat 9/10 Extreme 5 d/yr ≥113°F today · 13 d/yr by 30 yrs out
- Wind 1/10 Low
- Air quality 2/10 Low 1 unhealthy d/yr today · 1 by 30 yrs out
Nearby sold comps map
Loading sold comps map…
Walkable amenities ~0.75 mi
Loading nearby amenities…
Taxation est. · year 1
- Rental income
- $27,657
- − Mortgage interest
- −$20,166
- − Property taxes
- −$2,535
- − Insurance
- −$1,800
- − Repairs & maintenance
- −$2,213
- − Management
- −$2,213
- − Depreciation
- −$10,473
- Taxable loss
- −$11,741
- Est. tax savings @ 24.0%
- +$2,818
- After-tax cash flow
- $-2,322/yr
For passive investors: Depreciation is non-cash, so a rental often shows a tax loss while cash-flowing — sheltering income. Rental losses are passive: they offset passive income freely, and up to $25,000/yr can offset ordinary (W-2) income if you actively participate and your MAGI is under $100k (phasing out to $0 by $150k); unused losses carry forward. On sale, claimed depreciation is recaptured at up to 25%, and gains may owe capital-gains tax (a 1031 exchange can defer both). Figures are a year-1 estimate at your 24.0% rate — not tax advice; consult a CPA.
Schools (NCES district)
- District
- Dysart Unified District (4243)
- NCES district ID
- 0402690
- Math proficiency
- 34% ▼ -10.00%
- Reading proficiency
- 40% ▼ -5.00%
- Median HH income
- $58,033
- Composite
- 32.76/100
- National rank
- #5634
- State rank
- #73 of 249 in AZ
Livability — Sun City West
- Score
- 63/100
- State rank
- #106
- US rank
- #14878
Category grades
Schools grade is shown separately in the Schools card above.
Census & demographics
- Census place
- Sun City West, AZ
- County
- Maricopa County · 4,537,380 people
- City population
- 27,680
- Metro
- Phoenix-Mesa-Chandler, AZ
- Population (ZIP)
- 27,680
- Household income
- $63,928
- Rent vs Own
- Severe rent burden
- 691.0
Population outlook (Maricopa County) Hauer SSP2
- Today (2025)
- 4,979,203 people
- By 2030
- 5,378,229 · +8.0%
- By 2040
- 6,156,598 · +23.6%
- By 2050
- 6,872,376 · +38.0%
- By 2075
- 8,401,270 · +68.7%
- By 2100
- 9,247,439 · +85.7%
Race, ethnicity, and origin ACS 2023
- Neighborhood character
- Predominantly White (94%)
- Race & ethnicity
- White 94% Two or more races 2% Hispanic / Latino 1% Asian 1%
- Common ancestry
- Romanian 5% Portuguese 5% Lithuanian 4%
- Foreign-born
- 4% · Canada
- Languages at home
- 96% English-only · Spanish 2% Russian/Polish/Slavic 1%
Political lean MEDSL · Maricopa
- 2024 margin
- Toss-up / Even · D 47.7% · R 51.2% · Other 1.1%
- 2008→2024 swing
- +7.1pp toward D · 2008: -10.6pp · 2024: -3.5pp
- All cycles
- 2024: R+3.5 2020: D+2.2 2016: R+3.5 2012: R+12.0 2008: R+10.6
Not yet ingested
- Civics
- —
Market trends
- HPI YoY
- ▼ -140.20%
- Current HPI
- 239.3422
- Rent YoY
- ▲ 7.03%
- Metro
- Phoenix-Mesa-Chandler, AZ
- State GDP YoY
- ▲ 4.54%
- F500 in state
- 20
Industry mix (Fortune 500 HQ in AZ)
| Industry | F500 HQs | Revenue |
|---|---|---|
| Technology | 2 | $13B |
|
||
| Mining / Metals | 1 | $23B |
|
||
| Environmental Services | 1 | $16B |
|
||
| Metals / Steel | 1 | $14B |
|
||
| Technology Distribution | 1 | $9B |
|
||
| Homebuilding | 1 | $8B |
|
||
Price history
+168.3% since first listed5 events — show timeline
- 2026-05-05 Price Changed $360,000 ARMLS
- 2026-03-17 Price Changed $380,000 ARMLS
- 2026-02-18 Listed $400,000 ARMLS
- 2005-04-29 Sold (Public Records) $229,900 Public Records
- 1996-11-13 Sold (Public Records) $134,175 Public Records
Property tax history
+2.8%/yrLatest (2025): $2,535 · +2.6% YoY. Source: county tax records.
Cash-flow waterfall
monthlySold comps — $/sqft
last 12 mo · ≤1 miLoading sold comps…