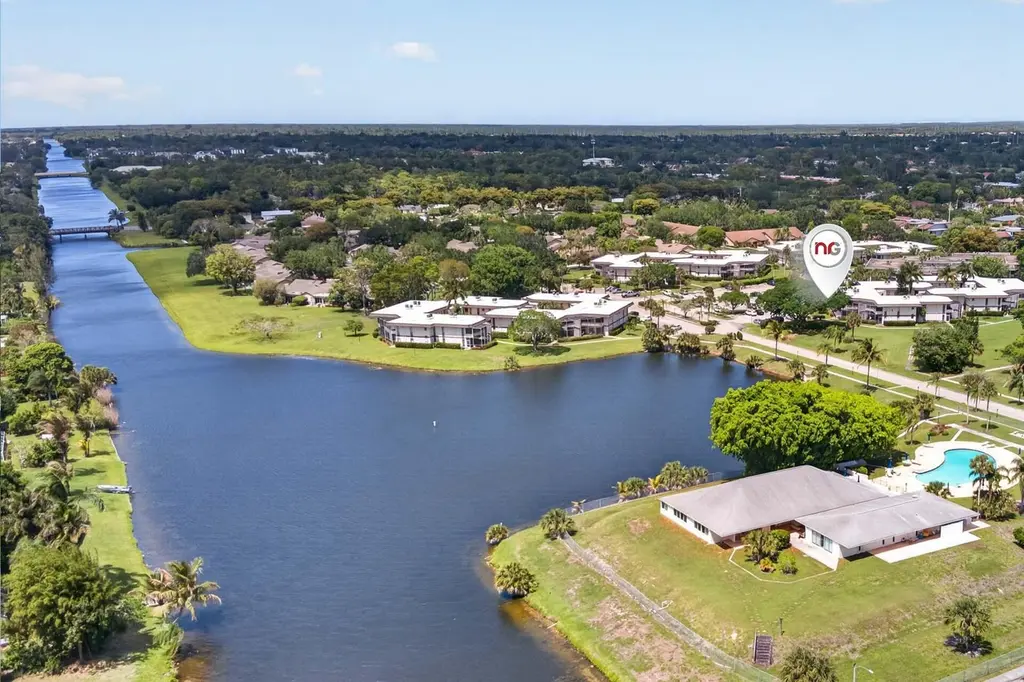
3 Greenway Vlg N #210 · Royal Palm Beach, FL
Flood risk 1/10 · Minimal
- FEMA flood zone
- X (unshaded)
- Chance of flooding over 30 yrs
- 0.0%
- Est. flood insurance / yr
- $507 – $1,088
Fire risk 1/10 · Minimal
- Est. fire insurance / yr
- $947 – $1,759
Heat risk 10/10 · Severe
- Hot days now (above 107°F)
- 7 days/yr
- Hot days in 30 yrs
- 26 days/yr
Wind risk 10/10 · Severe
- Chance of severe wind over 30 yrs
- 99.0%
Air-quality risk 2/10 · Minimal
- Unhealthy air days now
- 0 days/yr
- Unhealthy air days in 30 yrs
- 1 days/yr
Risk factors via First Street. Map © Google.
Why this score? — see what drove the C grade
The composite is a weighted blend of 9 inputs, each scored 0–100. Each bar is that input's sub-score; the figure is the points it added to the 100-point composite (weight × sub-score).
- Cash flow +12.4/30.0
- Appreciation +10.0/10.0
- 1% rule +9.8/10.0
- ARV discount +7.5/15.0
- Schools +4.3/10.0
- Livability +4.0/5.0
- DSCR +3.7/10.0
- Rent growth +2.7/5.0
- Condition / age +2.5/5.0
$139,000
🖨 Deal sheet 📄 Offer letter ✓ Due diligence
Listing remarks MLS
ALL MEASURES APPROXIMATE THE VIEW OF THE LAKE WIIL SELL THIS APARTMENT.EXCELLENT CONDITION TILED KITCHEN AND HALLWAY, DR MIRRORED WALL,4
Key facts
- Lake views
- Community pool
- Spacious balcony
Tags
Property features AI
Finance
- Other: Senior community; Pets allowed with restrictions (breed, number, size limits)
- HOA & community: Community of 96 units; HOA with clubhouse and pool; HOA fee paid monthly (includes cable TV, grounds maintenance, pest control, sewer, water, common areas)
Exterior
- Parking: Assigned open parking (1 space)
- Utilities: Public water; Public sewer; Cable available; Electricity available
- Home design: Condominium; 2 stories; Resale; Faces west
- Construction: CBS construction; Composition roof with wood truss/rafter; Built as part of a multi-story building
- Exterior features: Terrace; Waterfront property
Interior
- Kitchen: Dishwasher; Electric range; Microwave; Refrigerator
- Bedrooms: 2 main level bedrooms
- Flooring: Carpet; Ceramic tile; Tile; Other
- Bathrooms: 2 full bathrooms (main level)
- Heating & cooling: Central electric heating; Central electric air conditioning
- Interior features: Walk-in closets
- Laundry & utility: Common area laundry room
Neighborhood map
What this means for you Summary
Snapshot
- This is a 2-bed/2.0-bath condo listed at $139k.
Deal economics
- At list price, monthly cash flow is $-24 ($-286/yr) — negative.
- To cash-flow at today's rent, offer at most $135k (3.0% below list).
- Meets the 1% rule at list price ($2k rent vs $139k).
- Recommended offer: $135k (3.0% below list) — sets the bar for cash-flow.
Location & tenants
- Location reads 79/100 on livability (#135 in FL, #2,039 nationally) — a middle-class / working-renter tenant base. Strengths: employment A+, housing A+, health & safety A+; Watch: cost of living C-, amenities F, commute F.
- Palm Beach (suburban): math 46% / reading 53% proficiency, ranked #34 of 73 in FL (top 47%) — families likely to look elsewhere, expect single-tenant / working-renter base with shorter leases.
- Zoned schools: Cypress Trails Elementary School (math 52% / reading 62%, grade C+, #781 of 2,144 statewide, top 38%, 492 students, 53% FRL); Crestwood Community Middle (math 49% / reading 52%, grade C, #246 of 571 statewide, top 44%, 724 students, 50% FRL); Royal Palm Beach High School (math 22% / reading 38%, grade F, #441 of 667 statewide, top 67%, 2,343 students, 57% FRL) — zoned schools at 54% FRL track the district average.
- Market conditions: Rents flat; 574 active listings in the ZIP; 40 comparable units currently listed for rent nearby; rentals at typical pace (median 22d on market — plan ~3-4 weeks tenant-placement turnaround); solid renter incomes; 3,974 units permitted in Palm Beach County in 2024 (1,012 in 5+ unit buildings).
Forward outlook
- In year one you build about $15k of equity ($961 loan paydown + $14k appreciation (10.0% local appreciation)).
- Palm Beach County population projected at +30% by 2050 — long-run rental-demand tailwind backs the buy-and-hold thesis.
- At projected returns (10.0% appreciation + 0.8% rent growth), your $39k cash investment doubles in ~3 years — after that, you're playing with house money.
- By year 3, paydown + projected appreciation supports a ~$38k cash-out refi (75% LTV) — recoverable capital for the next deal without selling this one.
Negotiation context
- It's been on market 55 days — a 3% lower offer ($135k) is reasonable based on typical stale-listing flexibility.
- 2 sale attempts since 28y ago with the ask held roughly flat each time — persistent listings suggest the price (not the market) is what's stuck; bring a comps-based counter.
- Current owner paid $40k; list at $139k implies a 248% gain — meaningful room to come down on a strong offer.
Risks & watch-outs
- Watch-outs: HOA is 32% of rent.
- Climate carrying-cost: severe wind risk, 99% chance of damaging wind over 30y; extreme-heat days projected 7→26/yr by 2055 (HVAC capex compounding) — expect insurance premiums to compound above CPI over the hold.
Questions for the listing agent
- What do current leases actually rent for vs. the listed asking? Can we see a recent rent roll and the last 12 months of T-12 income?
- It's been on market 55 days. Have you received any prior offers? Is the seller open to a 3% concession, seller financing, or rate buy-down credit?
- Built in 1970 — when were the roof, HVAC, electrical panel, plumbing, and water heater last replaced?
- What does the HOA fee cover, when was the last increase, and are there any pending special assessments or reserve-fund shortfalls?
- Any open or pending special assessments — roof, HVAC, plumbing, elevator, façade? What's the per-unit balance and payoff schedule, and is the seller paying it off at close or rolling it to the buyer?
- Is there a deadline driving the sale (1031 exchange, divorce, estate, relocation)? That informs how much negotiation room exists.
- Schools are B-rated — typically a magnet for longer-tenancy family renters. What's the average tenant stay here, and is there a school-zone premium baked into asking?
- What's the average days-on-market for RENTAL listings here right now (not sales)? A rising rental-DOM trend means longer vacancies and softer asking-rent achievability than the comps imply.
- What's the recent tenant-quality profile in this submarket — average credit score on applications, eviction rate, late-payment / NSF rate, and stable-employment percentage? A property-management company in the area should have these aggregated.
- How much new apartment / multifamily construction is in the pipeline within 1–3 miles? Heavy new supply (>2% of stock underway) typically softens rents 12–24 months out; light construction supports rent growth.
Investment metrics
- 1% rule
- 1.48% ✓
- Cap rate
- 6.09%
- Cash-on-cash
- -0.73%
- DSCR
- 0.97
- GRM
- 5.6
CMA / ARV
No comps found within radius.
Projected returns pro-forma
10.0% appreciation · 0.85% rent growth · sell at horizon
- IRR
- 22.7%
- Equity multiple
- 2.81×
- Total profit
- $70,295
- Equity at exit
- $125,222
- IRR
- 19.5%
- Equity multiple
- 6.17×
- Total profit
- $201,036
- Equity at exit
- $270,046
Cash invested: $38,920 (down + closing). Projections, not guarantees.
Landlord ↔ Tenant lean methodology
- Overall (STATE)
- 87 Strongly Landlord-Friendly
- State Florida
- 87 Strongly Landlord-Friendly · R+3
- County
- — inherits STATE
- City
- — inherits STATE
ZIP-level market 33411
- Home prices YoY
- 1.9%
- Rents YoY
- 0.8%
- Active inventory
- 574
- Price-to-rent
- 5.6×
Monthly cashflow live
- Estimated rent
- $2,051 high interval (Pro) →
- Mortgage (P&I)
- −$729
- Tax from tax record
- −$191 /mo · $2,290/yr
- Insurance
- −$58
- HOA
- −$666
- Vacancy / Maint / Mgmt
- −$431
- Net cashflow
- $-24
Break-even live
UW: 25.0% down · 7.5% · 30yr · 1.5% tax · 5.0% vac · 8.0% maint · 8.0% mgmt
Financing live
Cash to close
- Down payment
- $34,750
- Closing costs
- $4,170
- Reserves months
- —
- Total cash needed
- —
Loan-product check · same deal, 3 products live
Conventional
25% down · 7.5% · 30yr
- Down + closing
- —
- Monthly P&I
- —
- Monthly cashflow
- —
- DSCR
- —
- Eligible?
- —
Personal DTI + credit; lowest rate.
DSCR
20% down · 8.5% · 30yr
- Down + closing
- —
- Monthly P&I
- —
- Monthly cashflow
- —
- DSCR
- —
- Eligible?
- —
No personal income docs; deal must DSCR.
Hard money
10% down · 12.0% · 12mo
- Down + closing
- —
- Monthly P&I
- —
- Monthly cashflow
- —
- DSCR
- —
- Eligible?
- —
Short-term bridge; refi at stabilization.
Rent comps 40 comps
| Address | Beds | Baths | Sqft | Rent | $/sqft | DOM | Units | Dist |
|---|---|---|---|---|---|---|---|---|
| 4 Greenway Vlg N #203 Royal Palm Beach, FL | 2.0 | 2.0 | 1080 | $2,000 | $1.85 | 24d | 1 | 0.04mi |
| 7 Greenway Vlg N #107 Royal Palm Beach, FL | 1.0 | 1.5 | 780 | $1,650 | $2.12 | 4d | 1 | 0.06mi |
| 7 Greenway Vlg N Royal Palm Beach, FL | 1.0–2.0 | 1.5–2.0 | 930 | $1,700 | $1.83 | 16d | 2 | 0.06mi |
| 2 Greenway Vlg N #210 Royal Palm Beach, FL | 2.0 | 2.0 | 1080 | $2,000 | $1.85 | 24d | 1 | 0.07mi |
| 12002 Poinciana Blvd #204 Royal Palm Beach, FL | 2.0 | 2.0 | 1048 | $1,750 | $1.67 | 24d | 1 | 0.14mi |
| 12007 Poinciana Blvd #205 Royal Palm Beach, FL | 2.0 | 2.0 | 1088 | $1,590 | $1.46 | 14d | 1 | 0.16mi |
| 4 W Greenway Dr Unit 201 Royal Palm Beach, FL | 1.0 | 1.5 | 780 | $1,450 | $1.86 | 24d | 1 | 0.26mi |
| 73 Macadamia Ct Royal Palm Beach, FL | 2.0 | 2.0 | 1112 | $2,000 | $1.80 | 11d | 1 | 0.34mi |
| 120 Sparrow Dr #205 Royal Palm Beach, FL | 2.0 | 2.0 | 793 | $2,200 | $2.77 | 24d | 1 | 0.38mi |
| 120 Sparrow Dr Royal Palm Beach, FL | 2.0 | 2.0–2.5 | 793 | $2,200 | $2.77 | 21d | 2 | 0.38mi |
| 830 Royal Palm Beach Blvd Royal Palm Beach, FL | 3.0 | 2.0 | 1369 | $2,766 | $2.02 | 7d | 1 | 0.52mi |
| 139 Sparrow Dr Royal Palm Beach, FL | 2.0–3.0 | 1.5–2.5 | 1100 | $1,850 | $1.68 | 14d | 3 | 0.55mi |
| 132 Weybridge Cir Royal Palm Beach, FL | 2.0 | 2.5 | 1470 | $3,000 | $2.04 | 24d | 1 | 0.64mi |
| 110 Weybridge Cir Unit A Royal Palm Beach, FL | 2.0 | 2.5 | 1470 | $2,350 | $1.60 | 21d | 1 | 0.65mi |
| 11823 Dahlia Dr Royal Palm Beach, FL | 3.0 | 2.0 | 1385 | $2,406 | $1.74 | 7d | 1 | 0.69mi |
| 201 Seminole Lakes Dr Royal Palm Beach, FL | 1.0 | 1.0 | 800 | $1,400 | $1.75 | 24d | 1 | 0.69mi |
| 263 Deerfield Ct Royal Palm Beach, FL | 2.0 | 2.0 | 1120 | $1,800 | $1.61 | 24d | 1 | 0.72mi |
| 182 Sparrow Dr Unit A Royal Palm Beach, FL | 3.0 | 2.0 | 1485 | $3,000 | $2.02 | 24d | 1 | 0.85mi |
| 280 Crestwood Cir #204 Royal Palm Beach, FL | 2.0 | 2.0 | 1024 | $2,150 | $2.10 | 14d | 1 | 0.90mi |
| 1601 Lakeview Dr W Unit 1601 Royal Palm Beach, FL | 3.0 | 2.5 | 1296 | $2,375 | $1.83 | 21d | 1 | 0.92mi |
| 1049 Grandview Cir Royal Palm Beach, FL | 3.0 | 2.0 | 792 | $3,100 | $3.91 | 17d | 1 | 0.93mi |
| 1407 Lakeview Dr E Royal Palm Beach, FL | 2.0 | 2.0 | 1165 | $2,300 | $1.97 | 7d | 1 | 0.98mi |
| 310 Crestwood Ct N Unit 310 Royal Palm Beach, FL | 2.0 | 2.0 | 1112 | $2,250 | $2.02 | 3d | 1 | 0.99mi |
| 202 Sparrow Dr #1 Royal Palm Beach, FL | 3.0 | 2.0 | 1020 | $2,400 | $2.35 | 24d | 1 | 0.99mi |
| 330 Crestwood Cir #303 Royal Palm Beach, FL | 2.0 | 2.0 | 1306 | $2,150 | $1.65 | 24d | 1 | 1.02mi |
| 500 Crestwood Ct N #517 Royal Palm Beach, FL | 2.0 | 2.0 | 1200 | $2,200 | $1.83 | 18d | 1 | 1.02mi |
| 500 Crestwood Ct N #517 Royal Palm Beach, FL | 2.0 | 2.0 | 1200 | $2,200 | $1.83 | 24d | 1 | 1.02mi |
| 600 Crestwood Ct N #609 Royal Palm Beach, FL | 2.0 | 2.0 | 1112 | $2,250 | $2.02 | 14d | 1 | 1.03mi |
| 210 Sparrow Dr #4 Royal Palm Beach, FL | 2.0 | 2.0 | 930 | $1,900 | $2.04 | 20d | 1 | 1.04mi |
| 300 Crestwood Ct N #310 Royal Palm Beach, FL | 2.0 | 2.0 | 1112 | $2,250 | $2.02 | 3d | 1 | 1.04mi |
| 10863 Dalmany Way Royal Palm Beach, FL | 3.0 | 2.0 | 1232 | $3,500 | $2.84 | 24d | 1 | 1.05mi |
| 200 Crestwood Ct N #211 Royal Palm Beach, FL | 3.0 | 2.0 | 1173 | $2,400 | $2.05 | 24d | 1 | 1.06mi |
| 340 Crestwood Cir #302 Royal Palm Beach, FL | 3.0 | 2.0 | 1306 | $2,550 | $1.95 | 21d | 1 | 1.07mi |
| 118 Bobwhite Rd Royal Palm Beach, FL | 3.0 | 2.0 | 1444 | $3,200 | $2.22 | 17d | 1 | 1.07mi |
| 700 Crestwood Ct S #708 Royal Palm Beach, FL | 2.0 | 2.0 | 1075 | $2,750 | $2.56 | 24d | 1 | 1.07mi |
| 1200 Crestwood Ct S #1212 Royal Palm Beach, FL | 3.0 | 2.0 | 1199 | $2,500 | $2.09 | 24d | 1 | 1.10mi |
| 1000 Crestwood Ct S #1009 Royal Palm Beach, FL | 2.0 | 2.0 | 1112 | $2,200 | $1.98 | 7d | 1 | 1.10mi |
| 1100 Crestwood Ct S #1109 Royal Palm Beach, FL | 2.0 | 2.0 | 1128 | $2,300 | $2.04 | 24d | 1 | 1.13mi |
| 1700 Crestwood Ct S #1708 Royal Palm Beach, FL | 2.0 | 2.0 | 1075 | $2,200 | $2.05 | 2d | 1 | 1.13mi |
| 180 Heatherwood Dr Royal Palm Beach, FL | 3.0 | 2.0 | 1462 | $2,710 | $1.85 | 5d | 1 | 1.16mi |
HOA detail condo
- Monthly dues
- $666 · $7,992/yr
- Assessments
- None detected in remarks — confirm with the listing agent.
Listing history 20 events
-
2026-06-18days on market $139,000 Active 55 DOM
-
2026-06-17days on market $139,000 Active 54 DOM
-
2026-06-16days on market $139,000 Active 53 DOM
-
2026-06-15days on market $139,000 Active 52 DOM
-
2026-06-13days on market $139,000 Active 50 DOM
-
2026-06-09days on market $139,000 Active 46 DOM
-
2026-06-08days on market $139,000 Active 45 DOM
-
2026-06-07days on market $139,000 Active 44 DOM
-
2026-06-04days on market $139,000 Active 41 DOM
-
2026-06-03days on market $139,000 Active 40 DOM
-
2026-06-02days on market $139,000 Active 39 DOM
-
2026-06-01days on market $139,000 Active 38 DOM
-
2026-05-31days on market $139,000 Active 37 DOM
-
2026-04-24$145,000 Active
-
1998-10-21soldstatus $40,000
-
1998-10-20soldstatus $40,000 136-char remark
Show marketing remark (136 chars)
ALL MEASURES APPROXIMATE THE VIEW OF THE LAKE WIIL SELL THIS APARTMENT.EXCELLENT CONDITION TILED KITCHEN AND HALLWAY, DR MIRRORED WALL,4
-
1998-09-01historical 136-char remark
Show marketing remark (136 chars)
ALL MEASURES APPROXIMATE THE VIEW OF THE LAKE WIIL SELL THIS APARTMENT.EXCELLENT CONDITION TILED KITCHEN AND HALLWAY, DR MIRRORED WALL,4
-
1998-05-08$43,000 136-char remark
Show marketing remark (136 chars)
ALL MEASURES APPROXIMATE THE VIEW OF THE LAKE WIIL SELL THIS APARTMENT.EXCELLENT CONDITION TILED KITCHEN AND HALLWAY, DR MIRRORED WALL,4
-
1990-05-01soldstatus $43,500
-
1980-01-01soldstatus $50,500
ⓘ Source: listings_history table (triggers on properties + properties_extension) + one-shot
backfill from property_details.listing_events for pre-trigger history.
Tax reassessment forecast FL · Resets to sale price
- Current annual tax
- $2,290 · $191/mo
- Projected year-2 tax
- $2,290 · $191/mo
- Expected delta
- $0/yr ($0/mo · 0.0%)
ⓘ Screening estimate from a state-policy table — verify with the county assessor before closing.
Climate risk First Street
- Flood 1/10 Low FEMA zone X (unshaded) · 0% chance over 30 yrs
- Wildfire 1/10 Low
- Heat 10/10 Extreme 7 d/yr ≥107°F today · 26 d/yr by 30 yrs out
- Wind 10/10 Extreme 99% chance of damaging wind over 30 yrs
- Air quality 2/10 Low 0 unhealthy d/yr today · 1 by 30 yrs out
Nearby sold comps map
Loading sold comps map…
Walkable amenities ~0.75 mi
Loading nearby amenities…
Taxation est. · year 1
- Rental income
- $24,606
- − Mortgage interest
- −$7,786
- − Property taxes
- −$2,290
- − Insurance
- −$695
- − Repairs & maintenance
- −$1,968
- − Management
- −$1,968
- − HOA
- −$7,992
- − Depreciation
- −$4,044
- Taxable loss
- −$2,138
- Est. tax savings @ 24.0%
- +$513
- After-tax cash flow
- $228/yr
For passive investors: Depreciation is non-cash, so a rental often shows a tax loss while cash-flowing — sheltering income. Rental losses are passive: they offset passive income freely, and up to $25,000/yr can offset ordinary (W-2) income if you actively participate and your MAGI is under $100k (phasing out to $0 by $150k); unused losses carry forward. On sale, claimed depreciation is recaptured at up to 25%, and gains may owe capital-gains tax (a 1031 exchange can defer both). Figures are a year-1 estimate at your 24.0% rate — not tax advice; consult a CPA.
Schools (NCES district)
- District
- Palm Beach
- NCES district ID
- 1201500
- Math proficiency
- 46% ▼ -16.00%
- Reading proficiency
- 53% ▼ -4.00%
- Median HH income
- $53,943
- Composite
- 42.72/100
- National rank
- #3160
- State rank
- #34 of 73 in FL
Livability — Royal Palm Beach
- Score
- 79/100
- State rank
- #135
- US rank
- #2039
Category grades
Schools grade is shown separately in the Schools card above.
Census & demographics
- Census place
- Royal Palm Beach, FL
- County
- Palm Beach County · 1,438,312 people
- City population
- 75,299
- Metro
- Miami-Fort Lauderdale-Pompano Beach, FL
- Population (ZIP)
- 76,863
- Household income
- $92,591
- Rent vs Own
- Severe rent burden
- 1870.0
Population outlook (Palm Beach County) Hauer SSP2
- Today (2025)
- 1,637,487 people
- By 2030
- 1,743,255 · +6.5%
- By 2040
- 1,948,712 · +19.0%
- By 2050
- 2,132,979 · +30.3%
- By 2075
- 2,530,027 · +54.5%
- By 2100
- 2,706,979 · +65.3%
Race, ethnicity, and origin ACS 2023
- Neighborhood character
- Diverse neighborhood (Simpson 0.70)
- Race & ethnicity
- White 44% Hispanic / Latino 24% Black 23% Two or more races 16% Asian 5%
- Hispanic origin (detail)
- Mexican 2% Puerto Rican 5% Cuban 4% Dominican 2%
- Common ancestry
- Hispanic 6% Romanian 2% Italian 1%
- Foreign-born
- 26% · Canada, Jamaica, China
- Languages at home
- 73% English-only · Spanish 17% French/Haitian/Cajun 4% Other Indo-European 2%
Political lean MEDSL · Palm Beach
- 2024 margin
- Toss-up / Even · D 50.0% · R 49.2%
- 2008→2024 swing
- -22.1pp toward R · 2008: 22.9pp · 2024: 0.8pp
- All cycles
- 2024: D+0.8 2020: D+12.8 2016: D+15.3 2012: D+17.0 2008: D+22.9
Not yet ingested
- Civics
- —
Market trends
- HPI YoY
- ▲ 17.04%
- Current HPI
- 903.78
- Rent YoY
- ▲ 0.85%
- Metro
- Miami-Fort Lauderdale-Pompano Beach, FL
- State GDP YoY
- ▲ 3.28%
- F500 in state
- 36
Industry mix (Fortune 500 HQ in FL)
| Industry | F500 HQs | Revenue |
|---|---|---|
| Industrial Technology | 2 | $29B |
|
||
| Insurance | 2 | $17B |
|
||
| Retail | 1 | $60B |
|
||
| Technology Distribution | 1 | $58B |
|
||
| Homebuilding | 1 | $35B |
|
||
| Technology Manufacturing | 1 | $35B |
|
||
Price history
+187.1% since first listed7 events — show timeline
- 2026-04-24 Listed $145,000 Beaches MLS
- 1998-10-21 Sold (Public Records) $40,000 Public Records
- 1998-10-20 Sold (MLS) $40,000 Beaches MLS
- 1998-09-01 Listing Removed — Beaches MLS
- 1998-05-08 Listed $43,000 Beaches MLS
- 1990-05-01 Sold (Public Records) $43,500 Public Records
- 1980-01-01 Sold (Public Records) $50,500 Public Records
Property tax history
+17.9%/yrLatest (2025): $2,290 · +6.2% YoY. Source: county tax records.
Cash-flow waterfall
monthlySold comps — $/sqft
last 12 mo · ≤1 miLoading sold comps…