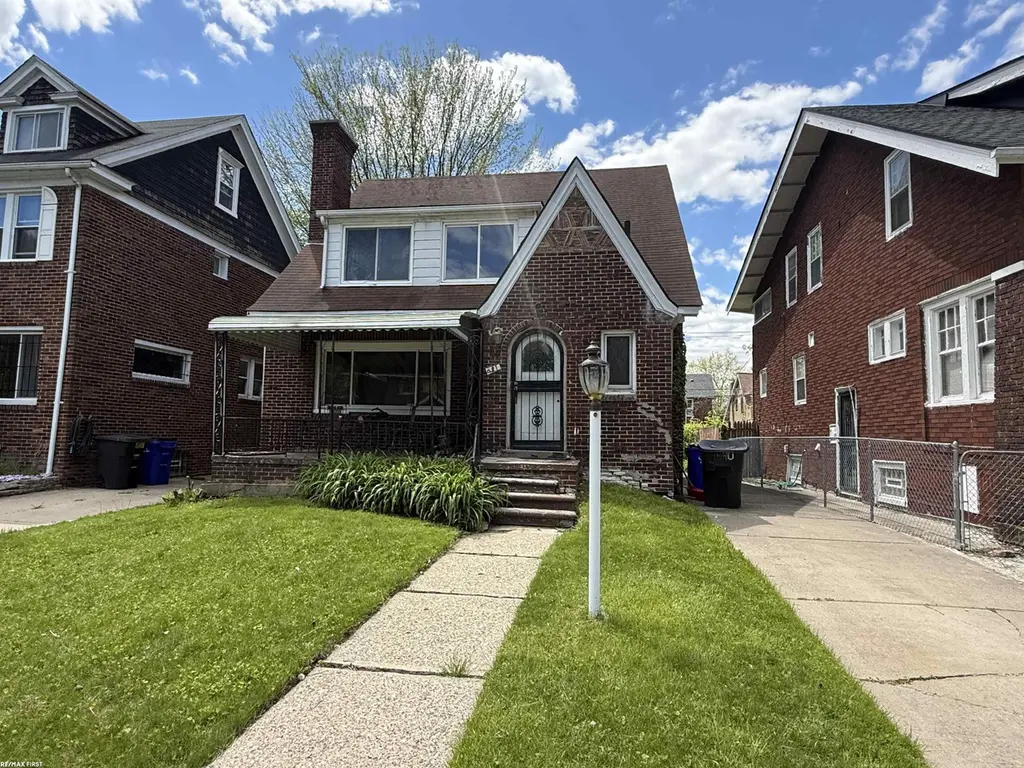
591 Chalmers St · Detroit, MI
Flood risk 6/10 · Moderate
- FEMA flood zone
- AE
- Chance of flooding over 30 yrs
- 0.74%
- Est. flood insurance / yr
- $2,026 – $9,024
Fire risk 1/10 · Minimal
- Est. fire insurance / yr
- $784 – $1,456
Heat risk 3/10 · Minor
- Hot days now (above 96°F)
- 7 days/yr
- Hot days in 30 yrs
- 15 days/yr
Wind risk 2/10 · Minimal
- Chance of severe wind over 30 yrs
- —
Air-quality risk 3/10 · Minor
- Unhealthy air days now
- 3 days/yr
- Unhealthy air days in 30 yrs
- 4 days/yr
Risk factors via First Street. Map © Google.
Why this score? — see what drove the B- grade
The composite is a weighted blend of 9 inputs, each scored 0–100. Each bar is that input's sub-score; the figure is the points it added to the 100-point composite (weight × sub-score).
- Cash flow +30.0/30.0
- 1% rule +10.0/10.0
- DSCR +10.0/10.0
- ARV discount +7.5/15.0
- Livability +3.7/5.0
- Rent growth +2.5/5.0
- Condition / age +2.5/5.0
- Schools +1.3/10.0
- Appreciation +0.0/10.0
$39,900
🖨 Deal sheet 📄 Offer letter ✓ Due diligence
Listing remarks MLS
High & Best Due Sunday 5/17/26 at 3pm. Estate Sale. This 3 Bedroom 1.5 Bath Brick Colonial has tons of potential. Almost 1600 sq ft. Prime Location in Jefferson/Chalmers neighborhood. Just minutes to the Detroit River! Fenced in yard. Home needs work & is priced to sell. Set your showing today.
Key facts
- Brick colonial
- Prime location
- Fenced in yard
Tags
Property features AI
Finance
- HOA & community: Homeowners association present
Exterior
- Parking: On-street parking; Assigned parking
- Utilities: Public water; Public sewer
- Home design: Single-family residence; Two levels
- Construction: Brick construction; Block foundation; Built above grade (finished area approximately 1,556)
- Exterior features: Front porch; Fenced lot; Paved road access
Interior
- Kitchen: Gas water heater
- Bedrooms: Total rooms: 3
- Flooring: Hardwood floors
- Bathrooms: 1 full bathroom; 1 half bathroom
- Heating & cooling: Forced air heating (natural gas); Central air conditioning; Ceiling fans
- Interior features: High ceilings; High-speed internet; Wood-burning fireplace in the living room; Full basement with block foundation
- Laundry & utility: Gas water heater
Neighborhood map
What this means for you Summary
Snapshot
- This is a 3-bed/1.5-bath single-family listed at $40k.
Deal economics
- At list price, monthly cash flow is $422 ($5k/yr) — positive.
- The deal already cash-flows at list — no discount required.
- Meets the 1% rule at list price ($1k rent vs $40k).
- Cap rate 32.8% vs local median 10.2% in Detroit — top-decile yield for the area; either an underpriced asset or a hidden risk that comps aren't pricing in. Stress-test before assuming the spread holds.
Location & tenants
- Location reads 73/100 on livability (#218 in MI) — a middle-class / working-renter tenant base. Strengths: amenities A+, commute A+, cost of living A+; Watch: schools F, crime F, employment F.
- Detroit Public Schools Community District (urban): math 10% / reading 24% proficiency, ranked #499 of 540 in MI (top 92%) — low school quality limits family demand, transient renter base, plan for 1-2y turnover; 90% free/reduced lunch — lower-income household profile, screen leases tightly.
- Market conditions: 137 active listings in the ZIP; 9 comparable units currently listed for rent nearby; rentals at typical pace (median 18d on market — plan ~3-4 weeks tenant-placement turnaround); 2,639 units permitted in Wayne County in 2024 (1,216 in 5+ unit buildings).
Forward outlook
- Local home prices are declining (-3.0%/yr); year-one equity from $276 of loan paydown is wiped out by about $1k of value loss. Plan a longer hold.
- Wayne County population projected at -17% by 2050 — secular population decline; favor cash flow + early exit over multi-decade hold.
- At projected returns (-3.0% appreciation + 3.0% rent growth), your $11k cash investment doubles in ~3 years — after that, you're playing with house money.
Negotiation context
- Only 3 days on market — expect competitive offers; lowballing is unlikely to land.
- 5 sale attempts since 20y ago with the ask held roughly flat each time — persistent listings suggest the price (not the market) is what's stuck; bring a comps-based counter.
Risks & watch-outs
- Watch-outs: flood insurance adds $460/mo; built in 1926 — expect roof / HVAC / electrical / plumbing capex.
- Climate carrying-cost: in FEMA flood zone AE (mandatory federal flood insurance) — expect insurance premiums to compound above CPI over the hold.
Questions for the listing agent
- Built in 1926 — when were the roof, HVAC, electrical panel, plumbing, and water heater last replaced?
- What's the actual annual flood-insurance premium (NFIP or private), and is the property in a SFHA with mandatory coverage?
- Is there a deadline driving the sale (1031 exchange, divorce, estate, relocation)? That informs how much negotiation room exists.
- Schools are F-rated, which usually means shorter tenancies and higher turnover. Who's the typical renter profile here, and what's been the actual vacancy rate?
- Crime grade is F in this area — have there been break-ins, vandalism, or insurance claims at this property in the last 3 years? What carrier currently insures it and at what premium?
- What's the average days-on-market for RENTAL listings here right now (not sales)? A rising rental-DOM trend means longer vacancies and softer asking-rent achievability than the comps imply.
- What's the recent tenant-quality profile in this submarket — average credit score on applications, eviction rate, late-payment / NSF rate, and stable-employment percentage? A property-management company in the area should have these aggregated.
- How much new for-sale + rental construction is in the pipeline within 1–3 miles? Heavy new supply typically softens prices + rents 12–24 months out; constrained supply supports both.
Investment metrics
- 1% rule
- 3.62% ✓
- Cap rate
- 32.84%
- Cash-on-cash
- 94.80%
- DSCR
- 5.22
- GRM
- 2.3
CMA / ARV
- ARV (median comp)
- $190,774
- List price
- $39,900
- Delta
- -79.09%
- Verdict
- UNDERPRICED
- Comps
- 20 within 1.0 mi
Show comp detail 12 sales within ~0.75 mi
| Address | Dist | Beds/Ba | Sqft | Sold | Price | $/sf | Match |
|---|---|---|---|---|---|---|---|
| 591 Chalmers St | 0.00mi | 3/1.5 | 1,556 (0%) | 1mo | $50,000 | $32 | 99 |
| 847 Barrington Rd | 0.36mi | 2/1.5 (-1) | 1,586 (+2%) | 6mo | $338,000 | $213 | 69 |
| 319 Marlborough St | 0.38mi | 3/1.0 | 1,610 (+4%) | 9mo | $80,000 | $50 | 67 |
| 976 Lakepointe St | 0.61mi | 3/1.5 | 1,582 (+2%) | 4mo | $412,500 | $261 | 65 |
| 220 Newport St | 0.56mi | 3/1.5 | 1,518 (-2%) | 6mo | $246,000 | $162 | 65 |
| 605 Lakewood St | 0.07mi | 2/1.0 (-1) | 1,374 (-12%) | 6mo | $89,900 | $65 | 65 |
| 221 Chalmers St | 0.55mi | 4/2.0 (+1) | 1,560 (+0%) | 7mo | $189,000 | $121 | 61 |
| 883 Lakepointe St | 0.50mi | 3/1.5 | 1,734 (+11%) | 2mo | $475,000 | $274 | 56 |
| 785 Barrington Rd | 0.37mi | 2/1.0 (-1) | 1,369 (-12%) | 2mo | $296,000 | $216 | 54 |
| 1060 Chalmers St | 0.42mi | 4/1.5 (+1) | 1,368 (-12%) | 8mo | $36,890 | $27 | 49 |
| 1075 Wayburn St | 0.71mi | 3/1.0 | 1,400 (-10%) | 8mo | $275,000 | $196 | 41 |
| 1315 Newport St | 0.66mi | 4/1.0 (+1) | 1,364 (-12%) | 0mo | $10,000 | $7 | 41 |
Match score weights: distance 35% · size 25% · config 20% · recency 20%. Top-matched comps best support the ARV.
Projected returns pro-forma
-3.0% appreciation · 3.0% rent growth · sell at horizon
- IRR
- 42.8%
- Equity multiple
- 2.85×
- Total profit
- $20,718
- Equity at exit
- $5,949
- IRR
- 49.1%
- Equity multiple
- 5.82×
- Total profit
- $53,859
- Equity at exit
- $3,450
Cash invested: $11,172 (down + closing). Projections, not guarantees.
Landlord ↔ Tenant lean methodology
- Overall (STATE)
- 62 Landlord-Friendly
- State Michigan
- 62 Landlord-Friendly · EVEN
- County
- — inherits STATE
- City
- — inherits STATE
ZIP-level market 48215
- Home prices YoY
- -24.1%
- Active inventory
- 137
- Price-to-rent
- 2.3×
Monthly cashflow live
- Estimated rent
- $1,444 high interval (Pro) →
- Mortgage (P&I)
- −$209
- Tax from tax record
- −$32 /mo · $384/yr
- Insurance
- −$17
- Flood insurance flood zone
- −$460 /mo · $5,525/yr
- HOA
- −$0
- Vacancy / Maint / Mgmt
- −$303
- Net cashflow
- $422
Break-even live
UW: 25.0% down · 7.5% · 30yr · 1.5% tax · 5.0% vac · 8.0% maint · 8.0% mgmt
Financing live
Cash to close
- Down payment
- $9,975
- Closing costs
- $1,197
- Reserves months
- —
- Total cash needed
- —
Loan-product check · same deal, 3 products live
Conventional
25% down · 7.5% · 30yr
- Down + closing
- —
- Monthly P&I
- —
- Monthly cashflow
- —
- DSCR
- —
- Eligible?
- —
Personal DTI + credit; lowest rate.
DSCR
20% down · 8.5% · 30yr
- Down + closing
- —
- Monthly P&I
- —
- Monthly cashflow
- —
- DSCR
- —
- Eligible?
- —
No personal income docs; deal must DSCR.
Hard money
10% down · 12.0% · 12mo
- Down + closing
- —
- Monthly P&I
- —
- Monthly cashflow
- —
- DSCR
- —
- Eligible?
- —
Short-term bridge; refi at stabilization.
Rent comps 9 comps
| Address | Beds | Baths | Sqft | Rent | $/sqft | DOM | Units | Dist |
|---|---|---|---|---|---|---|---|---|
| 875 Philip St Detroit, MI | 3.0 | 1.0 | 1353 | $1,400 | $1.03 | 43d | 1 | 0.33mi |
| 734 Ashland St Detroit, MI | 3.0 | 1.0 | 1110 | $1,300 | $1.17 | 22d | 1 | 0.34mi |
| 734 Ashland St Detroit, MI | 3.0 | 1.0 | 1110 | $1,300 | $1.17 | 24d | 1 | 0.34mi |
| 13010 Avondale St Detroit, MI | 1.0–2.0 | 1.0–2.0 | 1003 | $1,725 | $1.72 | 1d | 1 | 0.47mi |
| 861 Beaconsfield Ave Grosse Pointe Park, MI | 2.0 | 1.0 | 1300 | $1,500 | $1.15 | 12d | 1 | 0.57mi |
| 832 Harcourt Rd Grosse Pointe Park, MI | 2.0 | 2.5 | 1675 | $1,850 | $1.10 | 2d | 1 | 1.03mi |
| 1236 Beaconsfield Ave Unit 1 Grosse Pointe Park, MI | 2.0 | 1.0 | 1100 | $1,600 | $1.45 | 24d | 1 | 1.05mi |
| 1334 Maryland St Grosse Pointe Park, MI | 2.0 | 1.0 | 1786 | $1,200 | $0.67 | 18d | 1 | 1.10mi |
| 1312 Somerset Ave Grosse Pointe Park, MI | 2.0 | 1.0 | 1200 | $1,400 | $1.17 | 16d | 1 | 1.19mi |
Listing history 11 events
-
2026-05-18status Pending 307-char remark
Show marketing remark (307 chars)
High & Best Due Sunday 5/17/26 at 3pm. Estate Sale. This 3 Bedroom 1.5 Bath Brick Colonial has tons of potential. Almost 1600 sq ft. Prime Location in Jefferson/Chalmers neighborhood. Just minutes to the Detroit River! Fenced in yard. Home needs work & is priced to sell. Set your showing today.
-
2026-05-15$39,900 Active 307-char remark
Show marketing remark (307 chars)
High & Best Due Sunday 5/17/26 at 3pm. Estate Sale. This 3 Bedroom 1.5 Bath Brick Colonial has tons of potential. Almost 1600 sq ft. Prime Location in Jefferson/Chalmers neighborhood. Just minutes to the Detroit River! Fenced in yard. Home needs work & is priced to sell. Set your showing today.
-
2009-09-10soldstatus $9,000
Show marketing remark (193 chars)
GREAT INVESTMENT OPPERTUNITY! THIS IS A BRICK, 2 STORY BUNGALOW WITH 3 BEDROOMS, 1 FULL BATH AND 1 LAV. , A NATURAL FIRPLACE IN THE LIVINGROOM, FLORIDA ROOM, BASEMENT, PATIO AND FENCED IN YARD.
-
2009-08-06$9,000
Show marketing remark (193 chars)
GREAT INVESTMENT OPPERTUNITY! THIS IS A BRICK, 2 STORY BUNGALOW WITH 3 BEDROOMS, 1 FULL BATH AND 1 LAV. , A NATURAL FIRPLACE IN THE LIVINGROOM, FLORIDA ROOM, BASEMENT, PATIO AND FENCED IN YARD.
-
2007-01-30soldstatus $34,000
-
2007-01-30soldstatus $34,000
-
2006-12-21historical
-
2006-11-01$33,900
-
2006-11-01$33,900
ⓘ Source: listings_history table (triggers on properties + properties_extension) + one-shot
backfill from property_details.listing_events for pre-trigger history.
Tax reassessment forecast MI · Partial reset (capped growth)
- Current annual tax
- $384 · $32/mo
- Projected year-2 tax
- $499 · $42/mo
- Expected delta
- +$115/yr (+$10/mo · 29.9%)
ⓘ Screening estimate from a state-policy table — verify with the county assessor before closing.
Climate risk First Street
- Flood 6/10 Major FEMA zone AE · 74% chance over 30 yrs
- Wildfire 1/10 Low
- Heat 3/10 Moderate 7 d/yr ≥96°F today · 15 d/yr by 30 yrs out
- Wind 2/10 Low
- Air quality 3/10 Moderate 3 unhealthy d/yr today · 4 by 30 yrs out
Nearby sold comps map
Loading sold comps map…
Walkable amenities ~0.75 mi
Loading nearby amenities…
Taxation est. · year 1
- Rental income
- $17,324
- − Mortgage interest
- −$2,235
- − Property taxes
- −$384
- − Insurance
- −$5,724
- − Repairs & maintenance
- −$1,386
- − Management
- −$1,386
- − Depreciation
- −$1,161
- Taxable income
- $5,048
- Est. tax owed @ 24.0%
- −$1,211
- After-tax cash flow
- $3,855/yr
For passive investors: Depreciation is non-cash, so a rental often shows a tax loss while cash-flowing — sheltering income. Rental losses are passive: they offset passive income freely, and up to $25,000/yr can offset ordinary (W-2) income if you actively participate and your MAGI is under $100k (phasing out to $0 by $150k); unused losses carry forward. On sale, claimed depreciation is recaptured at up to 25%, and gains may owe capital-gains tax (a 1031 exchange can defer both). Figures are a year-1 estimate at your 24.0% rate — not tax advice; consult a CPA.
Schools (NCES district)
- District
- Detroit Public Schools Community District
- NCES district ID
- 2601103
- Math proficiency
- 10% ▼ -2.00%
- Reading proficiency
- 24% ▲ 6.00%
- Median HH income
- $25,815
- Composite
- 13.06/100
- National rank
- #9564
- State rank
- #499 of 540 in MI
Livability — Detroit
- Score
- 73/100
- State rank
- #218
- US rank
- #5427
Category grades
Schools grade is shown separately in the Schools card above.
Census & demographics
- Census place
- Detroit, MI
- City population
- 572,865
- Population (ZIP)
- 10,238
Population outlook (Wayne County) Hauer SSP2
- Today (2025)
- 1,675,273 people
- By 2030
- 1,620,300 · -3.3%
- By 2040
- 1,502,341 · -10.3%
- By 2050
- 1,384,039 · -17.4%
- By 2075
- 1,124,592 · -32.9%
- By 2100
- 881,193 · -47.4%
Race, ethnicity, and origin ACS 2023
- Neighborhood character
- Predominantly Black (87%)
- Race & ethnicity
- Black 87% White 9% Two or more races 2% Hispanic / Latino 2%
- Common ancestry
- Romanian 1% Slovak 1% Lithuanian 1%
- Foreign-born
- 1% · Canada
- Languages at home
- 99% English-only · Spanish 1%
Political lean MEDSL · Wayne
- 2024 margin
- Strong D (+29.0) · D 62.7% · R 33.7% · Other 3.6%
- 2008→2024 swing
- -20.5pp toward R · 2008: 49.5pp · 2024: 29.0pp
- All cycles
- 2024: D+29.0 2020: D+38.1 2016: D+37.3 2012: D+46.9 2008: D+49.5
Not yet ingested
- Civics
- —
Market trends
- HPI YoY
- ▼ -60.84%
- Current HPI
- 191.0405
- Rent YoY
- —
- Metro
- —
- State GDP YoY
- ▲ 1.37%
- F500 in state
- 28
Industry mix (Fortune 500 HQ in MI)
| Industry | F500 HQs | Revenue |
|---|---|---|
| Automotive Parts | 3 | $48B |
|
||
| Automotive | 2 | $372B |
|
||
| Chemicals | 1 | $45B |
|
||
| Automotive Retail | 1 | $29B |
|
||
| Healthcare / Medical Devices | 1 | $23B |
|
||
| Automotive Technology | 1 | $20B |
|
||
Price history
+47.5% since first listed13 events — show timeline
- 2026-05-28 Sold (MLS) $50,000 REALCOMP
- 2026-05-28 Sold (MLS) $50,000 MiRealSource-MiMLS
- 2026-05-18 Pending — REALCOMP
- 2026-05-18 Pending — MiRealSource-MiMLS
- 2026-05-15 Listed $39,900 REALCOMP
- 2026-05-15 Listed $39,900 MiRealSource-MiMLS
- 2009-09-10 Sold (MLS) $9,000 REALCOMP
- 2009-08-06 Listed $9,000 REALCOMP
- 2007-01-30 Sold (MLS) $34,000 MiRealSource-MiMLS
- 2007-01-30 Sold (MLS) $34,000 REALCOMP
- 2006-12-21 Listing Removed — MiRealSource-MiMLS
- 2006-11-01 Listed $33,900 MiRealSource-MiMLS
- 2006-11-01 Listed $33,900 REALCOMP
Property tax history
+1.0%/yrLatest (2025): $384 · +2.1% YoY. Source: county tax records.
Cash-flow waterfall
monthlySold comps — $/sqft
last 12 mo · ≤1 miLoading sold comps…