2626 Holly Hall St #409 · Houston, TX
Flood risk 8/10 · Major
- FEMA flood zone
- X (unshaded)
- Chance of flooding over 30 yrs
- 0.99%
- Est. flood insurance / yr
- $507 – $1,088
Fire risk 1/10 · Minimal
- Est. fire insurance / yr
- $1,222 – $2,270
Heat risk 9/10 · Severe
- Hot days now (above 109°F)
- 7 days/yr
- Hot days in 30 yrs
- 23 days/yr
Wind risk 9/10 · Severe
- Chance of severe wind over 30 yrs
- 99.0%
Air-quality risk 2/10 · Minimal
- Unhealthy air days now
- 2 days/yr
- Unhealthy air days in 30 yrs
- 2 days/yr
Risk factors via First Street. Map © Google.
Why this score? — see what drove the C grade
The composite is a weighted blend of 9 inputs, each scored 0–100. Each bar is that input's sub-score; the figure is the points it added to the 100-point composite (weight × sub-score).
- ARV discount +15.0/15.0
- Cash flow +14.0/30.0
- 1% rule +9.3/10.0
- DSCR +4.3/10.0
- Livability +3.7/5.0
- Appreciation +2.7/10.0
- Schools +2.7/10.0
- Condition / age +2.5/5.0
- Rent growth +1.8/5.0
$75,000
🖨 Deal sheet (PDF) 📄 Offer letter ✓ Due diligence
Listing remarks
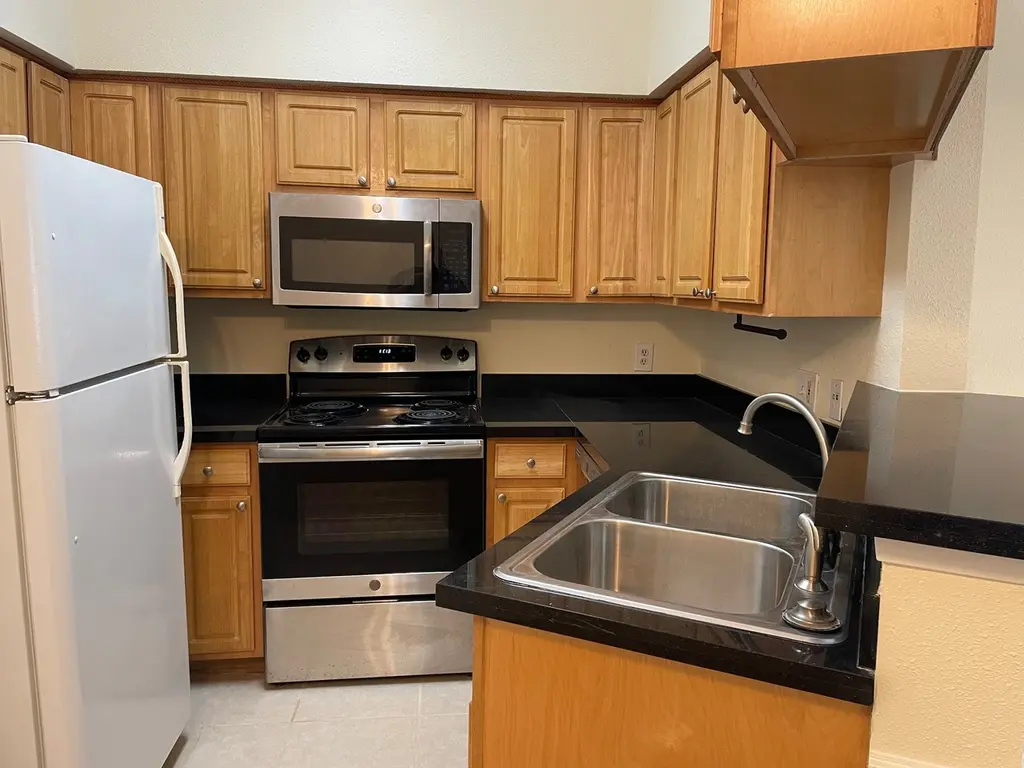
1 Bedroom / 1 Bath unit for lease on Holly Hall off Almeda, minutes from the medical center. Fully remodeled recently, ground floor, No stairs to climb. Comes with refrigerator + in-unit Washer and Dryer. New tile floor and granite countertop in kitchen. New wood flooring in living / dining/ corridor/ bedroom. Remodeled bathroom with new faucet, shower/tub and granite countertop. Tiled backyard space for BBQ.
Key facts
- Fully remodeled
- Remodeled bathroom
- Ground floor
Tags
Property features AI
Finance
- HOA & community: Association name: Feld; Monthly association fee of $285; Association fee includes water and sewer; Association amenities: Pool, Gated; Community features: Community pool
Exterior
- Parking: Assigned parking; Controlled entrance
- Security: Security gate; Owned security system; Smoke detectors
- Utilities: Public water; Public sewer
- Home design: Residential property; 2 total stories; Built in 1984; Full ownership; Slab foundation
- Construction: Cement siding; Composition roof
- Exterior features: Community pool (association); Concrete road surface
Interior
- Kitchen: Electric cooktop; Electric oven; Electric range; Microwave; Dishwasher; Disposal; Refrigerator; Breakfast bar; Granite counters
- Bedrooms: Bedroom on first floor (approx. 14x12)
- Flooring: Tile; Vinyl
- Bathrooms: 1 full bathroom
- Heating & cooling: Central heating (electric); Central air (electric)
- Interior features: Breakfast bar; Granite counters; Soaking tub; Tub with shower; Ceiling fans; Seller disclosure
- Laundry & utility: Washer; Dryer; Laundry in utility room
Neighborhood map
What this means for you Summary
Snapshot
- This is a 1-bed/1.0-bath condo listed at $75k.
Deal economics
- At list price, monthly cash flow is $-57 ($-678/yr) — negative.
- To cash-flow at today's rent, offer at most $65k (13.3% below list).
- Meets the 1% rule at list price ($1k rent vs $75k).
- Recommended offer: $65k (13.3% below list) — sets the bar for cash-flow.
- Cap rate 6.5% vs local median 3.2% in Houston — top-decile yield for the area; either an underpriced asset or a hidden risk that comps aren't pricing in. Stress-test before assuming the spread holds.
Location & tenants
- Location reads 74/100 on livability (#184 in TX, #4,771 nationally) — a middle-class / working-renter tenant base. Strengths: amenities A+, cost of living A+, housing A+; Watch: crime F.
- Houston ISD (urban): math 27% / reading 35% proficiency, ranked #593 of 826 in TX (top 72%) — families likely to look elsewhere, expect single-tenant / working-renter base with shorter leases; 71% free/reduced lunch — lower-income household profile, screen leases tightly.
- Zoned schools: Cullen Middle (math 6% / reading 14%, grade F, #1,641 of 1,662 statewide, top 99%, 324 students, 100% FRL); Yates H S (math 12% / reading 23%, grade F, #1,451 of 1,632 statewide, top 89%, 851 students, 96% FRL) — zoned schools average 98% FRL vs 71% district-wide (27 pts higher); higher-poverty schools than district average — tighter screening recommended.
- Zoned-school proficiency averages 14% at this address vs 31% district-wide (-17 pts) — the specific schools serving this property underperform the Houston ISD average; the district grade overstates school quality for this exact location.
- Market conditions: Rents soft (-2.8%/yr); 268 active listings in the ZIP; 40 comparable units currently listed for rent nearby; rentals leasing fast (median 12d on market — plan ~1-2 weeks tenant-placement turnaround); 29,883 units permitted in Harris County in 2024 (8,621 in 5+ unit buildings).
Forward outlook
- Local home prices are declining (-3.0%/yr); year-one equity from $519 of loan paydown is wiped out by about $2k of value loss. Plan a longer hold.
- Harris County population projected at +47% by 2050 — long-run rental-demand tailwind backs the buy-and-hold thesis.
Negotiation context
- It's been on market 55 days — a 3% lower offer ($73k) is reasonable based on typical stale-listing flexibility.
- 12 sale attempts since 13y ago; this cycle's ask is 7795% above the opening price — seller raised mid-cycle; expect resistance to lowballs.
- Current owner paid $28k; list at $75k implies a 168% gain — meaningful room to come down on a strong offer.
Risks & watch-outs
- Watch-outs: flood insurance adds $66/mo; HOA is 27% of rent.
- Climate carrying-cost: severe flood risk; severe wind risk, 99% chance of damaging wind over 30y; extreme-heat days projected 7→23/yr by 2055 (HVAC capex compounding) — expect insurance premiums to compound above CPI over the hold.
Questions for the listing agent
- What do current leases actually rent for vs. the listed asking? Can we see a recent rent roll and the last 12 months of T-12 income?
- It's been on market 55 days. Have you received any prior offers? Is the seller open to a 13% concession, seller financing, or rate buy-down credit?
- What's the actual annual flood-insurance premium (NFIP or private), and is the property in a SFHA with mandatory coverage?
- What does the HOA fee cover, when was the last increase, and are there any pending special assessments or reserve-fund shortfalls?
- Any open or pending special assessments — roof, HVAC, plumbing, elevator, façade? What's the per-unit balance and payoff schedule, and is the seller paying it off at close or rolling it to the buyer?
- Is there a deadline driving the sale (1031 exchange, divorce, estate, relocation)? That informs how much negotiation room exists.
- Schools are D-rated, which usually means shorter tenancies and higher turnover. Who's the typical renter profile here, and what's been the actual vacancy rate?
- Crime grade is F in this area — have there been break-ins, vandalism, or insurance claims at this property in the last 3 years? What carrier currently insures it and at what premium?
- What's the average days-on-market for RENTAL listings here right now (not sales)? A rising rental-DOM trend means longer vacancies and softer asking-rent achievability than the comps imply.
- What's the recent tenant-quality profile in this submarket — average credit score on applications, eviction rate, late-payment / NSF rate, and stable-employment percentage? A property-management company in the area should have these aggregated.
- How much new apartment / multifamily construction is in the pipeline within 1–3 miles? Heavy new supply (>2% of stock underway) typically softens rents 12–24 months out; light construction supports rent growth.
Investment metrics
- 1% rule
- 1.43% ✓
- Cap rate
- 6.45%
- Cash-on-cash
- 0.57%
- DSCR
- 1.03
- GRM
- 5.8
CMA / ARV
- ARV (median comp)
- $91,189
- List price
- $75,000
- Delta
- -17.75%
- Verdict
- UNDERPRICED
- Comps
- 20 within 1.0 mi
Projected returns pro-forma
-3.0% appreciation · 0.0% rent growth · sell at horizon
- IRR
- -27.7%
- Equity multiple
- 0.11×
- Total profit
- $-18,651
- Equity at exit
- $11,183
- IRR
- -66.9%
- Equity multiple
- -0.52×
- Total profit
- $-32,021
- Equity at exit
- $6,485
Cash invested: $21,000 (down + closing). Projections, not guarantees.
Landlord ↔ Tenant lean methodology
- Overall (STATE)
- 87 Strongly Landlord-Friendly
- State Texas
- 87 Strongly Landlord-Friendly · R+5
- County
- — inherits STATE
- City
- — inherits STATE
ZIP-level market 77054
- Home prices YoY
- -2.6%
- Rents YoY
- -2.8%
- Active inventory
- 268
- Price-to-rent
- 5.8×
Monthly cashflow live
- Estimated rent
- $1,075 high interval (Pro) →
- Mortgage (P&I)
- −$393
- Tax from tax record
- −$130 /mo · $1,559/yr
- Insurance
- −$31
- Flood insurance flood zone
- −$66 /mo · $798/yr
- HOA
- −$285
- Vacancy / Maint / Mgmt
- −$226
- Net cashflow
- $-57
Break-even live
Sensitivity live
| Price | -10% $-14 | -5% $-35 | +0% $-57 | +5% $-78 | +10% $-99 |
|---|---|---|---|---|---|
| Rent | -10% $-141 | -5% $-99 | +0% $-57 | +5% $-14 | +10% $28 |
| Rate | -1.0pp $-19 | -0.5pp $-37 | base $-57 | +0.5pp $-76 | +1.0pp $-96 |
UW: 25.0% down · 7.5% · 30yr · 1.5% tax · 5.0% vac · 8.0% maint · 8.0% mgmt
Financing live
Cash to close
- Down payment
- $18,750
- Closing costs
- $2,250
- Reserves months
- —
- Total cash needed
- —
Loan-product check · same deal, 3 products live
Conventional
25% down · 7.5% · 30yr
- Down + closing
- —
- Monthly P&I
- —
- Monthly cashflow
- —
- DSCR
- —
- Eligible?
- —
Personal DTI + credit; lowest rate.
DSCR
20% down · 8.5% · 30yr
- Down + closing
- —
- Monthly P&I
- —
- Monthly cashflow
- —
- DSCR
- —
- Eligible?
- —
No personal income docs; deal must DSCR.
Hard money
10% down · 12.0% · 12mo
- Down + closing
- —
- Monthly P&I
- —
- Monthly cashflow
- —
- DSCR
- —
- Eligible?
- —
Short-term bridge; refi at stabilization.
Rent comps 40 comps
| Address | Beds | Baths | Sqft | Rent | $/sqft | DOM | Units | Dist |
|---|---|---|---|---|---|---|---|---|
| 2750 Holly Hall St Houston, TX | 1.0–2.0 | 1.0–2.0 | 704 | $850 | $1.21 | 2d | 12 | 0.17mi |
| 8401 Almeda Rd Houston, TX | 1.0 | 1.0 | 694 | $1,265 | $1.82 | 24d | 1 | 0.19mi |
| 8380 El Mundo St Houston, TX | 1.0–2.0 | 1.0–2.0 | 712 | $964 | $1.35 | 2d | 28 | 0.21mi |
| 8383 El Mundo St Unit 1174 Houston, TX | 1.0 | 1.0 | 737 | $1,188 | $1.61 | 11d | 1 | 0.21mi |
| 8383 El Mundo St Unit 8457 Houston, TX | 1.0 | 1.0 | 737 | $1,187 | $1.61 | 11d | 1 | 0.21mi |
| 8383 El Mundo St Unit 1148 Houston, TX | 1.0 | 1.0 | 737 | $1,145 | $1.55 | 3d | 1 | 0.21mi |
| 8383 El Mundo St Apt 321 Houston, TX | 1.0 | 1.0 | 737 | $1,148 | $1.56 | 8d | 1 | 0.21mi |
| 8383 El Mundo St Unit 8404 Houston, TX | 1.0 | 1.0 | 737 | $1,297 | $1.76 | 14d | 1 | 0.21mi |
| 8383 El Mundo St Houston, TX | 1.0 | 1.0 | 737 | $1,292 | $1.75 | 14d | 1 | 0.27mi |
| 7901 Cambridge St Houston, TX | 1.0 | 1.0 | 529 | $1,150 | $2.17 | 44d | 6 | 0.49mi |
| 7901 Cambridge St Houston, TX | 1.0 | 1.0 | 432 | $1,100 | $2.55 | 22d | 5 | 0.49mi |
| 2117 Holly Hall St Houston, TX | 1.0 | 1.0 | 654 | $1,000 | $1.53 | 24d | 1 | 0.49mi |
| 2256 Holly Hall St Houston, TX | 1.0 | 1.0 | 706 | $947 | $1.34 | 22d | 1 | 0.52mi |
| 2256 Holly Hall St Houston, TX | 1.0 | 1.0 | 706 | $947 | $1.34 | 18d | 1 | 0.52mi |
| 7373 Ardmore St Houston, TX | 1.0–3.0 | 1.0–2.0 | 1095 | $1,165 | $1.06 | 5d | 24 | 0.56mi |
| 8282 Cambridge St Unit 8333 Houston, TX | 1.0 | 1.0 | 602 | $764 | $1.27 | 13d | 1 | 0.56mi |
| 8282 Cambridge St Unit 8356 Houston, TX | 1.0 | 1.0 | 602 | $772 | $1.28 | 3d | 1 | 0.56mi |
| 8282 Cambridge St Unit 1162 Houston, TX | 1.0 | 1.0 | 602 | $775 | $1.29 | 8d | 1 | 0.56mi |
| 8282 Cambridge St Unit 8303 Houston, TX | 1.0 | 1.0 | 602 | $815 | $1.35 | 14d | 1 | 0.56mi |
| 8282 Cambridge St Houston, TX | 1.0 | 1.0 | 602 | $810 | $1.35 | 14d | 1 | 0.58mi |
| 1800 El Paseo St Houston, TX | 1.0–2.0 | 1.0–2.0 | 750 | $802 | $1.07 | 2d | 39 | 0.64mi |
| 2111 Holly Hall St Houston, TX | 1.0–3.0 | 1.0–3.0 | 974 | $699 | $0.72 | 3d | 30 | 0.65mi |
| 9000 Almeda Rd Houston, TX | 1.0–2.0 | 1.0–2.0 | 927 | $1,350 | $1.46 | 1d | 12 | 0.66mi |
| 7100 Almeda Rd Unit 1047 Houston, TX | 1.0 | 1.0 | 575 | $824 | $1.43 | 11d | 1 | 0.79mi |
| 7110 Ardmore St Houston, TX | 2.0 | 1.0–2.0 | 831 | $1,663 | $2.00 | 3d | 19 | 0.80mi |
| 7100 Almeda Rd Unit 7121 Houston, TX | 1.0 | 1.0 | 575 | $781 | $1.36 | 3d | 1 | 0.80mi |
| 7100 Almeda Rd Unit 1162 Houston, TX | 1.0 | 1.0 | 575 | $784 | $1.36 | 8d | 1 | 0.80mi |
| 7100 Almeda Rd Unit 7121 Houston, TX | 1.0 | 1.0 | 575 | $859 | $1.49 | 15d | 1 | 0.80mi |
| 7100 Almeda Rd Houston, TX | 1.0 | 1.0 | 575 | $773 | $1.34 | 13d | 1 | 0.80mi |
| 7009 Almeda Rd Houston, TX | 1.0–3.0 | 1.0–2.0 | 1043 | $1,207 | $1.16 | 1d | 22 | 0.86mi |
| 7892 Knight Rd Houston, TX | 1.0–3.0 | 1.0–3.0 | 1002 | $1,659 | $1.66 | 3d | 14 | 0.86mi |
| 8181 Fannin St Houston, TX | 3.0 | 1.0–2.0 | 802 | $1,327 | $1.65 | 2d | 33 | 0.90mi |
| 2828 Old Spanish Trl Houston, TX | 1.0 | 1.0 | 709 | $1,103 | $1.56 | 13d | 1 | 0.95mi |
| 2828 Old Spanish Trl Unit 2849 Houston, TX | 1.0 | 1.0 | 633 | $1,149 | $1.82 | 14d | 1 | 0.96mi |
| 2828 Old Spanish Trl Unit 1112 Houston, TX | 1.0 | 1.0 | 709 | $1,111 | $1.57 | 3d | 1 | 0.96mi |
| 2828 Old Spanish Trl Unit 2849 Houston, TX | 1.0 | 1.0 | 709 | $1,153 | $1.63 | 11d | 1 | 0.96mi |
| 2828 Old Spanish Trl Unit 2879 Houston, TX | 1.0 | 1.0 | 633 | $1,144 | $1.81 | 44d | 1 | 0.97mi |
| 2828 Old Spanish Trl Apt 323 Houston, TX | 1.0 | 1.0 | 709 | $1,114 | $1.57 | 8d | 1 | 0.97mi |
| 2950 Old Spanish Trl Unit 321 Houston, TX | 1.0 | 1.0 | 680 | $1,360 | $2.00 | 8d | 1 | 0.98mi |
| 2950 Old Spanish Trl Unit 2971 Houston, TX | 1.0 | 1.0 | 680 | $1,280 | $1.88 | 44d | 1 | 0.98mi |
HOA detail condo
- Monthly dues
- $285 · $3,420/yr
- Assessments
- None detected in remarks — confirm with the listing agent.
Listing history 37 events
-
2026-06-18days on market $75,000 Active 55 DOM
-
2026-06-17days on market $75,000 Active 54 DOM
-
2026-06-16days on market $75,000 Active 53 DOM
-
2026-06-15days on market $75,000 Active 52 DOM
-
2026-06-13days on market $75,000 Active 50 DOM
-
2026-06-10days on market $75,000 Active 46 DOM
-
2026-06-08days on market $75,000 Active 45 DOM
-
2026-06-07days on market $75,000 Active 44 DOM
-
2026-06-04days on market $75,000 Active 41 DOM
-
2026-06-01days on market $75,000 Active 38 DOM
-
2026-05-31days on market $75,000 Active 37 DOM
-
2026-04-23$75,000 Active 412-char remark
-
2025-10-31historical
-
2025-05-20$95,000 Active
-
2025-03-04historical
-
2025-03-04historical $945
-
2025-02-07$945
-
2024-12-21$95,000 Active
-
2015-11-25soldstatus
-
2015-11-24soldstatus Sold
-
2015-11-20historical
-
2015-08-31$100,000 Active
-
2015-08-02historical
-
2015-08-02historical
-
2015-08-02$100,000
-
2015-07-15historical
-
2015-07-15$100,000 Active
-
2015-06-17$90,000 Active
-
2014-08-08historical
-
2014-06-11$90,000 Active
-
2014-04-15historical
-
2013-06-27price $80,000
-
2013-05-29historical
-
2013-05-25$65,000 Active
-
2013-03-28$66,900 Active
-
2004-01-21soldstatus
-
2001-05-14soldstatus $28,000
ⓘ Source: listings_history table (triggers on properties + properties_extension) + one-shot
backfill from property_details.listing_events for pre-trigger history.
Tax reassessment forecast TX · Resets to sale price
- Current annual tax
- $1,559 · $130/mo
- Projected year-2 tax
- $1,559 · $130/mo
- Expected delta
- $0/yr ($0/mo · 0.0%)
ⓘ Screening estimate from a state-policy table — verify with the county assessor before closing.
Climate risk First Street
- Flood 8/10 Severe FEMA zone X (unshaded) · 99% chance over 30 yrs
- Wildfire 1/10 Low
- Heat 9/10 Extreme 7 d/yr ≥109°F today · 23 d/yr by 30 yrs out
- Wind 9/10 Extreme 99% chance of damaging wind over 30 yrs
- Air quality 2/10 Low 2 unhealthy d/yr today · 2 by 30 yrs out
Nearby sold comps map
Loading sold comps map…
Walkable amenities ~0.75 mi
Loading nearby amenities…
Taxation est. · year 1
- Rental income
- $12,903
- − Mortgage interest
- −$4,201
- − Property taxes
- −$1,559
- − Insurance
- −$1,172
- − Repairs & maintenance
- −$1,032
- − Management
- −$1,032
- − HOA
- −$3,420
- − Depreciation
- −$2,182
- Taxable loss
- −$1,697
- Est. tax savings @ 24.0%
- +$407
- After-tax cash flow
- $-271/yr
For passive investors: Depreciation is non-cash, so a rental often shows a tax loss while cash-flowing — sheltering income. Rental losses are passive: they offset passive income freely, and up to $25,000/yr can offset ordinary (W-2) income if you actively participate and your MAGI is under $100k (phasing out to $0 by $150k); unused losses carry forward. On sale, claimed depreciation is recaptured at up to 25%, and gains may owe capital-gains tax (a 1031 exchange can defer both). Figures are a year-1 estimate at your 24.0% rate — not tax advice; consult a CPA.
Schools (NCES district)
- District
- Houston ISD
- NCES district ID
- 4823640
- Math proficiency
- 27% ▼ -18.00%
- Reading proficiency
- 35% ▼ -6.00%
- Median HH income
- $46,054
- Composite
- 26.63/100
- National rank
- #7173
- State rank
- #593 of 826 in TX
Livability — Houston
- Score
- 74/100
- State rank
- #184
- US rank
- #4771
Category grades
Schools grade is shown separately in the Schools card above.
Census & demographics
- Census place
- Houston, TX
- County
- Harris County · 4,702,590 people
- City population
- 3,226,434
- Metro
- Houston-The Woodlands-Sugar Land, TX
- Population (ZIP)
- 28,272
- Household income
- $62,106
- Rent vs Own
- Severe rent burden
- 2814.0
Population outlook (Harris County) Hauer SSP2
- Today (2025)
- 5,571,493 people
- By 2030
- 6,089,821 · +9.3%
- By 2040
- 7,142,806 · +28.2%
- By 2050
- 8,185,864 · +46.9%
- By 2075
- 10,574,329 · +89.8%
- By 2100
- 12,109,958 · +117.4%
Race, ethnicity, and origin ACS 2023
- Neighborhood character
- Highly diverse neighborhood (Simpson 0.72)
- Race & ethnicity
- Black 41% Asian 22% White 20% Hispanic / Latino 14% Two or more races 10%
- Hispanic origin (detail)
- Mexican 7%
- Common ancestry
- Slovak 2% Romanian 1% Italian 1%
- Foreign-born
- 29% · China, Canada, Jamaica
- Languages at home
- 67% English-only · Spanish 9% Chinese 7% Other Indo-European 5%
Political lean MEDSL · Harris
- 2024 margin
- Lean D (+5.5) · D 52.0% · R 46.4% · Other 1.6%
- 2008→2024 swing
- +3.9pp toward D · 2008: 1.6pp · 2024: 5.5pp
- All cycles
- 2024: D+5.5 2020: D+13.3 2016: D+12.4 2012: D+0.1 2008: D+1.6
Not yet ingested
- Civics
- —
Market trends
- HPI YoY
- ▼ -4.51%
- Current HPI
- 170.4017
- Rent YoY
- ▼ -2.82%
- Metro
- Houston-The Woodlands-Sugar Land, TX
- State GDP YoY
- ▲ 3.95%
- F500 in state
- 110
Industry mix (Fortune 500 HQ in TX)
| Industry | F500 HQs | Revenue |
|---|---|---|
| Energy | 16 | $1,198B |
|
||
| Technology | 5 | $198B |
|
||
| Engineering / Construction | 4 | $72B |
|
||
| Energy Services | 3 | $60B |
|
||
| Utilities | 3 | $41B |
|
||
| Healthcare | 2 | $330B |
|
||
Price history
+167.9% since first listed27 events — show timeline
- 2026-05-24 Listed for Rent $950 HARMLS
- 2026-04-23 Listed $75,000 HARMLS
- 2025-10-31 Listing Removed — HARMLS
- 2025-05-20 Listed $95,000 HARMLS
- 2025-03-04 Listing Removed — HARMLS
- 2025-03-04 Rental Removed $945 HARMLS
- 2025-02-07 Listed for Rent $945 HARMLS
- 2024-12-21 Listed $95,000 HARMLS
- 2015-11-25 Sold (Public Records) — Public Records
- 2015-11-24 Sold (MLS) — HARMLS
- 2015-11-20 Listing Removed — HARMLS
- 2015-08-31 Listed $100,000 HARMLS
- 2015-08-02 Listing Removed — HARMLS
- 2015-08-02 Listing Removed — HARMLS
- 2015-08-02 Listed $100,000 HARMLS
- 2015-07-15 Listing Removed — HARMLS
- 2015-07-15 Listed $100,000 HARMLS
- 2015-06-17 Listed $90,000 HARMLS
- 2014-08-08 Listing Removed — HARMLS
- 2014-06-11 Listed $90,000 HARMLS
- 2014-04-15 Listing Removed — HARMLS
- 2013-06-27 Price Changed $80,000 HARMLS
- 2013-05-29 Listing Removed — HARMLS
- 2013-05-25 Listed $65,000 HARMLS
- 2013-03-28 Listed $66,900 HARMLS
- 2004-01-21 Sold (Public Records) — Public Records
- 2001-05-14 Sold (Public Records) $28,000 Public Records
Property tax history
-0.0%/yrLatest (2025): $1,559 · -11.8% YoY. Source: county tax records.
Cash-flow waterfall
monthlySold comps — $/sqft
last 12 mo · ≤1 miLoading sold comps…