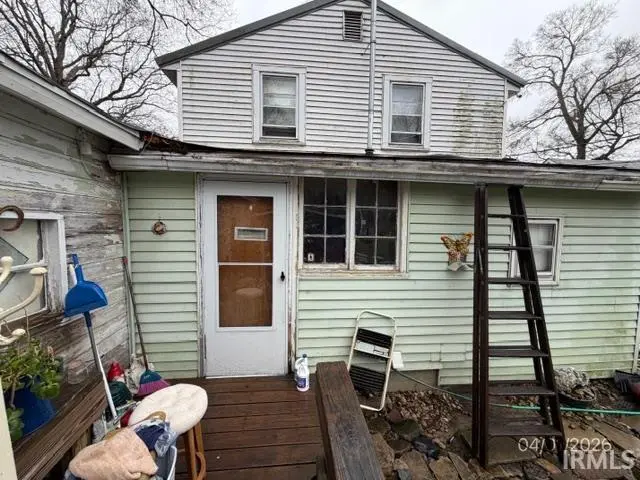
4013 Pottawatomie Rd · Logansport, IN
Flood risk 10/10 · Severe
- FEMA flood zone
- X (shaded)
- Chance of flooding over 30 yrs
- 0.99%
- Est. flood insurance / yr
- $507 – $1,088
Fire risk 1/10 · Minimal
- Est. fire insurance / yr
- $717 – $1,331
Heat risk 3/10 · Minor
- Hot days now (above 102°F)
- 7 days/yr
- Hot days in 30 yrs
- 17 days/yr
Wind risk 2/10 · Minimal
- Chance of severe wind over 30 yrs
- —
Air-quality risk 2/10 · Minimal
- Unhealthy air days now
- 1 days/yr
- Unhealthy air days in 30 yrs
- 2 days/yr
Risk factors via First Street. Map © Google.
Why this score? — see what drove the B- grade
The composite is a weighted blend of 9 inputs, each scored 0–100. Each bar is that input's sub-score; the figure is the points it added to the 100-point composite (weight × sub-score).
- Cash flow +30.0/30.0
- 1% rule +10.0/10.0
- DSCR +10.0/10.0
- ARV discount +7.5/15.0
- Livability +3.9/5.0
- Rent growth +2.5/5.0
- Condition / age +2.5/5.0
- Schools +2.4/10.0
- Appreciation +0.0/10.0
$59,900
🖨 Deal sheet 📄 Offer letter ✓ Due diligence
Listing remarks MLS
Investor special on the Wabash River! Welcome to 4013 Pottawatomie Road in Logansport an opportunity packed with potential and scenic waterfront views. This property sits along the Wabash River, offering a unique setting that could truly shine with the right vision and updates. The home features a functional layout and sits on a spacious lot. providing a solid starting point for renovations. While is does not work throughout, the location alone makes it a standout opportunity for investors, flippers or buyers looking to create a personalized riverfront retreat.
Key facts
- Waterfront views
- Spacious lot
- Functional layout
Tags
Neighborhood map
What this means for you Summary
Snapshot
- This is a 3-bed/2.0-bath single-family listed at $60k.
Deal economics
- At list price, monthly cash flow is $544 ($7k/yr) — positive.
- The deal already cash-flows at list — no discount required.
- Meets the 1% rule at list price ($1k rent vs $60k).
- Recommended offer: $58k (3.0% below list) — sets the bar for market timing.
- Cap rate 18.5% vs local median 4.4% in Logansport — top-decile yield for the area; either an underpriced asset or a hidden risk that comps aren't pricing in. Stress-test before assuming the spread holds.
Location & tenants
- Location reads 78/100 on livability (#34 in IN, #2,683 nationally) — a middle-class / working-renter tenant base. Strengths: crime A+, amenities A+, cost of living A+; Watch: schools F, commute F, employment D-.
- Logansport Community School Corporation (town): math 26% / reading 32% proficiency, ranked #252 of 301 in IN (top 84%) — low school quality limits family demand, transient renter base, plan for 1-2y turnover.
- Market conditions: 129 active listings in the ZIP; 22 units permitted in Cass County in 2024 (0 in 5+ unit buildings).
Forward outlook
- Local home prices are declining (-3.0%/yr); year-one equity from $414 of loan paydown is wiped out by about $2k of value loss. Plan a longer hold.
- Cass County population projected at -16% by 2050 — secular population decline; favor cash flow + early exit over multi-decade hold.
- At projected returns (-3.0% appreciation + 3.0% rent growth), your $17k cash investment doubles in ~4 years — after that, you're playing with house money.
Negotiation context
- It's been on market 58 days — a 3% lower offer ($58k) is reasonable based on typical stale-listing flexibility.
Risks & watch-outs
- Watch-outs: flood insurance adds $66/mo; built in 1948 — expect roof / HVAC / electrical / plumbing capex.
- Climate carrying-cost: severe flood risk — expect insurance premiums to compound above CPI over the hold.
Questions for the listing agent
- It's been on market 58 days. Have you received any prior offers? Is the seller open to a 3% concession, seller financing, or rate buy-down credit?
- Built in 1948 — when were the roof, HVAC, electrical panel, plumbing, and water heater last replaced?
- What's the actual annual flood-insurance premium (NFIP or private), and is the property in a SFHA with mandatory coverage?
- Is there a deadline driving the sale (1031 exchange, divorce, estate, relocation)? That informs how much negotiation room exists.
- Schools are F-rated, which usually means shorter tenancies and higher turnover. Who's the typical renter profile here, and what's been the actual vacancy rate?
- What's the average days-on-market for RENTAL listings here right now (not sales)? A rising rental-DOM trend means longer vacancies and softer asking-rent achievability than the comps imply.
- What's the recent tenant-quality profile in this submarket — average credit score on applications, eviction rate, late-payment / NSF rate, and stable-employment percentage? A property-management company in the area should have these aggregated.
- How much new for-sale + rental construction is in the pipeline within 1–3 miles? Heavy new supply typically softens prices + rents 12–24 months out; constrained supply supports both.
Investment metrics
- 1% rule
- 2.17% ✓
- Cap rate
- 18.53%
- Cash-on-cash
- 43.70%
- DSCR
- 2.94
- GRM
- 3.8
CMA / ARV
- ARV (median comp)
- $211,315
- List price
- $59,900
- Delta
- -71.65%
- Verdict
- UNDERPRICED
- Comps
- 10 within 1.0 mi
Show comp detail 1 sale within ~0.75 mi
| Address | Dist | Beds/Ba | Sqft | Sold | Price | $/sf | Match |
|---|---|---|---|---|---|---|---|
| 814 Marleton Rd | 0.75mi | 3/2.0 | 1,404 (+2%) | 20mo | $208,000 | $148 | 45 |
Match score weights: distance 35% · size 25% · config 20% · recency 20%. Top-matched comps best support the ARV.
Projected returns pro-forma
-3.0% appreciation · 3.0% rent growth · sell at horizon
- IRR
- 35.2%
- Equity multiple
- 2.49×
- Total profit
- $25,025
- Equity at exit
- $8,931
- IRR
- 42.0%
- Equity multiple
- 4.98×
- Total profit
- $66,680
- Equity at exit
- $5,179
Cash invested: $16,772 (down + closing). Projections, not guarantees.
Landlord ↔ Tenant lean methodology
- Overall (STATE)
- 90 Strongly Landlord-Friendly
- State Indiana
- 90 Strongly Landlord-Friendly · R+11
- County
- — inherits STATE
- City
- — inherits STATE
ZIP-level market 46947
- Home prices YoY
- -28.9%
- Active inventory
- 129
- Price-to-rent
- 3.8×
Monthly cashflow live
- Estimated rent
- $1,297 medium interval (Pro) →
- Mortgage (P&I)
- −$314
- Tax est. 1.5%
- −$75 /mo · $898/yr
- Insurance
- −$25
- Flood insurance flood zone
- −$66 /mo · $798/yr
- HOA
- −$0
- Vacancy / Maint / Mgmt
- −$272
- Net cashflow
- $544
Break-even live
UW: 25.0% down · 7.5% · 30yr · 1.5% tax · 5.0% vac · 8.0% maint · 8.0% mgmt
Financing live
Cash to close
- Down payment
- $14,975
- Closing costs
- $1,797
- Reserves months
- —
- Total cash needed
- —
Loan-product check · same deal, 3 products live
Conventional
25% down · 7.5% · 30yr
- Down + closing
- —
- Monthly P&I
- —
- Monthly cashflow
- —
- DSCR
- —
- Eligible?
- —
Personal DTI + credit; lowest rate.
DSCR
20% down · 8.5% · 30yr
- Down + closing
- —
- Monthly P&I
- —
- Monthly cashflow
- —
- DSCR
- —
- Eligible?
- —
No personal income docs; deal must DSCR.
Hard money
10% down · 12.0% · 12mo
- Down + closing
- —
- Monthly P&I
- —
- Monthly cashflow
- —
- DSCR
- —
- Eligible?
- —
Short-term bridge; refi at stabilization.
Listing history 17 events
-
2026-06-18status $59,900 Pending 58 DOM
-
2026-06-18days on market $59,900 Active 58 DOM
-
2026-06-17days on market $59,900 Active 57 DOM
-
2026-06-16days on market $59,900 Active 56 DOM
-
2026-06-15days on market $59,900 Active 55 DOM
-
2026-06-13days on market $59,900 Active 53 DOM
-
2026-06-12days on market $59,900 Active 52 DOM
-
2026-06-09days on market $59,900 Active 49 DOM
-
2026-06-08days on market $59,900 Active 48 DOM
-
2026-06-07days on market $59,900 Active 47 DOM
-
2026-06-07days on market $59,900 Active 46 DOM
-
2026-06-04days on market $59,900 Active 43 DOM
-
2026-06-02days on market $59,900 Active 42 DOM
-
2026-06-01days on market $59,900 Active 41 DOM
-
2026-05-31days on market $59,900 Active 40 DOM
-
2026-05-31days on market $59,900 Active 39 DOM
-
2026-04-21$69,900 Active 568-char remark
Show marketing remark (568 chars)
Investor special on the Wabash River! Welcome to 4013 Pottawatomie Road in Logansport an opportunity packed with potential and scenic waterfront views. This property sits along the Wabash River, offering a unique setting that could truly shine with the right vision and updates. The home features a functional layout and sits on a spacious lot. providing a solid starting point for renovations. While is does not work throughout, the location alone makes it a standout opportunity for investors, flippers or buyers looking to create a personalized riverfront retreat.
ⓘ Source: listings_history table (triggers on properties + properties_extension) + one-shot
backfill from property_details.listing_events for pre-trigger history.
Climate risk First Street
- Flood 10/10 Extreme FEMA zone X (shaded) · 99% chance over 30 yrs
- Wildfire 1/10 Low
- Heat 3/10 Moderate 7 d/yr ≥102°F today · 17 d/yr by 30 yrs out
- Wind 2/10 Low
- Air quality 2/10 Low 1 unhealthy d/yr today · 2 by 30 yrs out
Nearby sold comps map
Loading sold comps map…
Walkable amenities ~0.75 mi
Loading nearby amenities…
Taxation est. · year 1
- Rental income
- $15,566
- − Mortgage interest
- −$3,355
- − Property taxes
- −$898
- − Insurance
- −$1,097
- − Repairs & maintenance
- −$1,245
- − Management
- −$1,245
- − Depreciation
- −$1,743
- Taxable income
- $5,982
- Est. tax owed @ 24.0%
- −$1,436
- After-tax cash flow
- $5,097/yr
For passive investors: Depreciation is non-cash, so a rental often shows a tax loss while cash-flowing — sheltering income. Rental losses are passive: they offset passive income freely, and up to $25,000/yr can offset ordinary (W-2) income if you actively participate and your MAGI is under $100k (phasing out to $0 by $150k); unused losses carry forward. On sale, claimed depreciation is recaptured at up to 25%, and gains may owe capital-gains tax (a 1031 exchange can defer both). Figures are a year-1 estimate at your 24.0% rate — not tax advice; consult a CPA.
Schools (NCES district)
- District
- Logansport Community School Corporation
- NCES district ID
- 1806030
- Math proficiency
- 26% ▼ -10.00%
- Reading proficiency
- 32% ▼ -7.00%
- Median HH income
- $37,767
- Composite
- 24.19/100
- National rank
- #7733
- State rank
- #252 of 301 in IN
Livability — Logansport
- Score
- 78/100
- State rank
- #34
- US rank
- #2683
Category grades
Schools grade is shown separately in the Schools card above.
Census & demographics
- City population
- 28,830
- Population (ZIP)
- 28,830
Population outlook (Cass County) Hauer SSP2
- Today (2025)
- 36,480 people
- By 2030
- 35,390 · -3.0%
- By 2040
- 33,077 · -9.3%
- By 2050
- 30,631 · -16.0%
- By 2075
- 25,426 · -30.3%
- By 2100
- 20,617 · -43.5%
Race, ethnicity, and origin ACS 2023
- Neighborhood character
- Predominantly White (70%)
- Race & ethnicity
- White 70% Hispanic / Latino 22% Two or more races 8% Asian 2% Black 1%
- Hispanic origin (detail)
- Mexican 13%
- Common ancestry
- Italian 2% Iranian 1% Lithuanian 1%
- Foreign-born
- 12% · Canada, China
- Languages at home
- 80% English-only · Spanish 17% French/Haitian/Cajun 1% Other Asian/Pacific 1%
Political lean MEDSL · Cass
- 2024 margin
- Solid R (+46.2) · D 26.2% · R 72.4% · Other 1.4%
- 2008→2024 swing
- -37.7pp toward R · 2008: -8.5pp · 2024: -46.2pp
- All cycles
- 2024: R+46.2 2020: R+41.1 2016: R+42.0 2012: R+21.7 2008: R+8.5
Not yet ingested
- Civics
- —
Market trends
- HPI YoY
- ▼ -91.21%
- Current HPI
- 223.8394
- Rent YoY
- —
- Metro
- —
- State GDP YoY
- ▲ 2.90%
- F500 in state
- 18
Industry mix (Fortune 500 HQ in IN)
| Industry | F500 HQs | Revenue |
|---|---|---|
| Industrial Machinery | 2 | $37B |
|
||
| Healthcare | 1 | $177B |
|
||
| Pharmaceuticals | 1 | $45B |
|
||
| Metals / Steel | 1 | $18B |
|
||
| Agriculture | 1 | $17B |
|
||
| Packaging | 1 | $12B |
|
||
Price history
1 event — show timeline
- 2026-04-21 Listed $69,900 IRMLS
Cash-flow waterfall
monthlySold comps — $/sqft
last 12 mo · ≤1 miLoading sold comps…