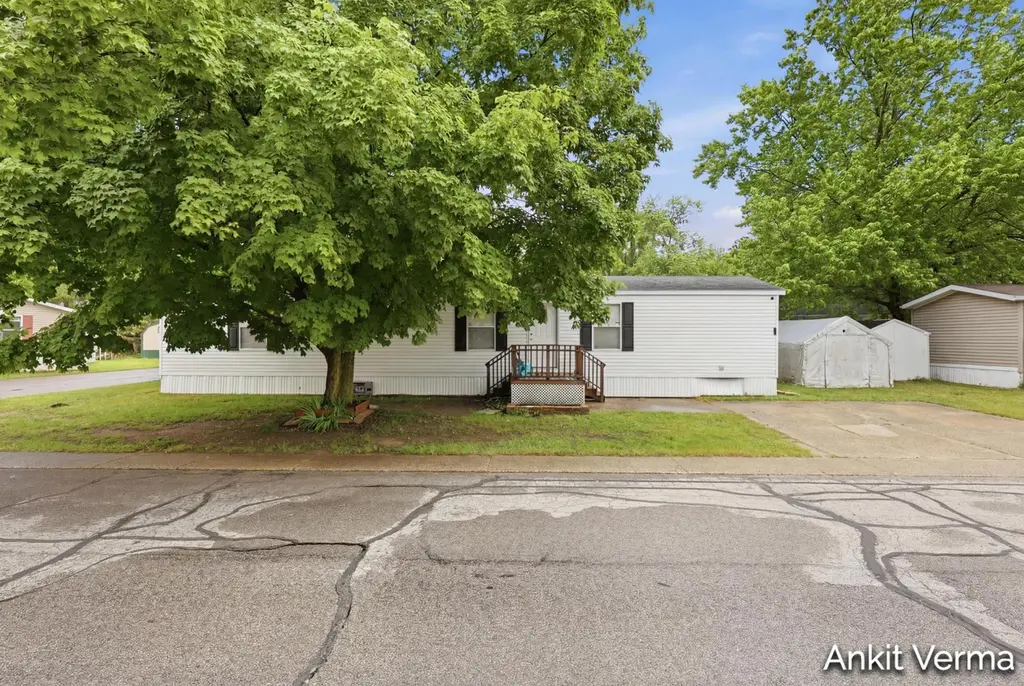
7132 Prestonburg Dr SW · Cutlerville, MI
Flood risk No data
- FEMA flood zone
- —
- Chance of flooding over 30 yrs
- —
- Est. flood insurance / yr
- —
Fire risk No data
- Est. fire insurance / yr
- —
Heat risk No data
- Hot days now (above threshold)
- —
- Hot days in 30 yrs
- —
Wind risk No data
- Chance of severe wind over 30 yrs
- —
Air-quality risk No data
- Unhealthy air days now
- —
- Unhealthy air days in 30 yrs
- —
Risk factors via First Street. Map © Google.
Why this score? — see what drove the B- grade
The composite is a weighted blend of 9 inputs, each scored 0–100. Each bar is that input's sub-score; the figure is the points it added to the 100-point composite (weight × sub-score).
- Cash flow +25.7/30.0
- 1% rule +10.0/10.0
- DSCR +8.6/10.0
- ARV discount +7.5/15.0
- Schools +6.2/10.0
- Livability +3.6/5.0
- Condition / age +2.8/5.0
- Rent growth +2.5/5.0
- Appreciation +0.0/10.0
$60,000
🖨 Deal sheet (PDF) 📄 Offer letter ✓ Due diligence
Listing remarks MLS
Welcome to 7132 Prestonburg in Grand Rapids! This well-maintained 3-bedroom, 2-bathroom mobile home offers 1,216 square feet of comfortable and affordable living space. Inside, you'll find a spacious layout with an open living area, a functional kitchen with ample cabinet space, and generously sized bedrooms. The primary suite features a private bathroom, creating a comfortable retreat. Two additional bedrooms and a second full bath provide flexibility for family, guests, or a home office. Whether you're a first-time buyer, looking to downsize, or seeking an affordable home in a convenient location, this property offers excellent value. Enjoy easy access to shopping, dining, schools, and major roadways while benefiting from the comfort of a move-in-ready home. Amenities include- playground, basketball court, pool, and clubhouse and pet friendly!
Key facts
- Functional kitchen
- Move-in-ready home
- Open living area
Tags
Property features AI
Finance
- HOA & community: Monthly association fee of $711; Association covers trash, snow removal, and lawn/yard care
Exterior
- Utilities: High-speed internet available
- Home design: Ranch-style home; Residential property; Built in 2014
- Construction: Vinyl siding; Shingle roof
- Exterior features: Paved road access; Public water
Interior
- Kitchen: Dishwasher; Oven; Range; Refrigerator
- Bathrooms: Two full bathrooms
- Heating & cooling: Forced air heating; Has heating
- Interior features: Three total rooms; Basement (other type)
- Laundry & utility: Washer; Dryer
Neighborhood map
What this means for you Summary
Snapshot
- This is a 3-bed/2.0-bath manufactured listed at $60k. Condition is rated average.
Deal economics
- At list price, monthly cash flow is $143 ($2k/yr) — positive.
- The deal already cash-flows at list — no discount required.
- Meets the 1% rule at list price ($2k rent vs $60k).
- Cap rate 9.2% vs local median 2.5% in Cutlerville — top-decile yield for the area; either an underpriced asset or a hidden risk that comps aren't pricing in. Stress-test before assuming the spread holds.
Location & tenants
- Location reads 71/100 on livability (#280 in MI) — a middle-class / working-renter tenant base. Strengths: cost of living A+, housing A+, health & safety A-; Watch: crime C-, amenities F, commute F.
- Byron Center Public Schools (suburban): math 69% / reading 73% proficiency, ranked #15 of 540 in MI (top 3%) — strong family-tenant draw, lease renewals of 3-5y typical; only 20% free/reduced lunch — higher-income household profile.
- Zoned schools: Countryside Elementary School (math 86% / reading 86%, grade A+, #8 of 1,397 statewide, top 0%, 589 students, 22% FRL); Byron Center West Middle School (math 64% / reading 69%, grade A-, #33 of 493 statewide, top 7%, 673 students, 23% FRL); Byron Center High School (math 64% / reading 74%, grade B, #38 of 713 statewide, top 5%, 1,339 students, 21% FRL) — zoned schools at 22% FRL track the district average.
- Market conditions: 111 active listings in the ZIP; 5 comparable units currently listed for rent nearby; rentals leasing fast (median 12d on market — plan ~1-2 weeks tenant-placement turnaround); 2,253 units permitted in Kent County in 2024 (969 in 5+ unit buildings).
- This rent runs 31% of the median local income ($62k/yr) — at the standard rent-burdened threshold; future hikes will face affordability resistance.
Forward outlook
- Local home prices are declining (-3.0%/yr); year-one equity from $415 of loan paydown is wiped out by about $2k of value loss. Plan a longer hold.
- Kent County population projected at +22% by 2050 — long-run rental-demand tailwind backs the buy-and-hold thesis.
- At projected returns (-3.0% appreciation + 3.0% rent growth), your $17k cash investment doubles in ~10 years — after that, you're playing with house money.
Negotiation context
- Only 9 days on market — expect competitive offers; lowballing is unlikely to land.
- 2 sale attempts with the ask held roughly flat each time — persistent listings suggest the price (not the market) is what's stuck; bring a comps-based counter.
Risks & watch-outs
- Watch-outs: HOA is 44% of rent.
Questions for the listing agent
- What does the HOA fee cover, when was the last increase, and are there any pending special assessments or reserve-fund shortfalls?
- Is there a deadline driving the sale (1031 exchange, divorce, estate, relocation)? That informs how much negotiation room exists.
- What's the average days-on-market for RENTAL listings here right now (not sales)? A rising rental-DOM trend means longer vacancies and softer asking-rent achievability than the comps imply.
- What's the recent tenant-quality profile in this submarket — average credit score on applications, eviction rate, late-payment / NSF rate, and stable-employment percentage? A property-management company in the area should have these aggregated.
- How much new for-sale + rental construction is in the pipeline within 1–3 miles? Heavy new supply typically softens prices + rents 12–24 months out; constrained supply supports both.
Investment metrics
- 1% rule
- 2.68% ✓
- Cap rate
- 9.16%
- Cash-on-cash
- 10.24%
- DSCR
- 1.46
- GRM
- 3.1
CMA / ARV
No comps found within radius.
Projected returns pro-forma
-3.0% appreciation · 3.0% rent growth · sell at horizon
- IRR
- -0.2%
- Equity multiple
- 0.99×
- Total profit
- $-129
- Equity at exit
- $8,946
- IRR
- 10.1%
- Equity multiple
- 1.80×
- Total profit
- $13,520
- Equity at exit
- $5,188
Cash invested: $16,800 (down + closing). Projections, not guarantees.
Landlord ↔ Tenant lean methodology
- Overall (STATE)
- 62 Landlord-Friendly
- State Michigan
- 62 Landlord-Friendly · EVEN
- County
- — inherits STATE
- City
- — inherits STATE
ZIP-level market 49548
- Active inventory
- 111
- Price-to-rent
- 3.1×
Monthly cashflow live
- Estimated rent
- $1,606 high interval (Pro) →
- Mortgage (P&I)
- −$315
- Tax est. 1.5%
- −$75 /mo · $900/yr
- Insurance
- −$25
- HOA
- −$711
- Vacancy / Maint / Mgmt
- −$337
- Net cashflow
- $143
Break-even live
Sensitivity live
| Price | -10% $185 | -5% $164 | +0% $143 | +5% $123 | +10% $102 |
|---|---|---|---|---|---|
| Rent | -10% $16 | -5% $80 | +0% $143 | +5% $207 | +10% $270 |
| Rate | -1.0pp $174 | -0.5pp $159 | base $143 | +0.5pp $128 | +1.0pp $112 |
UW: 25.0% down · 7.5% · 30yr · 1.5% tax · 5.0% vac · 8.0% maint · 8.0% mgmt
Financing live
Cash to close
- Down payment
- $15,000
- Closing costs
- $1,800
- Reserves months
- —
- Total cash needed
- —
Loan-product check · same deal, 3 products live
Conventional
25% down · 7.5% · 30yr
- Down + closing
- —
- Monthly P&I
- —
- Monthly cashflow
- —
- DSCR
- —
- Eligible?
- —
Personal DTI + credit; lowest rate.
DSCR
20% down · 8.5% · 30yr
- Down + closing
- —
- Monthly P&I
- —
- Monthly cashflow
- —
- DSCR
- —
- Eligible?
- —
No personal income docs; deal must DSCR.
Hard money
10% down · 12.0% · 12mo
- Down + closing
- —
- Monthly P&I
- —
- Monthly cashflow
- —
- DSCR
- —
- Eligible?
- —
Short-term bridge; refi at stabilization.
Rent comps 5 comps
| Address | Beds | Baths | Sqft | Rent | $/sqft | DOM | Units | Dist |
|---|---|---|---|---|---|---|---|---|
| 7283 Division Ave S Grand Rapids, MI | 3.0 | 2.0 | 1152 | $1,514 | $1.31 | 23d | 1 | 0.19mi |
| 6700 Creekstone Ln SW Grand Rapids, MI | 2.0 | 1.0 | 1000 | $1,285 | $1.28 | 4d | 1 | 0.54mi |
| 6500 Division Ave S Grand Rapids, MI | 2.0 | 1.0 | 784 | $1,399 | $1.78 | 12d | 1 | 0.88mi |
| 6471 Division Ave S Grand Rapids, MI | 2.0 | 1.0 | 728 | $1,399 | $1.92 | 12d | 1 | 0.92mi |
| 6263 Division Ave S Grand Rapids, MI | 2.0–3.0 | 2.0 | 1200 | $1,579 | $1.32 | 4d | 1 | 1.15mi |
HOA detail
- Monthly dues
- $711 · $8,532/yr
- Likely covers
- pool
Listing history 7 events
-
2026-06-21days on market $60,000 Active 9 DOM
-
2026-06-18days on market $60,000 Active 6 DOM
-
2026-06-17days on market $60,000 Active 5 DOM
-
2026-06-16days on market $60,000 Active 4 DOM
-
2026-06-15days on market $60,000 Active 3 DOM
-
2026-06-14remarks 699-char remark
-
2026-06-14$60,000 Active 1 DOM
ⓘ Source: listings_history table (triggers on properties + properties_extension) + one-shot
backfill from property_details.listing_events for pre-trigger history.
Nearby sold comps map
Loading sold comps map…
Walkable amenities ~0.75 mi
Loading nearby amenities…
Taxation est. · year 1
- Rental income
- $19,276
- − Mortgage interest
- −$3,361
- − Property taxes
- −$900
- − Insurance
- −$300
- − Repairs & maintenance
- −$1,542
- − Management
- −$1,542
- − HOA
- −$8,532
- − Depreciation
- −$1,745
- Taxable income
- $1,354
- Est. tax owed @ 24.0%
- −$325
- After-tax cash flow
- $1,396/yr
For passive investors: Depreciation is non-cash, so a rental often shows a tax loss while cash-flowing — sheltering income. Rental losses are passive: they offset passive income freely, and up to $25,000/yr can offset ordinary (W-2) income if you actively participate and your MAGI is under $100k (phasing out to $0 by $150k); unused losses carry forward. On sale, claimed depreciation is recaptured at up to 25%, and gains may owe capital-gains tax (a 1031 exchange can defer both). Figures are a year-1 estimate at your 24.0% rate — not tax advice; consult a CPA.
Condition & rehab AI · 12 photos
This mobile home is in average condition with some cosmetic repairs and maintenance needed. It offers a good layout and is move-in ready with some updates that can significantly increase its value.
Repairs flagged
- Minor Kitchen cabinets — Slight wear and tear.
- Minor Kitchen countertops — Slight wear and tear.
- Minor Bathroom shower curtain — Worn and needs replacement.
- Minor Bathroom sink area — Worn and needs cleaning or replacement.
- Minor Exterior siding — Discoloration and minor wear.
- Minor Interior walls/paint — Faded in some areas.
- Minor Windows — Worn and need cleaning or replacement.
- Minor HVAC/mechanicals — Worn and need cleaning or replacement.
- Minor Landscaping — Needs trimming and maintenance.
Value-add opportunities
- Resale Paint interior walls — Fresh paint can make a significant difference in the home's appearance.
- Resale Replace worn shower curtain — A new shower curtain can improve the home's curb appeal.
- Rental Clean and maintain HVAC system — A clean and well-maintained HVAC system can attract tenants.
- Resale Trim and maintain landscaping — Well-maintained landscaping can improve the home's curb appeal and attract potential buyers.
- Resale Replace worn kitchen cabinets and countertops — Fresh cabinets and countertops can significantly improve the home's appearance and value.
- Resale Replace worn bathroom sink area — A new sink area can improve the home's appearance and functionality.
- Resale Replace worn exterior siding — Fresh siding can improve the home's curb appeal and value.
- Rental Paint interior walls — Fresh paint can improve the home's appearance and attract tenants.
- Resale Replace worn windows — Fresh windows can improve the home's curb appeal and value.
- Rental Replace worn HVAC/mechanicals — A clean and well-maintained HVAC system can attract tenants and improve the home's functionality.
Renovation cost estimate screening
| Repair item | Severity | Est. cost |
|---|---|---|
| Kitchen cabinets · Slight wear and tear. | Minor | $500–3,000 |
| Kitchen countertops · Slight wear and tear. | Minor | $500–3,000 |
| Bathroom shower curtain · Worn and needs replacement. | Minor | $500–3,000 |
| Bathroom sink area · Worn and needs cleaning or replacement. | Minor | $500–3,000 |
| Exterior siding · Discoloration and minor wear. | Minor | $500–3,000 |
| Interior walls/paint · Faded in some areas. | Minor | $500–3,000 |
| Windows · Worn and need cleaning or replacement. | Minor | $500–3,000 |
| HVAC/mechanicals · Worn and need cleaning or replacement. | Minor | $500–3,000 |
| Landscaping · Needs trimming and maintenance. | Minor | $500–3,000 |
| Total estimated repair cost · 9 items | $4,500–27,000 |
Value-add ROI direction
- Resale Paint interior walls — Fresh paint can make a significant difference in the home's appearance. ↑
- Resale Replace worn shower curtain — A new shower curtain can improve the home's curb appeal. ↑
- Rental Clean and maintain HVAC system — A clean and well-maintained HVAC system can attract tenants. ↑
- Resale Trim and maintain landscaping — Well-maintained landscaping can improve the home's curb appeal and attract potential buyers. ↑
- Resale Replace worn kitchen cabinets and countertops — Fresh cabinets and countertops can significantly improve the home's appearance and value. ↑
- Resale Replace worn bathroom sink area — A new sink area can improve the home's appearance and functionality. ↑
- Resale Replace worn exterior siding — Fresh siding can improve the home's curb appeal and value. ↑
- Rental Paint interior walls — Fresh paint can improve the home's appearance and attract tenants. ↑
- Resale Replace worn windows — Fresh windows can improve the home's curb appeal and value. ↑
- Rental Replace worn HVAC/mechanicals — A clean and well-maintained HVAC system can attract tenants and improve the home's functionality. ↑
ⓘ Cost ranges are severity-bucket heuristics (US national rule-of-thumb). Get contractor quotes + a written scope before underwriting a rehab budget.
Schools (NCES district)
- District
- Byron Center Public Schools
- NCES district ID
- 2607560
- Math proficiency
- 69% ▼ -2.00%
- Reading proficiency
- 73% ▼ -4.00%
- Median HH income
- $63,763
- Composite
- 61.5/100
- National rank
- #753
- State rank
- #15 of 540 in MI
Livability — Cutlerville
- Score
- 71/100
- State rank
- #280
- US rank
- #6874
Category grades
Schools grade is shown separately in the Schools card above.
Census & demographics
- Census place
- Cutlerville, MI
- County
- Kent County · 533,805 people
- Metro
- Grand Rapids-Kentwood, MI
- Population (ZIP)
- 34,777
- Household income
- $61,636
- Rent vs Own
- Severe rent burden
- 781.0
Population outlook (Kent County) Hauer SSP2
- Today (2025)
- 712,484 people
- By 2030
- 748,618 · +5.1%
- By 2040
- 814,777 · +14.4%
- By 2050
- 868,556 · +21.9%
- By 2075
- 966,487 · +35.7%
- By 2100
- 967,975 · +35.9%
Race, ethnicity, and origin ACS 2023
- Neighborhood character
- Diverse neighborhood (Simpson 0.68)
- Race & ethnicity
- White 49% Hispanic / Latino 22% Two or more races 16% Black 15% Asian 6% Native American 1%
- Hispanic origin (detail)
- Mexican 15% Puerto Rican 4%
- Common ancestry
- Iranian 10% Romanian 4% Lithuanian 2%
- Foreign-born
- 13% · Canada, Vietnam, China
- Languages at home
- 78% English-only · Spanish 14% Vietnamese 2% French/Haitian/Cajun 1%
Political lean MEDSL · Kent
- 2024 margin
- Lean D (+5.4) · D 51.8% · R 46.5% · Other 1.7%
- 2008→2024 swing
- +4.8pp toward D · 2008: 0.5pp · 2024: 5.4pp
- All cycles
- 2024: D+5.4 2020: D+6.1 2016: R+3.1 2012: R+7.9 2008: D+0.5
Not yet ingested
- Civics
- —
Market trends
- HPI YoY
- ▼ -208.41%
- Current HPI
- 325.8096
- Rent YoY
- —
- Metro
- Grand Rapids-Kentwood, MI
- State GDP YoY
- ▲ 1.37%
- F500 in state
- 28
Industry mix (Fortune 500 HQ in MI)
| Industry | F500 HQs | Revenue |
|---|---|---|
| Automotive Parts | 3 | $48B |
|
||
| Automotive | 2 | $372B |
|
||
| Chemicals | 1 | $45B |
|
||
| Automotive Retail | 1 | $29B |
|
||
| Healthcare / Medical Devices | 1 | $23B |
|
||
| Automotive Technology | 1 | $20B |
|
||
Price history
+0.0% since first listed2 events — show timeline
- 2026-06-12 Listed $60,000 MiRealSource-MiMLS
- 2026-06-12 Listed $60,000 SW Michigan MLS
Cash-flow waterfall
monthlySold comps — $/sqft
last 12 mo · ≤1 miLoading sold comps…