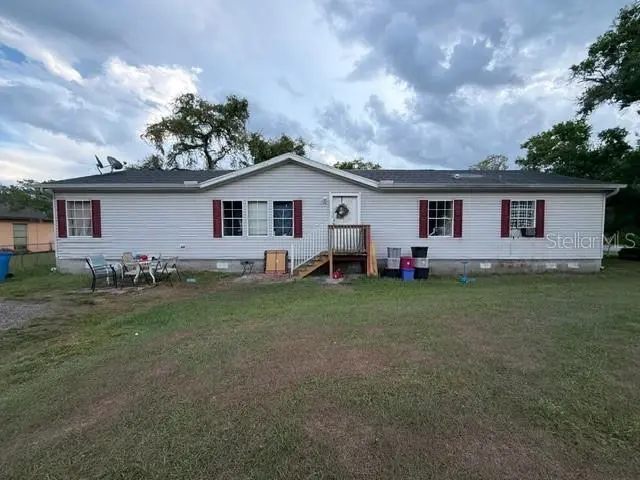
7408 Alvina St · Citrus Park, FL
Flood risk 1/10 · Minimal
- FEMA flood zone
- X (unshaded)
- Chance of flooding over 30 yrs
- 0.0%
- Est. flood insurance / yr
- $507 – $1,088
Fire risk 3/10 · Minor
- Est. fire insurance / yr
- $947 – $1,759
Heat risk 10/10 · Severe
- Hot days now (above 107°F)
- 7 days/yr
- Hot days in 30 yrs
- 26 days/yr
Wind risk 9/10 · Severe
- Chance of severe wind over 30 yrs
- 99.0%
Air-quality risk 3/10 · Minor
- Unhealthy air days now
- 3 days/yr
- Unhealthy air days in 30 yrs
- 3 days/yr
Risk factors via First Street. Map © Google.
Why this score? — see what drove the B- grade
The composite is a weighted blend of 9 inputs, each scored 0–100. Each bar is that input's sub-score; the figure is the points it added to the 100-point composite (weight × sub-score).
- Cash flow +30.0/30.0
- DSCR +10.0/10.0
- 1% rule +8.1/10.0
- ARV discount +7.5/15.0
- Schools +4.2/10.0
- Livability +3.9/5.0
- Condition / age +2.5/5.0
- Rent growth +1.9/5.0
- Appreciation +0.0/10.0
$200,000
🖨 Deal sheet 📄 Offer letter ✓ Due diligence
Listing remarks MLS
This 4 bedroom 2 bathroom 1,700+ square foot home has been beautifully remodeled and boasts all new flooring, appliances, light fixtures, updated bathrooms, and fresh paint. Relax in your garden tub, or take your book outside to your shaded oversized corner lot. HOA information is not guaranteed by seller and/or listing agent/office. Buyer/buyers agent MUST verify all information. Home sold AS-IS. Any RE Agent attempting to buy this property must disclose it at the time the offer is made. All information believed to be accurate, buyer/buyers agent must verify all. All offers submitted subject to financing, must be accompanied by a pre-qual letter. WAITING PERIOD: . WAITING PERIOD: Calendar Days 1-7: All offers will be rejected. We want REOs to have the exposure to the market and potential buyers. The date the property is listed is counted as Day 1. Calendar Days 8-15: PAS will entertain offers from all buyers except buyers purchasing as a secondary residence, parent(s) buying a home for their child/family, and investors. Offers that will be entertained include the following: Buyers purchasing a property as their primary residence Municipalities purchasing a residence or a vacant lot Non-profit buyers purchasing a residence or a vacant lot. Calendar Days 16+: We will entertain offers from all buyers once any offers received during days 8-15 have been fully vetted.
Key facts
- 0.25 acre lot
- Built 2001
Neighborhood map
What this means for you Summary
Snapshot
- This is a 4-bed/2.0-bath single-family listed at $200k.
Deal economics
- At list price, monthly cash flow is $752 ($9k/yr) — positive.
- The deal already cash-flows at list — no discount required.
- Meets the 1% rule at list price ($3k rent vs $200k).
Location & tenants
- Location reads 78/100 on livability (#176 in FL, #2,666 nationally) — a middle-class / working-renter tenant base. Strengths: housing A+, crime A, schools A-; Watch: amenities F.
- Hillsborough (suburban): math 47% / reading 50% proficiency, ranked #41 of 73 in FL (top 56%) — families likely to look elsewhere, expect single-tenant / working-renter base with shorter leases.
- Market conditions: Rents soft (-2.2%/yr); 169 active listings in the ZIP; 18 comparable units currently listed for rent nearby; rentals at typical pace (median 18d on market — plan ~3-4 weeks tenant-placement turnaround); solid renter incomes; 9,053 units permitted in Hillsborough County in 2024 (4,555 in 5+ unit buildings).
- This rent runs 34% of the median local income ($93k/yr) — at the standard rent-burdened threshold; future hikes will face affordability resistance.
Forward outlook
- Local home prices are declining (-3.0%/yr); year-one equity from $1k of loan paydown is wiped out by about $6k of value loss. Plan a longer hold.
- Hillsborough County population projected at +37% by 2050 — long-run rental-demand tailwind backs the buy-and-hold thesis.
Negotiation context
- Only 1 days on market — expect competitive offers; lowballing is unlikely to land.
- 2 sale attempts since 12y ago with the ask held roughly flat each time — persistent listings suggest the price (not the market) is what's stuck; bring a comps-based counter.
- Current owner paid $70k; list at $200k implies a 186% gain — meaningful room to come down on a strong offer.
Risks & watch-outs
- Climate carrying-cost: severe wind risk, 99% chance of damaging wind over 30y; extreme-heat days projected 7→26/yr by 2055 (HVAC capex compounding) — expect insurance premiums to compound above CPI over the hold.
Questions for the listing agent
- Is there a deadline driving the sale (1031 exchange, divorce, estate, relocation)? That informs how much negotiation room exists.
- Schools are A-rated — typically a magnet for longer-tenancy family renters. What's the average tenant stay here, and is there a school-zone premium baked into asking?
- What's the average days-on-market for RENTAL listings here right now (not sales)? A rising rental-DOM trend means longer vacancies and softer asking-rent achievability than the comps imply.
- What's the recent tenant-quality profile in this submarket — average credit score on applications, eviction rate, late-payment / NSF rate, and stable-employment percentage? A property-management company in the area should have these aggregated.
- How much new for-sale + rental construction is in the pipeline within 1–3 miles? Heavy new supply typically softens prices + rents 12–24 months out; constrained supply supports both.
Investment metrics
- 1% rule
- 1.31% ✓
- Cap rate
- 10.81%
- Cash-on-cash
- 16.11%
- DSCR
- 1.72
- GRM
- 6.4
CMA / ARV
No comps found within radius.
Projected returns pro-forma
-3.0% appreciation · 0.0% rent growth · sell at horizon
- IRR
- 3.7%
- Equity multiple
- 1.14×
- Total profit
- $7,807
- Equity at exit
- $29,821
- IRR
- 10.3%
- Equity multiple
- 1.69×
- Total profit
- $38,790
- Equity at exit
- $17,292
Cash invested: $56,000 (down + closing). Projections, not guarantees.
Landlord ↔ Tenant lean methodology
- Overall (STATE)
- 87 Strongly Landlord-Friendly
- State Florida
- 87 Strongly Landlord-Friendly · R+3
- County
- — inherits STATE
- City
- — inherits STATE
ZIP-level market 33625
- Home prices YoY
- -31.6%
- Rents YoY
- -2.2%
- Active inventory
- 169
- Price-to-rent
- 6.4×
Monthly cashflow live
- Estimated rent
- $2,621 high interval (Pro) →
- Mortgage (P&I)
- −$1,049
- Tax from tax record
- −$186 /mo · $2,238/yr
- Insurance
- −$83
- HOA
- −$0
- Vacancy / Maint / Mgmt
- −$550
- Net cashflow
- $752
Break-even live
UW: 25.0% down · 7.5% · 30yr · 1.5% tax · 5.0% vac · 8.0% maint · 8.0% mgmt
Financing live
Cash to close
- Down payment
- $50,000
- Closing costs
- $6,000
- Reserves months
- —
- Total cash needed
- —
Loan-product check · same deal, 3 products live
Conventional
25% down · 7.5% · 30yr
- Down + closing
- —
- Monthly P&I
- —
- Monthly cashflow
- —
- DSCR
- —
- Eligible?
- —
Personal DTI + credit; lowest rate.
DSCR
20% down · 8.5% · 30yr
- Down + closing
- —
- Monthly P&I
- —
- Monthly cashflow
- —
- DSCR
- —
- Eligible?
- —
No personal income docs; deal must DSCR.
Hard money
10% down · 12.0% · 12mo
- Down + closing
- —
- Monthly P&I
- —
- Monthly cashflow
- —
- DSCR
- —
- Eligible?
- —
Short-term bridge; refi at stabilization.
Rent comps 18 comps
| Address | Beds | Baths | Sqft | Rent | $/sqft | DOM | Units | Dist |
|---|---|---|---|---|---|---|---|---|
| 7308 Alvina St Tampa, FL | 3.0 | 2.0 | 1232 | $2,295 | $1.86 | 3d | 1 | 0.08mi |
| 7615 Lemon Wood Ct Tampa, FL | 3.0 | 2.0 | 1326 | $2,300 | $1.73 | 18d | 1 | 0.49mi |
| 7940 Citrus Garden Dr Tampa, FL | 1.0–3.0 | 1.0–3.0 | 1152 | $2,642 | $2.29 | 15d | 24 | 0.59mi |
| 8509 Primrose Willow Pl Odessa, FL | 3.0 | 2.5 | 1716 | $2,690 | $1.57 | 24d | 1 | 0.59mi |
| 8509 Primrose Willow Pl Odessa, FL | 3.0 | 3.0 | 1716 | $2,690 | $1.57 | 22d | 1 | 0.59mi |
| 8518 Primrose Willow Pl Odessa, FL | 3.0 | 2.5 | 1716 | $2,900 | $1.69 | 5d | 1 | 0.63mi |
| 14124 Damselfly Dr Tampa, FL | 3.0 | 2.5 | 1961 | $2,750 | $1.40 | 18d | 1 | 0.64mi |
| 6408 Beaver Way Tampa, FL | 3.0 | 2.0 | 1564 | $2,500 | $1.60 | 12d | 1 | 0.78mi |
| 13306 Canopy Grove Dr Tampa, FL | 1.0–3.0 | 1.0–2.5 | 1022 | $2,891 | $2.83 | 3d | 32 | 0.82mi |
| 15313 Heathridge Dr Tampa, FL | 4.0 | 2.0 | 2090 | $2,810 | $1.34 | 22d | 1 | 0.91mi |
| 8134 Colonial Village Dr Tampa, FL | 1.0–3.0 | 1.0–2.0 | 1113 | $2,385 | $2.14 | 2d | 12 | 0.92mi |
| 8517 Fawn Creek Dr Tampa, FL | 3.0 | 2.0 | 1549 | $2,550 | $1.65 | 24d | 1 | 1.13mi |
| 8613 Fawn Creek Dr Tampa, FL | 3.0 | 2.0 | 1797 | $2,600 | $1.45 | 22d | 1 | 1.17mi |
| 8748 Hampden Dr Tampa, FL | 4.0 | 2.0 | 1780 | $2,700 | $1.52 | 24d | 1 | 1.19mi |
| 8735 Exposition Dr Tampa, FL | 3.0 | 2.0 | 1250 | $2,699 | $2.16 | 18d | 1 | 1.28mi |
| 8741 Exposition Dr Tampa, FL | 3.0 | 2.0 | 1366 | $2,450 | $1.79 | 3d | 1 | 1.30mi |
| 12780 Olive Jones Rd Tampa, FL | 1.0–3.0 | 1.0–2.0 | 1036 | $2,389 | $2.31 | 2d | 53 | 1.33mi |
| 6201 Gunn Hwy Tampa, FL | 1.0–3.0 | 1.0–2.0 | 1052 | $2,426 | $2.31 | 10d | 16 | 1.38mi |
Listing history 6 events
-
2026-04-03status Pending
-
2026-04-02$200,000 Active
-
2014-04-15soldstatus $70,000 Sold 1389-char remark
Show marketing remark (1389 chars)
This 4 bedroom 2 bathroom 1,700+ square foot home has been beautifully remodeled and boasts all new flooring, appliances, light fixtures, updated bathrooms, and fresh paint. Relax in your garden tub, or take your book outside to your shaded oversized corner lot. HOA information is not guaranteed by seller and/or listing agent/office. Buyer/buyers agent MUST verify all information. Home sold AS-IS. Any RE Agent attempting to buy this property must disclose it at the time the offer is made. All information believed to be accurate, buyer/buyers agent must verify all. All offers submitted subject to financing, must be accompanied by a pre-qual letter. WAITING PERIOD: . WAITING PERIOD: Calendar Days 1-7: All offers will be rejected. We want REOs to have the exposure to the market and potential buyers. The date the property is listed is counted as Day 1. Calendar Days 8-15: PAS will entertain offers from all buyers except buyers purchasing as a secondary residence, parent(s) buying a home for their child/family, and investors. Offers that will be entertained include the following: Buyers purchasing a property as their primary residence Municipalities purchasing a residence or a vacant lot Non-profit buyers purchasing a residence or a vacant lot. Calendar Days 16+: We will entertain offers from all buyers once any offers received during days 8-15 have been fully vetted.
-
2014-03-07$54,900 1389-char remark
Show marketing remark (1389 chars)
This 4 bedroom 2 bathroom 1,700+ square foot home has been beautifully remodeled and boasts all new flooring, appliances, light fixtures, updated bathrooms, and fresh paint. Relax in your garden tub, or take your book outside to your shaded oversized corner lot. HOA information is not guaranteed by seller and/or listing agent/office. Buyer/buyers agent MUST verify all information. Home sold AS-IS. Any RE Agent attempting to buy this property must disclose it at the time the offer is made. All information believed to be accurate, buyer/buyers agent must verify all. All offers submitted subject to financing, must be accompanied by a pre-qual letter. WAITING PERIOD: . WAITING PERIOD: Calendar Days 1-7: All offers will be rejected. We want REOs to have the exposure to the market and potential buyers. The date the property is listed is counted as Day 1. Calendar Days 8-15: PAS will entertain offers from all buyers except buyers purchasing as a secondary residence, parent(s) buying a home for their child/family, and investors. Offers that will be entertained include the following: Buyers purchasing a property as their primary residence Municipalities purchasing a residence or a vacant lot Non-profit buyers purchasing a residence or a vacant lot. Calendar Days 16+: We will entertain offers from all buyers once any offers received during days 8-15 have been fully vetted.
-
1989-05-01soldstatus $25,000
-
1984-02-01soldstatus $19,000
ⓘ Source: listings_history table (triggers on properties + properties_extension) + one-shot
backfill from property_details.listing_events for pre-trigger history.
Tax reassessment forecast FL · Resets to sale price
- Current annual tax
- $2,238 · $186/mo
- Projected year-2 tax
- $2,238 · $186/mo
- Expected delta
- $0/yr ($0/mo · 0.0%)
ⓘ Screening estimate from a state-policy table — verify with the county assessor before closing.
Climate risk First Street
- Flood 1/10 Low FEMA zone X (unshaded) · 0% chance over 30 yrs
- Wildfire 3/10 Moderate
- Heat 10/10 Extreme 7 d/yr ≥107°F today · 26 d/yr by 30 yrs out
- Wind 9/10 Extreme 99% chance of damaging wind over 30 yrs
- Air quality 3/10 Moderate 3 unhealthy d/yr today · 3 by 30 yrs out
Nearby sold comps map
Loading sold comps map…
Walkable amenities ~0.75 mi
Loading nearby amenities…
Taxation est. · year 1
- Rental income
- $31,453
- − Mortgage interest
- −$11,203
- − Property taxes
- −$2,238
- − Insurance
- −$1,000
- − Repairs & maintenance
- −$2,516
- − Management
- −$2,516
- − Depreciation
- −$5,818
- Taxable income
- $6,162
- Est. tax owed @ 24.0%
- −$1,479
- After-tax cash flow
- $7,546/yr
For passive investors: Depreciation is non-cash, so a rental often shows a tax loss while cash-flowing — sheltering income. Rental losses are passive: they offset passive income freely, and up to $25,000/yr can offset ordinary (W-2) income if you actively participate and your MAGI is under $100k (phasing out to $0 by $150k); unused losses carry forward. On sale, claimed depreciation is recaptured at up to 25%, and gains may owe capital-gains tax (a 1031 exchange can defer both). Figures are a year-1 estimate at your 24.0% rate — not tax advice; consult a CPA.
Schools (NCES district)
- District
- Hillsborough
- NCES district ID
- 1200870
- Math proficiency
- 47% ▼ -8.00%
- Reading proficiency
- 50% ▼ -4.00%
- Median HH income
- $50,622
- Composite
- 41.6/100
- National rank
- #3435
- State rank
- #41 of 73 in FL
Livability — Citrus Park
- Score
- 78/100
- State rank
- #176
- US rank
- #2666
Category grades
Schools grade is shown separately in the Schools card above.
Census & demographics
- Census place
- Citrus Park, FL
- County
- Hillsborough County · 1,540,968 people
- City population
- 29,967
- Metro
- Tampa-St. Petersburg-Clearwater, FL
- Population (ZIP)
- 29,967
- Household income
- $93,133
- Rent vs Own
- Severe rent burden
- 1084.0
Population outlook (Hillsborough County) Hauer SSP2
- Today (2025)
- 1,607,022 people
- By 2030
- 1,733,968 · +7.9%
- By 2040
- 1,979,565 · +23.2%
- By 2050
- 2,203,427 · +37.1%
- By 2075
- 2,667,893 · +66.0%
- By 2100
- 2,891,558 · +79.9%
Race, ethnicity, and origin ACS 2023
- Neighborhood character
- Diverse neighborhood (Simpson 0.64)
- Race & ethnicity
- Hispanic / Latino 44% White 39% Two or more races 26% Black 7% Asian 4%
- Hispanic origin (detail)
- Puerto Rican 10% Cuban 12% Dominican 3%
- Common ancestry
- Romanian 2% Slovak 1% Italian 1%
- Foreign-born
- 28% · Canada, Jamaica, Vietnam
- Languages at home
- 55% English-only · Spanish 38% Other Asian/Pacific 2% Vietnamese 2%
Political lean MEDSL · Hillsborough
- 2024 margin
- Toss-up / Even · D 47.8% · R 50.9% · Other 1.3%
- 2008→2024 swing
- -10.2pp toward R · 2008: 7.1pp · 2024: -3.1pp
- All cycles
- 2024: R+3.1 2020: D+6.9 2016: D+6.8 2012: D+6.7 2008: D+7.1
Not yet ingested
- Civics
- —
Market trends
- HPI YoY
- ▼ -165.85%
- Current HPI
- 359.52
- Rent YoY
- ▼ -2.23%
- Metro
- Tampa-St. Petersburg-Clearwater, FL
- State GDP YoY
- ▲ 3.28%
- F500 in state
- 36
Industry mix (Fortune 500 HQ in FL)
| Industry | F500 HQs | Revenue |
|---|---|---|
| Industrial Technology | 2 | $29B |
|
||
| Insurance | 2 | $17B |
|
||
| Retail | 1 | $60B |
|
||
| Technology Distribution | 1 | $58B |
|
||
| Homebuilding | 1 | $35B |
|
||
| Technology Manufacturing | 1 | $35B |
|
||
Price history
+952.6% since first listed6 events — show timeline
- 2026-04-03 Pending — Stellar MLS as Distributed by MLS Grid
- 2026-04-02 Listed $200,000 Stellar MLS as Distributed by MLS Grid
- 2014-04-15 Sold (MLS) $70,000 Stellar MLS as Distributed by MLS Grid
- 2014-03-07 Listed $54,900 Stellar MLS as Distributed by MLS Grid
- 1989-05-01 Sold (Public Records) $25,000 Public Records
- 1984-02-01 Sold (Public Records) $19,000 Public Records
Property tax history
+5.8%/yrLatest (2025): $2,238 · +12.4% YoY. Source: county tax records.
Cash-flow waterfall
monthlySold comps — $/sqft
last 12 mo · ≤1 miLoading sold comps…