183 Seaton Rd · Stamford, CT
Flood risk No data
- FEMA flood zone
- —
- Chance of flooding over 30 yrs
- —
- Est. flood insurance / yr
- —
Fire risk No data
- Est. fire insurance / yr
- —
Heat risk No data
- Hot days now (above threshold)
- —
- Hot days in 30 yrs
- —
Wind risk No data
- Chance of severe wind over 30 yrs
- —
Air-quality risk No data
- Unhealthy air days now
- —
- Unhealthy air days in 30 yrs
- —
Risk factors via First Street. Map © Google.
Why this score? — see what drove the D grade
The composite is a weighted blend of 9 inputs, each scored 0–100. Each bar is that input's sub-score; the figure is the points it added to the 100-point composite (weight × sub-score).
- Cash flow +14.8/30.0
- ARV discount +7.5/15.0
- DSCR +4.5/10.0
- 1% rule +4.1/10.0
- Schools +3.5/10.0
- Livability +3.5/5.0
- Rent growth +3.0/5.0
- Condition / age +2.0/5.0
- Appreciation +0.0/10.0
$286,000
🖨 Deal sheet (PDF) 📄 Offer letter ✓ Due diligence
Listing remarks
1st floor condo sale new kitchen cabinets and windows laundry area assigned parking space up date bathroom asking price 276.000.00
Key facts
- New kitchen cabinets
- Built 1951
- Listed 26 days
Tags
Property features AI
Exterior
- Home design: Built in 1951
- Construction: Living area approximately 775
- Exterior features: Located in the East Side of Stamford neighborhood
Neighborhood map
What this means for you Summary
Snapshot
- This is a 2-bed/1.0-bath other listed at $286k. Condition is rated fair.
Deal economics
- At list price, monthly cash flow is $81 ($969/yr) — positive.
- The deal already cash-flows at list — no discount required.
- To meet the 1% rule (rent ≥ 1% of price), the offer needs to be $260k (8.9% below list).
- Recommended offer: $260k (8.9% below list) — sets the bar for 1% rule.
- Cap rate 6.6% vs local median 3.0% in Stamford — top-decile yield for the area; either an underpriced asset or a hidden risk that comps aren't pricing in. Stress-test before assuming the spread holds.
Location & tenants
- Location reads 70/100 on livability (#98 in CT) — a middle-class / working-renter tenant base. Strengths: employment A+, health & safety A+, crime A-; Watch: amenities F, commute F, cost of living F.
- Stamford School District (urban): math 32% / reading 43% proficiency, ranked #103 of 153 in CT (top 67%) — families likely to look elsewhere, expect single-tenant / working-renter base with shorter leases.
- Zoned schools: Julia A. Stark School (math 32% / reading 40%, grade F, #333 of 553 statewide, top 60%, 593 students, 57% FRL); Dolan School (math 22% / reading 41%, grade F, #134 of 175 statewide, top 77%, 611 students, 59% FRL); Stamford High School (math 31% / reading 56%, grade F, #98 of 194 statewide, top 51%, 2,048 students, 53% FRL).
- Market conditions: Rents rising (+1.9%/yr); 190 active listings in the ZIP; 40 comparable units currently listed for rent nearby; rentals at typical pace (median 26d on market — plan ~3-4 weeks tenant-placement turnaround); solid renter incomes; 1,151 units permitted in Western Connecticut Planning Region in 2024 (714 in 5+ unit buildings).
- This rent runs 33% of the median local income ($95k/yr) — at the standard rent-burdened threshold; future hikes will face affordability resistance.
Forward outlook
- Local home prices are declining (-3.0%/yr); year-one equity from $2k of loan paydown is wiped out by about $9k of value loss. Plan a longer hold.
Negotiation context
- It's been on market 26 days — a 2% lower offer ($282k) is reasonable based on typical stale-listing flexibility.
Risks & watch-outs
- Watch-outs: built in 1951 — expect roof / HVAC / electrical / plumbing capex.
Questions for the listing agent
- Have any recent inspections been done? Can we get a copy of the seller's disclosures and any deferred-maintenance estimates?
- Built in 1951 — when were the roof, HVAC, electrical panel, plumbing, and water heater last replaced?
- Is there a deadline driving the sale (1031 exchange, divorce, estate, relocation)? That informs how much negotiation room exists.
- Schools are B-rated — typically a magnet for longer-tenancy family renters. What's the average tenant stay here, and is there a school-zone premium baked into asking?
- The area grade is low — what's the realistic commute time and amenity access for the typical tenant pool here? Any planned neighborhood developments (good or bad) we should know about?
- What's the average days-on-market for RENTAL listings here right now (not sales)? A rising rental-DOM trend means longer vacancies and softer asking-rent achievability than the comps imply.
- What's the recent tenant-quality profile in this submarket — average credit score on applications, eviction rate, late-payment / NSF rate, and stable-employment percentage? A property-management company in the area should have these aggregated.
- How much new for-sale + rental construction is in the pipeline within 1–3 miles? Heavy new supply typically softens prices + rents 12–24 months out; constrained supply supports both.
Investment metrics
- 1% rule
- 0.91% ✗
- Cap rate
- 6.63%
- Cash-on-cash
- 1.21%
- DSCR
- 1.05
- GRM
- 9.2
CMA / ARV
No comps found within radius.
Projected returns pro-forma
-3.0% appreciation · 1.95% rent growth · sell at horizon
- IRR
- -15.5%
- Equity multiple
- 0.45×
- Total profit
- $-43,887
- Equity at exit
- $42,644
- IRR
- -8.9%
- Equity multiple
- 0.47×
- Total profit
- $-42,376
- Equity at exit
- $24,728
Cash invested: $80,080 (down + closing). Projections, not guarantees.
Landlord ↔ Tenant lean methodology
- Overall (STATE)
- 27 Tenant-Leaning
- State Connecticut
- 27 Tenant-Leaning · D+7
- County
- — inherits STATE
- City
- — inherits STATE
ZIP-level market 06902
- Rents YoY
- 1.9%
- Active inventory
- 190
- Price-to-rent
- 9.2×
Monthly cashflow live
- Estimated rent
- $2,604 high interval (Pro) →
- Mortgage (P&I)
- −$1,500
- Tax est. 1.5%
- −$358 /mo · $4,290/yr
- Insurance
- −$119
- HOA
- −$0
- Vacancy / Maint / Mgmt
- −$547
- Net cashflow
- $81
Break-even live
Sensitivity live
| Price | -10% $278 | -5% $180 | +0% $81 | +5% $-18 | +10% $-117 |
|---|---|---|---|---|---|
| Rent | -10% $-125 | -5% $-22 | +0% $81 | +5% $184 | +10% $286 |
| Rate | -1.0pp $225 | -0.5pp $153 | base $81 | +0.5pp $7 | +1.0pp $-69 |
UW: 25.0% down · 7.5% · 30yr · 1.5% tax · 5.0% vac · 8.0% maint · 8.0% mgmt
Financing live
Cash to close
- Down payment
- $71,500
- Closing costs
- $8,580
- Reserves months
- —
- Total cash needed
- —
Loan-product check · same deal, 3 products live
Conventional
25% down · 7.5% · 30yr
- Down + closing
- —
- Monthly P&I
- —
- Monthly cashflow
- —
- DSCR
- —
- Eligible?
- —
Personal DTI + credit; lowest rate.
DSCR
20% down · 8.5% · 30yr
- Down + closing
- —
- Monthly P&I
- —
- Monthly cashflow
- —
- DSCR
- —
- Eligible?
- —
No personal income docs; deal must DSCR.
Hard money
10% down · 12.0% · 12mo
- Down + closing
- —
- Monthly P&I
- —
- Monthly cashflow
- —
- DSCR
- —
- Eligible?
- —
Short-term bridge; refi at stabilization.
Rent comps 40 comps
| Address | Beds | Baths | Sqft | Rent | $/sqft | DOM | Units | Dist |
|---|---|---|---|---|---|---|---|---|
| 34 Standish Rd #3 Stamford, CT | 2.0 | 1.0 | 633 | $2,200 | $3.48 | 45d | 1 | 0.04mi |
| 23 Revere Dr #3 Stamford, CT | 2.0 | 1.0 | 775 | $2,700 | $3.48 | 25d | 1 | 0.05mi |
| 6 Revere Dr #3 Stamford, CT | 2.0 | 1.0 | 775 | $2,600 | $3.35 | 25d | 1 | 0.06mi |
| 1068 E Main St #3 Stamford, CT | 2.0 | 1.0 | 710 | $2,400 | $3.38 | 45d | 1 | 0.11mi |
| 1046 E Main St #4 Stamford, CT | 2.0 | 1.0 | 763 | $2,800 | $3.67 | 5d | 1 | 0.13mi |
| 231 Seaton Rd #2 Stamford, CT | 2.0 | 1.0 | 775 | $2,700 | $3.48 | 16d | 1 | 0.13mi |
| 246 Seaton Rd #2 Stamford, CT | 1.0 | 1.0 | 575 | $1,975 | $3.43 | 45d | 1 | 0.16mi |
| 44 Blachley Rd Stamford, CT | 2.0 | 1.0 | 975 | $2,595 | $2.66 | 45d | 2 | 0.24mi |
| 18 Hamilton Ct Unit B Stamford, CT | 2.0 | 1.0 | 975 | $2,650 | $2.72 | 25d | 1 | 0.34mi |
| 48 Lockwood Ave Unit 3 Stamford, CT | 1.0 | 1.0 | 600 | $1,800 | $3.00 | 16d | 1 | 0.38mi |
| 333 Hamilton Ave Stamford, CT | 1.0–2.0 | 1.0 | 900 | $2,650 | $2.94 | 25d | 3 | 0.38mi |
| 28 Hamilton Ct Unit D Stamford, CT | 1.0 | 1.0 | 825 | $2,295 | $2.78 | 25d | 1 | 0.38mi |
| 14 Hamilton Ct Unit A Stamford, CT | 2.0 | 1.0 | 975 | $2,595 | $2.66 | 45d | 1 | 0.39mi |
| 25 Clovelly Rd Unit 1 Stamford, CT | 2.0 | 1.5 | 1080 | $2,350 | $2.18 | 45d | 1 | 0.45mi |
| 250 Glenbrook Rd Unit D Stamford, CT | 2.0 | 1.0 | 1050 | $2,500 | $2.38 | 45d | 1 | 0.45mi |
| 96 Lockwood Ave Unit 1 Stamford, CT | 2.0 | 1.0 | 700 | $2,200 | $3.14 | 5d | 1 | 0.49mi |
| 850 E Main St Stamford, CT | 2.0 | 2.0 | 1080 | $3,038 | $2.81 | 5d | 2 | 0.54mi |
| 850 E Main St #412 Stamford, CT | 2.0 | 2.0 | 1080 | $3,050 | $2.82 | 16d | 1 | 0.55mi |
| 106 Lafayette St Unit 3 Stamford, CT | 1.0 | 1.0 | 1000 | $1,550 | $1.55 | 21d | 1 | 0.55mi |
| 54 Hope St Unit S Stamford, CT | 2.0 | 2.0 | 952 | $2,800 | $2.94 | 25d | 1 | 0.56mi |
| 97 Glenbrook Rd Unit t415 Stamford, CT | 2.0 | 2.0 | 1050 | $2,865 | $2.73 | 45d | 1 | 0.57mi |
| 77 Glenbrook Rd #202 Stamford, CT | 1.0 | 1.0 | 800 | $2,150 | $2.69 | 45d | 1 | 0.59mi |
| 87 Glenbrook Rd Unit 7G Stamford, CT | 2.0 | 1.0 | 910 | $2,650 | $2.91 | 12d | 1 | 0.59mi |
| 87 Glenbrook Rd Stamford, CT | 1.0–2.0 | 1.0 | 872 | $2,650 | $3.04 | 16d | 2 | 0.59mi |
| 65 Glenbrook Rd Stamford, CT | 1.0–2.0 | 1.5–2.0 | 1208 | $3,400 | $2.81 | 45d | 2 | 0.59mi |
| 100 Glenbrook Rd Unit T411 Stamford, CT | 1.0 | 1.0 | 628 | $2,475 | $3.94 | 5d | 1 | 0.61mi |
| 100 Glenbrook Rd Unit T414 Stamford, CT | 1.0 | 1.0 | 628 | $2,269 | $3.61 | 45d | 1 | 0.61mi |
| 39 Glenbrook Rd Stamford, CT | 1.0–2.0 | 1.0 | 1002 | $2,600 | $2.59 | 45d | 2 | 0.63mi |
| 39 Glenbrook Rd Stamford, CT | 1.0–2.0 | 1.0 | 967 | $2,600 | $2.69 | 4d | 1 | 0.63mi |
| 25 Glenbrook Rd Stamford, CT | 1.0–3.0 | 1.0–2.0 | 1331 | $3,978 | $2.99 | 13d | 8 | 0.67mi |
| 36 Givens Ave Unit 1 Stamford, CT | 1.0 | 1.0 | 720 | $2,300 | $3.19 | 45d | 1 | 0.67mi |
| 791 E Main St Apt 3F Stamford, CT | 1.0 | 1.0 | 600 | $2,000 | $3.33 | 25d | 1 | 0.67mi |
| 791 E Main St Unit 2D Stamford, CT | 2.0 | 1.0 | 750 | $2,750 | $3.67 | 25d | 1 | 0.67mi |
| 28 Hobbie St Stamford, CT | 2.0 | 1.0 | 844 | $2,995 | $3.55 | 16d | 1 | 0.68mi |
| 28 Hobbie St Stamford, CT | 2.0 | 1.0 | 844 | $3,200 | $3.79 | 45d | 1 | 0.68mi |
| 5 Daly St Unit 2nd floor Stamford, CT | 2.0 | 1.0 | 1000 | $2,850 | $2.85 | 16d | 1 | 0.68mi |
| 30 Glenbrook Rd Unit 2E Stamford, CT | 2.0 | 1.0 | 1068 | $3,000 | $2.81 | 25d | 1 | 0.69mi |
| Stamford Cv Stamford, CT | 1.0 | 1.0 | 850 | $2,200 | $2.59 | 45d | 1 | 0.70mi |
| 637 Cove Rd Unit A3 Stamford, CT | 1.0 | 1.0 | 796 | $2,150 | $2.70 | 25d | 1 | 0.72mi |
| 47 Lindale St Unit B Stamford, CT | 2.0 | 1.0 | 575 | $2,200 | $3.83 | 25d | 1 | 0.74mi |
Listing history 17 events
-
2026-06-21days on market $286,000 Active 26 DOM
-
2026-06-18days on market $286,000 Active 23 DOM
-
2026-06-17days on market $286,000 Active 22 DOM
-
2026-06-16pricedays on market $286,000 Active 21 DOM
-
2026-06-15days on market $282,000 Active 20 DOM
-
2026-06-13days on market $282,000 Active 18 DOM
-
2026-06-13days on market $282,000 Active 17 DOM
-
2026-06-10days on market $282,000 Active 15 DOM
-
2026-06-09days on market $282,000 Active 14 DOM
-
2026-06-08days on market $282,000 Active 13 DOM
-
2026-06-07days on market $282,000 Active 12 DOM
-
2026-06-05days on market $282,000 Active 9 DOM
-
2026-06-03days on market $282,000 Active 8 DOM
-
2026-06-03days on market $282,000 Active 7 DOM
-
2026-06-01days on market $282,000 Active 6 DOM
-
2026-05-31days on market $282,000 Active 5 DOM
-
2026-05-26$282,000 Active
ⓘ Source: listings_history table (triggers on properties + properties_extension) + one-shot
backfill from property_details.listing_events for pre-trigger history.
Nearby sold comps map
Loading sold comps map…
Walkable amenities ~0.75 mi
Loading nearby amenities…
Taxation est. · year 1
- Rental income
- $31,248
- − Mortgage interest
- −$16,020
- − Property taxes
- −$4,290
- − Insurance
- −$1,430
- − Repairs & maintenance
- −$2,500
- − Management
- −$2,500
- − Depreciation
- −$8,320
- Taxable loss
- −$3,812
- Est. tax savings @ 24.0%
- +$915
- After-tax cash flow
- $1,883/yr
For passive investors: Depreciation is non-cash, so a rental often shows a tax loss while cash-flowing — sheltering income. Rental losses are passive: they offset passive income freely, and up to $25,000/yr can offset ordinary (W-2) income if you actively participate and your MAGI is under $100k (phasing out to $0 by $150k); unused losses carry forward. On sale, claimed depreciation is recaptured at up to 25%, and gains may owe capital-gains tax (a 1031 exchange can defer both). Figures are a year-1 estimate at your 24.0% rate — not tax advice; consult a CPA.
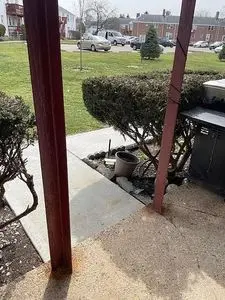
Condition & rehab AI · 1 photo
The home requires significant repairs to the exterior and flooring due to water damage, impacting its overall condition and value. Immediate repairs are necessary to stabilize the structure and improve its appearance for resale or rental.
Repairs flagged
- Major exterior wall — Significant water damage and discoloration, likely requiring structural repairs.
- Major flooring — Visible water damage and discoloration, indicating potential structural issues that need addressing.
Value-add opportunities
- Resale repair and paint exterior walls — Aesthetic improvements and structural repairs will enhance the home's curb appeal and marketability.
- Rental repair and replace flooring — A functional and visually appealing floor will attract tenants and improve the home's rental value.
Renovation cost estimate screening
| Repair item | Severity | Est. cost |
|---|---|---|
| exterior wall · Significant water damage and discoloration, likely requiring structural repairs. | Major | $15,000–50,000 |
| flooring · Visible water damage and discoloration, indicating potential structural issues that need addressing. | Major | $15,000–50,000 |
| Total estimated repair cost · 2 items | $30,000–100,000 |
Value-add ROI direction
- Resale repair and paint exterior walls — Aesthetic improvements and structural repairs will enhance the home's curb appeal and marketability. ↑
- Rental repair and replace flooring — A functional and visually appealing floor will attract tenants and improve the home's rental value. ↑
ⓘ Cost ranges are severity-bucket heuristics (US national rule-of-thumb). Get contractor quotes + a written scope before underwriting a rehab budget.
Schools (NCES district)
- District
- Stamford School District
- NCES district ID
- 0904320
- Math proficiency
- 32% ▼ -10.00%
- Reading proficiency
- 43% ▼ -7.00%
- Median HH income
- $78,843
- Composite
- 35.14/100
- National rank
- #5010
- State rank
- #103 of 153 in CT
Livability — Stamford
- Score
- 70/100
- State rank
- #98
- US rank
- #7716
Category grades
Schools grade is shown separately in the Schools card above.
Census & demographics
- Census place
- Stamford, CT
- County
- Fairfield County · 765,532 people
- City population
- 123,058
- Metro
- Bridgeport-Stamford-Norwalk, CT
- Population (ZIP)
- 73,392
- Household income
- $94,843
- Rent vs Own
- Severe rent burden
- 4139.0
Population outlook (Western Connecticut County) Hauer SSP2
- By 2040
- 685,031
Race, ethnicity, and origin ACS 2023
- Neighborhood character
- Highly diverse neighborhood (Simpson 0.71)
- Race & ethnicity
- Hispanic / Latino 35% White 32% Black 23% Two or more races 13% Asian 7%
- Hispanic origin (detail)
- Mexican 3% Puerto Rican 4% Dominican 3%
- Common ancestry
- Hispanic 5% Romanian 3% Scotch-Irish 1%
- Foreign-born
- 36% · Canada, Jamaica, China
- Languages at home
- 51% English-only · Spanish 30% French/Haitian/Cajun 6% Other Indo-European 4%
Political lean MEDSL · Western Connecticut
- 2024 margin
- D (+19.1) · D 58.8% · R 39.7% · Other 1.6%
- All cycles
- 2024: D+19.1
Not yet ingested
- Civics
- —
Market trends
- HPI YoY
- ▼ -450.67%
- Current HPI
- 173.4108
- Rent YoY
- ▲ 1.95%
- Metro
- Bridgeport-Stamford-Norwalk, CT
- State GDP YoY
- ▲ 1.06%
- F500 in state
- 38
Industry mix (Fortune 500 HQ in CT)
| Industry | F500 HQs | Revenue |
|---|---|---|
| Industrial Machinery | 4 | $38B |
|
||
| Insurance | 3 | $71B |
|
||
| Financial Services | 2 | $25B |
|
||
| Transportation / Logistics | 2 | $18B |
|
||
| Healthcare | 1 | $247B |
|
||
| Telecommunications | 1 | $55B |
|
||
Price history
1 event — show timeline
- 2026-05-26 Listed $282,000 FSBO.com
Cash-flow waterfall
monthlySold comps — $/sqft
last 12 mo · ≤1 miLoading sold comps…