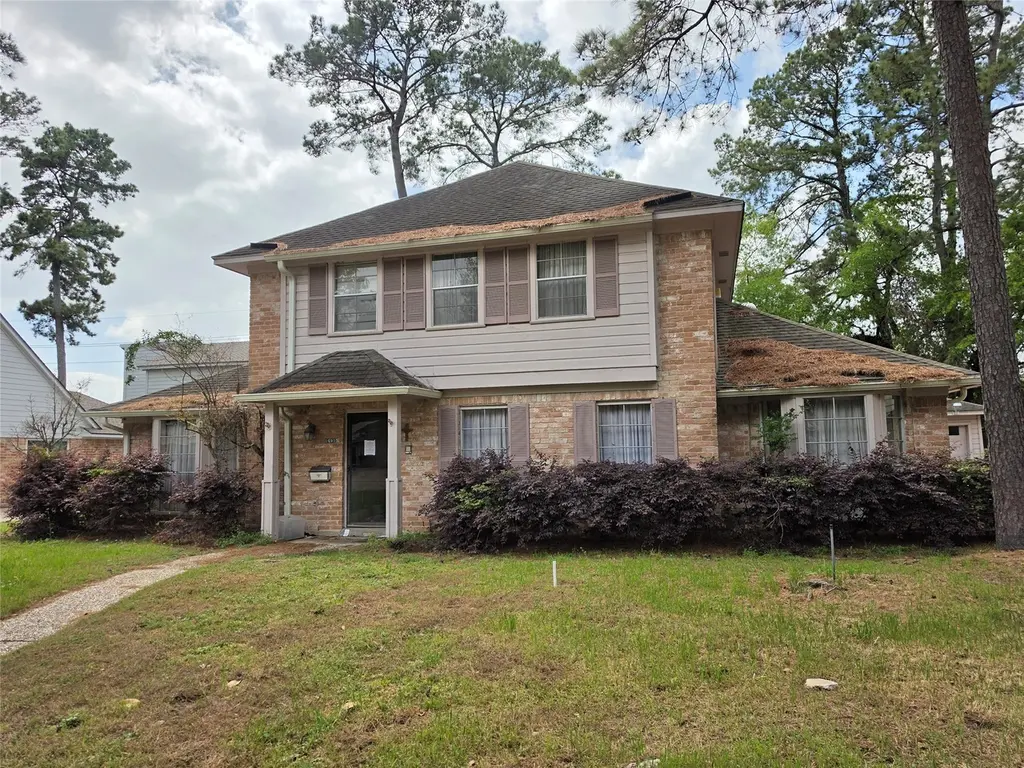
14915 Gladebrook Dr · Houston, TX
Flood risk 8/10 · Major
- FEMA flood zone
- X (unshaded)
- Chance of flooding over 30 yrs
- 0.99%
- Est. flood insurance / yr
- $507 – $1,088
Fire risk 2/10 · Minimal
- Est. fire insurance / yr
- $1,222 – $2,270
Heat risk 9/10 · Severe
- Hot days now (above 111°F)
- 7 days/yr
- Hot days in 30 yrs
- 23 days/yr
Wind risk 8/10 · Major
- Chance of severe wind over 30 yrs
- 99.0%
Air-quality risk 3/10 · Minor
- Unhealthy air days now
- 3 days/yr
- Unhealthy air days in 30 yrs
- 3 days/yr
Risk factors via First Street. Map © Google.
Why this score? — see what drove the B+ grade
The composite is a weighted blend of 9 inputs, each scored 0–100. Each bar is that input's sub-score; the figure is the points it added to the 100-point composite (weight × sub-score).
- Cash flow +30.0/30.0
- ARV discount +15.0/15.0
- 1% rule +10.0/10.0
- DSCR +10.0/10.0
- Appreciation +3.9/10.0
- Livability +3.7/5.0
- Rent growth +2.5/5.0
- Condition / age +2.5/5.0
- Schools +2.0/10.0
$225,000
🖨 Deal sheet 📄 Offer letter ✓ Due diligence
Listing remarks
Welcome to 14915 Gladebrook Drive—an inviting home that stands out with its functional layout, bright living spaces, and tasteful updates. The open-concept design connects the kitchen and main living area, creating a seamless flow ideal for everyday living and entertaining. Step outside to your private backyard retreat featuring a sparkling pool—perfect for relaxing or hosting during Houston’s warm seasons. With comfortable bedrooms, great curb appeal, and a convenient location near shopping and dining, this home offers a lifestyle that’s hard to match in the neighborhood.
Key facts
- 0.25 acre lot
- 2 garage spots
- Pool
Neighborhood map
What this means for you Summary
Snapshot
- This is a 4-bed/2.5-bath single-family listed at $225k.
Deal economics
- At list price, monthly cash flow is $3k ($33k/yr) — positive.
- The deal already cash-flows at list — no discount required.
- Meets the 1% rule at list price ($6k rent vs $225k).
- Recommended offer: $222k (1.5% below list) — sets the bar for market timing.
- Cap rate 21.3% vs local median 3.2% in Houston — top-decile yield for the area; either an underpriced asset or a hidden risk that comps aren't pricing in. Stress-test before assuming the spread holds.
Location & tenants
- Location reads 74/100 on livability (#184 in TX, #4,771 nationally) — a middle-class / working-renter tenant base. Strengths: amenities A+, cost of living A+, housing A+; Watch: crime F.
- Spring ISD (suburban): math 19% / reading 26% proficiency, ranked #730 of 826 in TX (top 88%) — low school quality limits family demand, transient renter base, plan for 1-2y turnover; 66% free/reduced lunch — lower-income household profile, screen leases tightly.
- Zoned schools: Pat Reynolds El (math 18% / reading 28%, grade F, #3,277 of 4,322 statewide, top 77%, 836 students, 86% FRL); Edwin M Wells Middle (math 8% / reading 17%, grade F, #1,616 of 1,662 statewide, top 97%, 907 students, 89% FRL); Westfield H S (math 13% / reading 17%, grade F, #1,507 of 1,632 statewide, top 93%, 2,574 students, 81% FRL) — zoned schools average 86% FRL vs 66% district-wide (19 pts higher); higher-poverty schools than district average — tighter screening recommended.
- Market conditions: 117 active listings in the ZIP; 3 comparable units currently listed for rent nearby; rentals lingering (median 44d on market — plan ~5-8 weeks vacancy on turnover, expect pricing pressure); 67% of comp listings sitting > 30 days — soft ceiling on asking rent; 29,883 units permitted in Harris County in 2024 (8,621 in 5+ unit buildings).
Forward outlook
- Local home prices are declining (-2.1%/yr); year-one equity from $2k of loan paydown is wiped out by about $5k of value loss. Plan a longer hold.
- Harris County population projected at +47% by 2050 — long-run rental-demand tailwind backs the buy-and-hold thesis.
- At projected returns (-2.1% appreciation + 3.0% rent growth), your $63k cash investment doubles in ~3 years — after that, you're playing with house money.
Negotiation context
- It's been on market 27 days — a 2% lower offer ($222k) is reasonable based on typical stale-listing flexibility.
- 2 sale attempts since 3y ago; this cycle's ask has dropped $48k (18%) from the opening price — seller is motivated, your offer sets the floor, not the list.
Risks & watch-outs
- Watch-outs: property tax is 3.1% of price; flood insurance adds $66/mo.
- Climate carrying-cost: severe flood risk; severe wind risk, 99% chance of damaging wind over 30y; extreme-heat days projected 7→23/yr by 2055 (HVAC capex compounding) — expect insurance premiums to compound above CPI over the hold.
Questions for the listing agent
- Built in 1973 — when were the roof, HVAC, electrical panel, plumbing, and water heater last replaced?
- Property tax is high relative to price — has the assessment been appealed recently, and will the sale trigger a re-assessment?
- What's the actual annual flood-insurance premium (NFIP or private), and is the property in a SFHA with mandatory coverage?
- What does the HOA fee cover, when was the last increase, and are there any pending special assessments or reserve-fund shortfalls?
- Is there a deadline driving the sale (1031 exchange, divorce, estate, relocation)? That informs how much negotiation room exists.
- Schools are D-rated, which usually means shorter tenancies and higher turnover. Who's the typical renter profile here, and what's been the actual vacancy rate?
- Crime grade is F in this area — have there been break-ins, vandalism, or insurance claims at this property in the last 3 years? What carrier currently insures it and at what premium?
- What's the average days-on-market for RENTAL listings here right now (not sales)? A rising rental-DOM trend means longer vacancies and softer asking-rent achievability than the comps imply.
- What's the recent tenant-quality profile in this submarket — average credit score on applications, eviction rate, late-payment / NSF rate, and stable-employment percentage? A property-management company in the area should have these aggregated.
- How much new for-sale + rental construction is in the pipeline within 1–3 miles? Heavy new supply typically softens prices + rents 12–24 months out; constrained supply supports both.
Investment metrics
- 1% rule
- 2.64% ✓
- Cap rate
- 21.31%
- Cash-on-cash
- 53.63%
- DSCR
- 3.39
- GRM
- 3.2
CMA / ARV
- ARV (on-the-fly)
- $320,340
- Comps found
- 12
Show comp detail 12 sales within ~0.75 mi
| Address | Dist | Beds/Ba | Sqft | Sold | Price | $/sf | Match |
|---|---|---|---|---|---|---|---|
| 4022 Streambed Trl | 0.09mi | 4/2.5 | 2,792 (-1%) | 2mo | $325,000 | $116 | 93 |
| 3614 Shanemoss Ct | 0.43mi | 4/2.5 | 2,852 (+2%) | 2mo | $299,990 | $105 | 76 |
| 15007 Walters Rd | 0.40mi | 4/2.5 | 2,730 (-3%) | 1mo | $279,900 | $103 | 76 |
| 3915 Glenheather Dr | 0.07mi | 4/2.5 | 2,450 (-13%) | 2mo | $319,900 | $131 | 74 |
| 15406 Falling Creek Dr | 0.45mi | 4/2.5 | 2,950 (+5%) | 3mo | $315,000 | $107 | 68 |
| 4215 False Cypress Ln | 0.38mi | 4/2.5 | 2,596 (-8%) | 3mo | $285,000 | $110 | 67 |
| 4418 Windmill Run Dr | 0.70mi | 4/3.0 | 2,760 (-2%) | 0mo | $332,000 | $120 | 62 |
| 15515 San Milo Dr | 0.49mi | 4/3.5 | 3,056 (+9%) | 2mo | $345,000 | $113 | 57 |
| 15302 Walters Rd | 0.56mi | 4/2.5 | 3,059 (+9%) | 4mo | $215,000 | $70 | 56 |
| 4218 Bayglen Ct | 0.73mi | 4/3.5 | 3,042 (+8%) | 2mo | $384,786 | $126 | 46 |
| 4422 Windmill Run Dr | 0.71mi | 3/2.5 (-1) | 2,432 (-14%) | 1mo | $299,900 | $123 | 39 |
| 15311 T C Jester Blvd | 0.75mi | 4/3.5 | 3,212 (+14%) | 2mo | $365,000 | $114 | 36 |
Match score weights: distance 35% · size 25% · config 20% · recency 20%. Top-matched comps best support the ARV.
Projected returns pro-forma
-2.14% appreciation · 3.0% rent growth · sell at horizon
- IRR
- 51.4%
- Equity multiple
- 3.34×
- Total profit
- $147,200
- Equity at exit
- $42,312
- IRR
- 56.0%
- Equity multiple
- 6.75×
- Total profit
- $362,279
- Equity at exit
- $34,847
Cash invested: $63,000 (down + closing). Projections, not guarantees.
Landlord ↔ Tenant lean methodology
- Overall (STATE)
- 87 Strongly Landlord-Friendly
- State Texas
- 87 Strongly Landlord-Friendly · R+5
- County
- — inherits STATE
- City
- — inherits STATE
ZIP-level market 77068
- Home prices YoY
- -1.0%
- Active inventory
- 117
- Price-to-rent
- 3.2×
Monthly cashflow live
- Estimated rent
- $5,946 medium interval (Pro) →
- Mortgage (P&I)
- −$1,180
- Tax from tax record
- −$579 /mo · $6,952/yr
- Insurance
- −$94
- Flood insurance flood zone
- −$66 /mo · $798/yr
- HOA
- −$29
- Vacancy / Maint / Mgmt
- −$1,249
- Net cashflow
- $2,749
Break-even live
UW: 25.0% down · 7.5% · 30yr · 1.5% tax · 5.0% vac · 8.0% maint · 8.0% mgmt
Financing live
Cash to close
- Down payment
- $56,250
- Closing costs
- $6,750
- Reserves months
- —
- Total cash needed
- —
Loan-product check · same deal, 3 products live
Conventional
25% down · 7.5% · 30yr
- Down + closing
- —
- Monthly P&I
- —
- Monthly cashflow
- —
- DSCR
- —
- Eligible?
- —
Personal DTI + credit; lowest rate.
DSCR
20% down · 8.5% · 30yr
- Down + closing
- —
- Monthly P&I
- —
- Monthly cashflow
- —
- DSCR
- —
- Eligible?
- —
No personal income docs; deal must DSCR.
Hard money
10% down · 12.0% · 12mo
- Down + closing
- —
- Monthly P&I
- —
- Monthly cashflow
- —
- DSCR
- —
- Eligible?
- —
Short-term bridge; refi at stabilization.
Rent comps 3 comps
| Address | Beds | Baths | Sqft | Rent | $/sqft | DOM | Units | Dist |
|---|---|---|---|---|---|---|---|---|
| 4622 Falling Sun Dr Houston, TX | 4.0 | 3.0 | 2485 | $2,500 | $1.01 | 43d | 1 | 0.80mi |
| 4807 Wellington Way Houston, TX | 3.0 | 2.5 | 2876 | $2,500 | $0.87 | 43d | 1 | 0.98mi |
| 5135 Westerham Pl Unit 1262307P Houston, TX | 5.0 | 3.5 | 3358 | $17,582 | $5.24 | 22d | 1 | 1.35mi |
HOA detail
- Monthly dues
- $29 · $348/yr
- Likely covers
- pool
Listing history 9 events
-
2026-04-22status Pending
-
2026-04-09price $225,000
-
2026-03-26$273,000 Active
-
2024-04-03status Pending
-
2024-03-27status Option Pending
-
2024-03-27historical
-
2023-12-21$289,000 Active
-
2013-06-25soldstatus
-
1988-01-02soldstatus
ⓘ Source: listings_history table (triggers on properties + properties_extension) + one-shot
backfill from property_details.listing_events for pre-trigger history.
Tax reassessment forecast TX · Resets to sale price
- Current annual tax
- $6,952 · $579/mo
- Projected year-2 tax
- $6,952 · $579/mo
- Expected delta
- $0/yr ($0/mo · 0.0%)
ⓘ Screening estimate from a state-policy table — verify with the county assessor before closing.
Climate risk First Street
- Flood 8/10 Severe FEMA zone X (unshaded) · 99% chance over 30 yrs
- Wildfire 2/10 Low
- Heat 9/10 Extreme 7 d/yr ≥111°F today · 23 d/yr by 30 yrs out
- Wind 8/10 Severe 99% chance of damaging wind over 30 yrs
- Air quality 3/10 Moderate 3 unhealthy d/yr today · 3 by 30 yrs out
Nearby sold comps map
Loading sold comps map…
Walkable amenities ~0.75 mi
Loading nearby amenities…
Taxation est. · year 1
- Rental income
- $71,355
- − Mortgage interest
- −$12,603
- − Property taxes
- −$6,952
- − Insurance
- −$1,922
- − Repairs & maintenance
- −$5,708
- − Management
- −$5,708
- − HOA
- −$348
- − Depreciation
- −$6,545
- Taxable income
- $31,567
- Est. tax owed @ 24.0%
- −$7,576
- After-tax cash flow
- $25,413/yr
For passive investors: Depreciation is non-cash, so a rental often shows a tax loss while cash-flowing — sheltering income. Rental losses are passive: they offset passive income freely, and up to $25,000/yr can offset ordinary (W-2) income if you actively participate and your MAGI is under $100k (phasing out to $0 by $150k); unused losses carry forward. On sale, claimed depreciation is recaptured at up to 25%, and gains may owe capital-gains tax (a 1031 exchange can defer both). Figures are a year-1 estimate at your 24.0% rate — not tax advice; consult a CPA.
Schools (NCES district)
- District
- Spring ISD
- NCES district ID
- 4841220
- Math proficiency
- 19% ▼ -13.00%
- Reading proficiency
- 26% ▼ -6.00%
- Median HH income
- $51,584
- Composite
- 20.12/100
- National rank
- #8643
- State rank
- #730 of 826 in TX
Livability — Houston
- Score
- 74/100
- State rank
- #184
- US rank
- #4771
Category grades
Schools grade is shown separately in the Schools card above.
Census & demographics
- City population
- 3,226,434
- Population (ZIP)
- 12,289
Population outlook (Harris County) Hauer SSP2
- Today (2025)
- 5,571,493 people
- By 2030
- 6,089,821 · +9.3%
- By 2040
- 7,142,806 · +28.2%
- By 2050
- 8,185,864 · +46.9%
- By 2075
- 10,574,329 · +89.8%
- By 2100
- 12,109,958 · +117.4%
Race, ethnicity, and origin ACS 2023
- Neighborhood character
- Highly diverse neighborhood (Simpson 0.72)
- Race & ethnicity
- Hispanic / Latino 35% Black 31% White 23% Two or more races 11% Asian 6% Native American 1%
- Hispanic origin (detail)
- Mexican 27%
- Common ancestry
- Scandinavian 2% Romanian 1% Serbian 1%
- Foreign-born
- 21% · Canada, Vietnam, China
- Languages at home
- 65% English-only · Spanish 28% Vietnamese 4% Chinese 1%
Political lean MEDSL · Harris
- 2024 margin
- Lean D (+5.5) · D 52.0% · R 46.4% · Other 1.6%
- 2008→2024 swing
- +3.9pp toward D · 2008: 1.6pp · 2024: 5.5pp
- All cycles
- 2024: D+5.5 2020: D+13.3 2016: D+12.4 2012: D+0.1 2008: D+1.6
Not yet ingested
- Civics
- —
Market trends
- HPI YoY
- ▼ -2.14%
- Current HPI
- 206.5475
- Rent YoY
- —
- Metro
- —
- State GDP YoY
- ▲ 3.95%
- F500 in state
- 110
Industry mix (Fortune 500 HQ in TX)
| Industry | F500 HQs | Revenue |
|---|---|---|
| Energy | 16 | $1,198B |
|
||
| Technology | 5 | $198B |
|
||
| Engineering / Construction | 4 | $72B |
|
||
| Energy Services | 3 | $60B |
|
||
| Utilities | 3 | $41B |
|
||
| Healthcare | 2 | $330B |
|
||
Price history
-22.1% since first listed9 events — show timeline
- 2026-04-22 Pending — HARMLS
- 2026-04-09 Price Changed $225,000 HARMLS
- 2026-03-26 Listed $273,000 HARMLS
- 2024-04-03 Pending — HARMLS
- 2024-03-27 Pending — HARMLS
- 2024-03-27 Listing Removed — HARMLS
- 2023-12-21 Listed $289,000 HARMLS
- 2013-06-25 Sold (Public Records) — Public Records
- 1988-01-02 Sold (Public Records) — Public Records
Property tax history
+7.6%/yrLatest (2025): $6,952 · +7.1% YoY. Source: county tax records.
Cash-flow waterfall
monthlySold comps — $/sqft
last 12 mo · ≤1 miLoading sold comps…