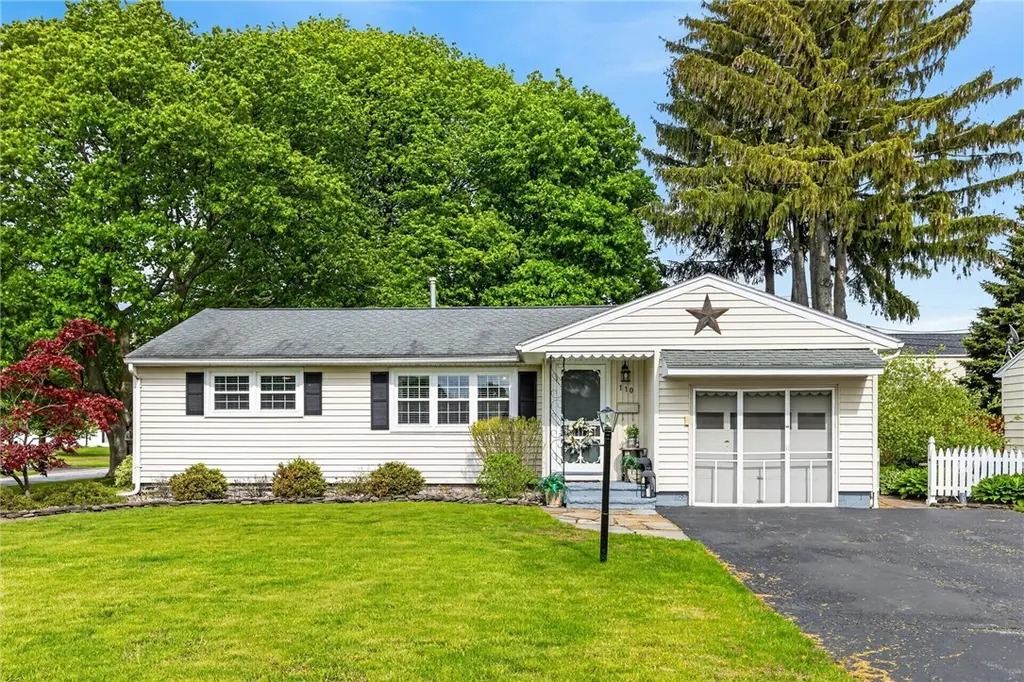
110 Verstreet Dr · Rochester, NY
Flood risk 1/10 · Minimal
- FEMA flood zone
- X (unshaded)
- Chance of flooding over 30 yrs
- 0.0%
- Est. flood insurance / yr
- $473 – $860
Fire risk 2/10 · Minimal
- Est. fire insurance / yr
- $691 – $1,283
Heat risk 3/10 · Minor
- Hot days now (above 95°F)
- 7 days/yr
- Hot days in 30 yrs
- 15 days/yr
Wind risk 1/10 · Minimal
- Chance of severe wind over 30 yrs
- —
Air-quality risk 2/10 · Minimal
- Unhealthy air days now
- 1 days/yr
- Unhealthy air days in 30 yrs
- 2 days/yr
Risk factors via First Street. Map © Google.
Why this score? — see what drove the D grade
The composite is a weighted blend of 9 inputs, each scored 0–100. Each bar is that input's sub-score; the figure is the points it added to the 100-point composite (weight × sub-score).
- ARV discount +15.0/15.0
- Cash flow +9.2/30.0
- 1% rule +4.5/10.0
- Livability +3.8/5.0
- Schools +3.2/10.0
- DSCR +2.6/10.0
- Rent growth +2.5/5.0
- Condition / age +2.5/5.0
- Appreciation +0.0/10.0
$179,777
🖨 Deal sheet (PDF) 📄 Offer letter ✓ Due diligence
Listing remarks MLS
Adorable Ranch in Mint Condition. 2/3 Bdrm, Eat-in Kitchen, Formal Dining Rm, Beautiful Kitchen w/ Appliances. Curb Appeal w/ Splendid Landscaping, White Picket Fence leads you back to a Victorian-Shed. Attached Garage, New Air & Furnace, NEW ELECTRIC SERVICE & NEW TEAR OFF ROOF. Park-Like Yard.
Key facts
- Bright kitchen
- Breakfast nook
- Wide open yard
Tags
Property features AI
Exterior
- Parking: Attached garage with 1 car space
- Utilities: Public water connected; Sewer connected; Circuit breaker electric; Cable available; High-speed internet available
- Home design: Single-story home; Resale property
- Construction: Vinyl siding exterior; Asphalt roof; Block foundation; PEX plumbing; Existing (previously built)
- Exterior features: Blacktop driveway; Covered patio/porch; Patio; Porch; Shed(s)/storage
Interior
- Kitchen: Gas oven; Gas range; Dishwasher; Microwave; Refrigerator; Eat-in kitchen layout
- Bedrooms: Two main-level bedrooms
- Flooring: Carpet; Hardwood; Tile; Varied flooring
- Bathrooms: One full bathroom; One half bathroom
- Heating & cooling: Gas forced-air heating; Central air conditioning
- Interior features: Eat-in kitchen; Separate/formal living room; Living/dining room combination; Bedroom on main level; Main level primary bedroom; Full basement with sump pump
- Laundry & utility: Washer and dryer; Laundry located in basement; Gas water heater
Neighborhood map
What this means for you Summary
Snapshot
- This is a 3-bed/1.0-bath single-family listed at $180k.
Deal economics
- At list price, monthly cash flow is $-136 ($-2k/yr) — negative.
- To cash-flow at today's rent, offer at most $156k (13.4% below list).
- To meet the 1% rule (rent ≥ 1% of price), the offer needs to be $171k (4.7% below list).
- Recommended offer: $156k (13.4% below list) — sets the bar for cash-flow.
- Cap rate 5.4% vs local median 9.3% in Rochester — below-typical yield; the buyer is paying a premium for something (appreciation thesis, condition, location) that the cap rate doesn't capture.
Location & tenants
- Location reads 76/100 on livability (#222 in NY, #3,482 nationally) — a middle-class / working-renter tenant base. Strengths: commute A+, cost of living A+, housing A+; Watch: schools D+, crime F, employment F.
- Greece Central School District (suburban): math 35% / reading 39% proficiency, ranked #544 of 590 in NY (top 92%) — families likely to look elsewhere, expect single-tenant / working-renter base with shorter leases.
- Market conditions: 112 active listings in the ZIP; 16 comparable units currently listed for rent nearby; rentals at typical pace (median 16d on market — plan ~3-4 weeks tenant-placement turnaround); 1,169 units permitted in Monroe County in 2024 (591 in 5+ unit buildings).
- This rent runs 31% of the median local income ($66k/yr) — at the standard rent-burdened threshold; future hikes will face affordability resistance.
Forward outlook
- Local home prices are declining (-3.0%/yr); year-one equity from $1k of loan paydown is wiped out by about $5k of value loss. Plan a longer hold.
- Monroe County population projected to shrink 6% by 2050 — rents likely to lag national; underwrite the cash flow, not the appreciation.
Negotiation context
- Only 6 days on market — expect competitive offers; lowballing is unlikely to land.
- 2 sale attempts since 16y ago with the ask held roughly flat each time — persistent listings suggest the price (not the market) is what's stuck; bring a comps-based counter.
- Current owner paid $109k; list at $180k implies a 65% gain — meaningful room to come down on a strong offer.
Risks & watch-outs
- Watch-outs: property tax is 3.1% of price; built in 1958 — expect roof / HVAC / electrical / plumbing capex.
Questions for the listing agent
- What do current leases actually rent for vs. the listed asking? Can we see a recent rent roll and the last 12 months of T-12 income?
- Built in 1958 — when were the roof, HVAC, electrical panel, plumbing, and water heater last replaced?
- Property tax is high relative to price — has the assessment been appealed recently, and will the sale trigger a re-assessment?
- Is there a deadline driving the sale (1031 exchange, divorce, estate, relocation)? That informs how much negotiation room exists.
- Schools are D-rated, which usually means shorter tenancies and higher turnover. Who's the typical renter profile here, and what's been the actual vacancy rate?
- Crime grade is F in this area — have there been break-ins, vandalism, or insurance claims at this property in the last 3 years? What carrier currently insures it and at what premium?
- The area grade is low — what's the realistic commute time and amenity access for the typical tenant pool here? Any planned neighborhood developments (good or bad) we should know about?
- What's the average days-on-market for RENTAL listings here right now (not sales)? A rising rental-DOM trend means longer vacancies and softer asking-rent achievability than the comps imply.
- What's the recent tenant-quality profile in this submarket — average credit score on applications, eviction rate, late-payment / NSF rate, and stable-employment percentage? A property-management company in the area should have these aggregated.
- How much new for-sale + rental construction is in the pipeline within 1–3 miles? Heavy new supply typically softens prices + rents 12–24 months out; constrained supply supports both.
Investment metrics
- 1% rule
- 0.95% ✗
- Cap rate
- 5.38%
- Cash-on-cash
- -3.25%
- DSCR
- 0.86
- GRM
- 8.7
CMA / ARV
- ARV (median comp)
- $248,743
- List price
- $179,777
- Delta
- -27.73%
- Verdict
- UNDERPRICED
- Comps
- 20 within 1.0 mi
Show comp detail 12 sales within ~0.75 mi
| Address | Dist | Beds/Ba | Sqft | Sold | Price | $/sf | Match |
|---|---|---|---|---|---|---|---|
| 146 Maiden Ln | 0.34mi | 3/1.0 | 1,184 (-1%) | 1mo | $194,500 | $164 | 82 |
| 142 Pomona Dr | 0.38mi | 3/1.0 | 1,224 (+2%) | 2mo | $236,000 | $193 | 76 |
| 79 Pomona Dr | 0.41mi | 4/1.5 (+1) | 1,224 (+2%) | 1mo | $235,000 | $192 | 70 |
| 62 Benwell Rd | 0.54mi | 2/1.5 (-1) | 1,200 (+0%) | 2mo | $210,000 | $175 | 66 |
| 118 Maiden Ln | 0.38mi | 2/1.0 (-1) | 1,076 (-10%) | 2mo | $227,500 | $211 | 59 |
| 50 Florida Ave | 0.65mi | 4/1.0 (+1) | 1,162 (-3%) | 3mo | $205,000 | $176 | 57 |
| 232 Almay Rd | 0.73mi | 3/1.0 | 1,122 (-6%) | 2mo | $185,000 | $165 | 54 |
| 40 Chad Cir | 0.63mi | 3/1.0 | 1,088 (-9%) | 2mo | $230,000 | $211 | 53 |
| 222 Oakwood Rd | 0.48mi | 2/1.0 (-1) | 1,332 (+11%) | 0mo | $180,000 | $135 | 53 |
| 92 Veness Ave | 0.59mi | 2/1.0 (-1) | 1,296 (+8%) | 2mo | $185,000 | $143 | 52 |
| 49 Brownstone Ln | 0.58mi | 2/3.0 (-1) | 1,148 (-4%) | 2mo | $248,000 | $216 | 52 |
| 77 Lyncrest Dr | 0.69mi | 2/1.0 (-1) | 1,065 (-11%) | 3mo | $147,500 | $138 | 42 |
Match score weights: distance 35% · size 25% · config 20% · recency 20%. Top-matched comps best support the ARV.
Projected returns pro-forma
-3.0% appreciation · 3.0% rent growth · sell at horizon
- IRR
- -21.6%
- Equity multiple
- 0.25×
- Total profit
- $-37,638
- Equity at exit
- $26,805
- IRR
- -15.0%
- Equity multiple
- 0.14×
- Total profit
- $-43,235
- Equity at exit
- $15,544
Cash invested: $50,338 (down + closing). Projections, not guarantees.
Landlord ↔ Tenant lean methodology
- Overall (STATE)
- 15 Strongly Tenant-Friendly
- State New York
- 15 Strongly Tenant-Friendly · D+10
- County
- — inherits STATE
- City
- — inherits STATE
ZIP-level market 14616
- Home prices YoY
- -18.0%
- Active inventory
- 112
- Price-to-rent
- 8.7×
Monthly cashflow live
- Estimated rent
- $1,712 high interval (Pro) →
- Mortgage (P&I)
- −$943
- Tax from tax record
- −$472 /mo · $5,659/yr
- Insurance
- −$75
- HOA
- −$0
- Vacancy / Maint / Mgmt
- −$360
- Net cashflow
- $-136
Break-even live
Sensitivity live
| Price | -10% $-35 | -5% $-85 | +0% $-136 | +5% $-187 | +10% $-238 |
|---|---|---|---|---|---|
| Rent | -10% $-272 | -5% $-204 | +0% $-136 | +5% $-69 | +10% $-1 |
| Rate | -1.0pp $-46 | -0.5pp $-91 | base $-136 | +0.5pp $-183 | +1.0pp $-230 |
UW: 25.0% down · 7.5% · 30yr · 1.5% tax · 5.0% vac · 8.0% maint · 8.0% mgmt
Financing live
Cash to close
- Down payment
- $44,944
- Closing costs
- $5,393
- Reserves months
- —
- Total cash needed
- —
Loan-product check · same deal, 3 products live
Conventional
25% down · 7.5% · 30yr
- Down + closing
- —
- Monthly P&I
- —
- Monthly cashflow
- —
- DSCR
- —
- Eligible?
- —
Personal DTI + credit; lowest rate.
DSCR
20% down · 8.5% · 30yr
- Down + closing
- —
- Monthly P&I
- —
- Monthly cashflow
- —
- DSCR
- —
- Eligible?
- —
No personal income docs; deal must DSCR.
Hard money
10% down · 12.0% · 12mo
- Down + closing
- —
- Monthly P&I
- —
- Monthly cashflow
- —
- DSCR
- —
- Eligible?
- —
Short-term bridge; refi at stabilization.
Rent comps 16 comps
| Address | Beds | Baths | Sqft | Rent | $/sqft | DOM | Units | Dist |
|---|---|---|---|---|---|---|---|---|
| 180 Whitehall Dr Greece, NY | 1.0–2.0 | 1.0 | 850 | $1,230 | $1.45 | 4d | 1 | 0.88mi |
| 2 Glenora Gdns Rochester, NY | 1.0–2.0 | 1.0 | 692 | $1,755 | $2.53 | 4d | 17 | 0.96mi |
| 262 Jamestown Ter Unit 2 Rochester, NY | 2.0 | 1.0 | 1242 | $2,200 | $1.77 | 45d | 1 | 0.99mi |
| 100 Andover St Rochester, NY | 2.0 | 1.0 | 750 | $1,795 | $2.39 | 4d | 63 | 1.02mi |
| 4 Valley Brook Cir Greece, NY | 2.0 | 1.5 | 1047 | $2,306 | $2.20 | 4d | 3 | 1.03mi |
| 331 Leonard Rd Rochester, NY | 3.0 | 2.0 | 1157 | $1,850 | $1.60 | 5d | 1 | 1.16mi |
| 304 Bakerdale Rd Rochester, NY | 3.0 | 1.0 | 1256 | $1,650 | $1.31 | 46d | 1 | 1.16mi |
| 175 English Rd Rochester, NY | 3.0 | 1.5 | 1194 | $1,975 | $1.65 | 45d | 1 | 1.19mi |
| 553 Britton Rd Unit Uppr Rochester, NY | 2.0 | 1.0 | 750 | $1,300 | $1.73 | 16d | 1 | 1.20mi |
| 60 Cheltenham Rd Unit Down Rochester, NY | 2.0 | 1.0 | 1014 | $1,300 | $1.28 | 16d | 1 | 1.25mi |
| 419 Britton Rd Rochester, NY | 2.0 | 1.5 | 1025 | $1,595 | $1.56 | 4d | 1 | 1.27mi |
| 108 Glenbrook Rd Rochester, NY | 3.0 | 1.0 | 1088 | $1,850 | $1.70 | 25d | 1 | 1.35mi |
| 360 Britton Rd Rochester, NY | 1.0–2.0 | 1.0 | 837 | $1,479 | $1.77 | 4d | 2 | 1.37mi |
| 1902 Dewey Ave Unit 1896 Rochester, NY | 2.0 | 1.0 | 900 | $1,150 | $1.28 | 25d | 1 | 1.42mi |
| 154 Woodhill Dr Unit 3 Greece, NY | 2.0 | 1.0 | 800 | $1,350 | $1.69 | 23d | 1 | 1.49mi |
| 154 Woodhill Dr Greece, NY | 1.0–2.0 | 1.0 | 740 | $1,350 | $1.82 | 4d | 2 | 1.49mi |
Listing history 5 events
-
2026-05-14$179,777 Active 608-char remark
-
2010-11-12soldstatus $109,000 308-char remark
Show marketing remark (308 chars)
Adorable Ranch in Mint Condition. 2/3 Bdrm, Eat-in Kitchen, Formal Dining Rm, Beautiful Kitchen w/ Appliances. Curb Appeal w/ Splendid Landscaping, White Picket Fence leads you back to a Victorian-Shed. Attached Garage, New Air & Furnace, NEW ELECTRIC SERVICE & NEW TEAR OFF ROOF. Park-Like Yard.
-
2010-11-10soldstatus $109,000
-
2010-08-25$106,900 308-char remark
Show marketing remark (308 chars)
Adorable Ranch in Mint Condition. 2/3 Bdrm, Eat-in Kitchen, Formal Dining Rm, Beautiful Kitchen w/ Appliances. Curb Appeal w/ Splendid Landscaping, White Picket Fence leads you back to a Victorian-Shed. Attached Garage, New Air & Furnace, NEW ELECTRIC SERVICE & NEW TEAR OFF ROOF. Park-Like Yard.
-
2007-08-21soldstatus $104,900
ⓘ Source: listings_history table (triggers on properties + properties_extension) + one-shot
backfill from property_details.listing_events for pre-trigger history.
Tax reassessment forecast NY · Partial reset (capped growth)
- Current annual tax
- $5,659 · $472/mo
- Projected year-2 tax
- $5,659 · $472/mo
- Expected delta
- $0/yr ($0/mo · 0.0%)
ⓘ Screening estimate from a state-policy table — verify with the county assessor before closing.
Climate risk First Street
- Flood 1/10 Low FEMA zone X (unshaded) · 0% chance over 30 yrs
- Wildfire 2/10 Low
- Heat 3/10 Moderate 7 d/yr ≥95°F today · 15 d/yr by 30 yrs out
- Wind 1/10 Low
- Air quality 2/10 Low 1 unhealthy d/yr today · 2 by 30 yrs out
Nearby sold comps map
Loading sold comps map…
Walkable amenities ~0.75 mi
Loading nearby amenities…
Taxation est. · year 1
- Rental income
- $20,550
- − Mortgage interest
- −$10,070
- − Property taxes
- −$5,659
- − Insurance
- −$899
- − Repairs & maintenance
- −$1,644
- − Management
- −$1,644
- − Depreciation
- −$5,230
- Taxable loss
- −$4,596
- Est. tax savings @ 24.0%
- +$1,103
- After-tax cash flow
- $-533/yr
For passive investors: Depreciation is non-cash, so a rental often shows a tax loss while cash-flowing — sheltering income. Rental losses are passive: they offset passive income freely, and up to $25,000/yr can offset ordinary (W-2) income if you actively participate and your MAGI is under $100k (phasing out to $0 by $150k); unused losses carry forward. On sale, claimed depreciation is recaptured at up to 25%, and gains may owe capital-gains tax (a 1031 exchange can defer both). Figures are a year-1 estimate at your 24.0% rate — not tax advice; consult a CPA.
Schools (NCES district)
- District
- Greece Central School District
- NCES district ID
- 3612630
- Math proficiency
- 35% ▼ -14.00%
- Reading proficiency
- 39% ▼ -3.00%
- Median HH income
- $52,718
- Composite
- 32.26/100
- National rank
- #5761
- State rank
- #544 of 590 in NY
Livability — Rochester
- Score
- 76/100
- State rank
- #222
- US rank
- #3482
Category grades
Schools grade is shown separately in the Schools card above.
Census & demographics
- County
- Monroe County · 674,131 people
- City population
- 432,803
- Metro
- Rochester, NY
- Population (ZIP)
- 26,863
- Household income
- $66,499
- Rent vs Own
- Severe rent burden
- 789.0
Population outlook (Monroe County) Hauer SSP2
- Today (2025)
- 759,460 people
- By 2030
- 757,154 · -0.3%
- By 2040
- 740,644 · -2.5%
- By 2050
- 714,443 · -5.9%
- By 2075
- 645,883 · -15.0%
- By 2100
- 547,084 · -28.0%
Race, ethnicity, and origin ACS 2023
- Neighborhood character
- Predominantly White (68%)
- Race & ethnicity
- White 68% Black 13% Hispanic / Latino 12% Two or more races 8% Asian 3%
- Hispanic origin (detail)
- Mexican 1% Puerto Rican 9%
- Common ancestry
- Romanian 6% Lithuanian 2% Iranian 2%
- Foreign-born
- 8% · Canada, Philippines, Jamaica
- Languages at home
- 88% English-only · Spanish 5% Arabic 2% Other Asian/Pacific 2%
Political lean MEDSL · Monroe
- 2024 margin
- D (+19.1) · D 59.5% · R 40.5%
- 2008→2024 swing
- +1.4pp toward D · 2008: 17.7pp · 2024: 19.1pp
- All cycles
- 2024: D+19.1 2020: D+21.0 2016: D+14.1 2012: D+17.4 2008: D+17.7
Not yet ingested
- Civics
- —
Market trends
- HPI YoY
- ▼ -54.14%
- Current HPI
- 246.1703
- Rent YoY
- —
- Metro
- Rochester, NY
- State GDP YoY
- ▲ 2.60%
- F500 in state
- 92
Industry mix (Fortune 500 HQ in NY)
| Industry | F500 HQs | Revenue |
|---|---|---|
| Financial Services | 10 | $950B |
|
||
| Consumer Goods | 9 | $162B |
|
||
| Insurance | 4 | $225B |
|
||
| Telecommunications | 2 | $144B |
|
||
| Pharmaceuticals | 2 | $112B |
|
||
| Media / Entertainment | 2 | $69B |
|
||
Price history
+71.4% since first listed6 events — show timeline
- 2026-05-20 Pending — UNYREIS
- 2026-05-14 Listed $179,777 UNYREIS
- 2010-11-12 Sold (MLS) $109,000 UNYREIS
- 2010-11-10 Sold (Public Records) $109,000 Public Records
- 2010-08-25 Listed $106,900 UNYREIS
- 2007-08-21 Sold (Public Records) $104,900 Public Records
Property tax history
+2.6%/yrLatest (2025): $5,659 · +15.1% YoY. Source: county tax records.
Cash-flow waterfall
monthlySold comps — $/sqft
last 12 mo · ≤1 miLoading sold comps…