 Triplex
253 Lexington St · Woburn, MA
Flood risk 1/10 · Minimal
- FEMA flood zone
- X (unshaded)
- Chance of flooding over 30 yrs
- 0.0%
- Est. flood insurance / yr
- $473 – $860
Fire risk 1/10 · Minimal
- Est. fire insurance / yr
- $915 – $1,699
Heat risk 5/10 · Moderate
- Hot days now (above 98°F)
- 7 days/yr
- Hot days in 30 yrs
- 15 days/yr
Wind risk 6/10 · Moderate
- Chance of severe wind over 30 yrs
- 50.0%
Air-quality risk 3/10 · Minor
- Unhealthy air days now
- 2 days/yr
- Unhealthy air days in 30 yrs
- 3 days/yr
Risk factors via First Street. Map © Google.
Why this score? — see what drove the F grade
The composite is a weighted blend of 9 inputs, each scored 0–100. Each bar is that input's sub-score; the figure is the points it added to the 100-point composite (weight × sub-score).
- Cash flow +9.2/30.0
- ARV discount +5.3/15.0
- Livability +4.0/5.0
- Schools +3.9/10.0
- DSCR +2.6/10.0
- Condition / age +2.5/5.0
- 1% rule +1.9/10.0
- Rent growth +1.6/5.0
- Appreciation +0.0/10.0
$1,099,000
🖨 Deal sheet (PDF) 📄 Offer letter ✓ Due diligence
Multi-family units
County records classify this as Multi-Family (2-4 Unit). Listing-text estimate: 3 units. confirmed
Listing remarks MLS
This property is eligible under Seller's First Look initiative through 2/17/16!...2 Family with much potential! Separate heat, hot water and electric. Convenient location; easy access to RT 128, close to Arlington and Burlington. Property will not qualify for conventional financing, FHA etc. Construction loan or Cash transaction!
Key facts
- Separate utilities
- 3-family property
- Spacious lot
Tags
Property features AI
Finance
- HOA & community: Not a senior community; Access to public transportation, walking/jogging trails, highway access, and public schools
Exterior
- Parking: Paved off-street parking; Open parking with 4 spaces
- Utilities: Public water; Public sewer; 200+ amp electric service
- Home design: 3-family property; Two-story building; Entry levels vary by unit (single-level units)
- Construction: Brick construction; Concrete perimeter foundation; Shingle roof; Built (year per public records)
- Exterior features: Rain gutters; Public road frontage
Interior
- Kitchen: Electric range hookup
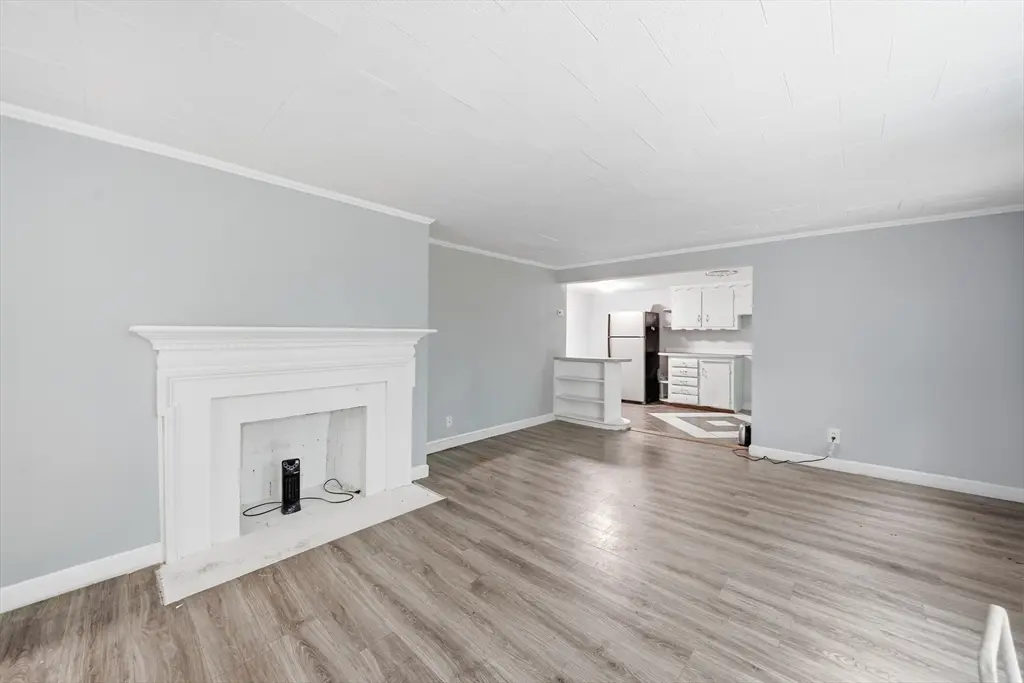
- Flooring: Wood flooring; Tile flooring
- Bathrooms: Three full bathrooms
- Interior features: Total of 12 rooms; Kitchen
- Laundry & utility: Washer hookup; Electric dryer hookup
Neighborhood map
What this means for you Summary
Snapshot
- This is a 3 × 2-bed/1.0-bath units multifamily listed at $1.10M.
Deal economics
- At list price, monthly cash flow is $-830 ($-10k/yr) — negative. Per door: $-277/mo.
- To cash-flow at today's rent, offer at most $952k (13.3% below list).
- To meet the 1% rule (rent ≥ 1% of price), the offer needs to be $758k (31.0% below list).
- Recommended offer: $758k (31.0% below list) — sets the bar for 1% rule.
- Cap rate 5.4% vs local median 3.1% in Woburn — top-decile yield for the area; either an underpriced asset or a hidden risk that comps aren't pricing in. Stress-test before assuming the spread holds.
Location & tenants
- Location reads 79/100 on livability (#42 in MA, #1,982 nationally) — a middle-class / working-renter tenant base. Strengths: commute A+, employment A+, health & safety A+; Watch: amenities D+, cost of living F.
- Woburn (suburban): math 35% / reading 49% proficiency, ranked #177 of 302 in MA (top 59%) — families likely to look elsewhere, expect single-tenant / working-renter base with shorter leases.
- Zoned schools: Woburn High (math 48% / reading 67%, grade C, #145 of 343 statewide, top 42%, 1,178 students, 0% FRL) — zoned schools average 0% FRL vs 22% district-wide (22 pts lower); this property's tenant base skews higher-income than the district average.
- Zoned-school proficiency averages 58% at this address vs 42% district-wide (+16 pts) — the actual schools serving this property are materially stronger than the Woburn average implies; a family-tenant draw the district grade alone would hide.
- Market conditions: Rents falling (-3.6%/yr); 49 active listings in the ZIP; high-income renter base; 3,670 units permitted in Middlesex County in 2024 (2,611 in 5+ unit buildings).
- At $7,580/mo this rent would consume 82% of the median local household income ($111k/yr) (locally 1723% of renters already pay >50% of income on rent) — very limited rent-growth headroom before tenants either downsize or default.
Forward outlook
- Local home prices are declining (-3.0%/yr); year-one equity from $8k of loan paydown is wiped out by about $33k of value loss. Plan a longer hold.
- Middlesex County population projected at +20% by 2050 — long-run rental-demand tailwind backs the buy-and-hold thesis.
Negotiation context
- Only 14 days on market — expect competitive offers; lowballing is unlikely to land.
- 3 sale attempts since 22y ago with the ask held roughly flat each time — persistent listings suggest the price (not the market) is what's stuck; bring a comps-based counter.
- Current owner paid $360k; list at $1.10M implies a 205% gain — meaningful room to come down on a strong offer.
Risks & watch-outs
- Climate carrying-cost: major wind risk, 50% chance of damaging wind over 30y; extreme-heat days projected 7→15/yr by 2055 (HVAC capex compounding) — expect insurance premiums to compound above CPI over the hold.
Questions for the listing agent
- What do current leases actually rent for vs. the listed asking? Can we see a recent rent roll and the last 12 months of T-12 income?
- Can we see the unit-by-unit rent roll, current vacancy, and any below-market leases? What's the average tenancy length?
- What capital expenditures (roof, boiler, parking lot, exteriors) have been made in the last 5 years, and what's planned in the next 2?
- Built in 1960 — when were the roof, HVAC, electrical panel, plumbing, and water heater last replaced?
- Is there a deadline driving the sale (1031 exchange, divorce, estate, relocation)? That informs how much negotiation room exists.
- Schools are B-rated — typically a magnet for longer-tenancy family renters. What's the average tenant stay here, and is there a school-zone premium baked into asking?
- The area grade is low — what's the realistic commute time and amenity access for the typical tenant pool here? Any planned neighborhood developments (good or bad) we should know about?
- What's the average days-on-market for RENTAL listings here right now (not sales)? A rising rental-DOM trend means longer vacancies and softer asking-rent achievability than the comps imply.
- What's the recent tenant-quality profile in this submarket — average credit score on applications, eviction rate, late-payment / NSF rate, and stable-employment percentage? A property-management company in the area should have these aggregated.
- How much new apartment / multifamily construction is in the pipeline within 1–3 miles? Heavy new supply (>2% of stock underway) typically softens rents 12–24 months out; light construction supports rent growth.
Investment metrics
- 1% rule
- 0.69% ✗
- Cap rate
- 5.39%
- Cash-on-cash
- -3.24%
- DSCR
- 0.86
- GRM
- 12.1
CMA / ARV
- ARV (median comp)
- $1,047,939
- List price
- $1,099,000
- Delta
- 4.87%
- Verdict
- FAIR
- Comps
- 10 within 2.0 mi
Projected returns pro-forma
-3.0% appreciation · 0.0% rent growth · sell at horizon
- IRR
- -24.8%
- Equity multiple
- 0.18×
- Total profit
- $-253,551
- Equity at exit
- $163,864
- IRR
- -31.0%
- Equity multiple
- -0.22×
- Total profit
- $-376,213
- Equity at exit
- $95,021
Cash invested: $307,720 (down + closing). Projections, not guarantees.
Landlord ↔ Tenant lean methodology
- Overall (STATE)
- 20 Strongly Tenant-Friendly
- State Massachusetts
- 20 Strongly Tenant-Friendly · D+15
- County
- — inherits STATE
- City
- — inherits STATE
ZIP-level market 01801
- Rents YoY
- -3.6%
- Active inventory
- 49
- Price-to-rent
- 36.2×
Monthly cashflow live
- Estimated rent
- $7,580 high interval (Pro) →
- Mortgage (P&I)
- −$5,763
- Tax from tax record
- −$597 /mo · $7,169/yr
- Insurance
- −$458
- HOA
- −$0
- Vacancy / Maint / Mgmt
- −$1,592
- Net cashflow
- $-830
Break-even live
Sensitivity live
| Price | -10% $-208 | -5% $-519 | +0% $-830 | +5% $-1,141 | +10% $-1,453 |
|---|---|---|---|---|---|
| Rent | -10% $-1,429 | -5% $-1,130 | +0% $-830 | +5% $-531 | +10% $-232 |
| Rate | -1.0pp $-277 | -0.5pp $-551 | base $-830 | +0.5pp $-1,115 | +1.0pp $-1,405 |
3-unit breakdown (identical units grouped — click to expand)
| Units | Beds | Baths | Est. rent |
|---|---|---|---|
| 3× units | 2 | 1 | $7,581 |
| #1 | 2 | 1 | $2,527 |
| #2 | 2 | 1 | $2,527 |
| #3 | 2 | 1 | $2,527 |
| Total (3 units) | $7,580 | ||
UW: 25.0% down · 7.5% · 30yr · 1.5% tax · 5.0% vac · 8.0% maint · 8.0% mgmt
Financing live
Cash to close
- Down payment
- $274,750
- Closing costs
- $32,970
- Reserves months
- —
- Total cash needed
- —
Loan-product check · same deal, 3 products live
Conventional
25% down · 7.5% · 30yr
- Down + closing
- —
- Monthly P&I
- —
- Monthly cashflow
- —
- DSCR
- —
- Eligible?
- —
Personal DTI + credit; lowest rate.
DSCR
20% down · 8.5% · 30yr
- Down + closing
- —
- Monthly P&I
- —
- Monthly cashflow
- —
- DSCR
- —
- Eligible?
- —
No personal income docs; deal must DSCR.
Hard money
10% down · 12.0% · 12mo
- Down + closing
- —
- Monthly P&I
- —
- Monthly cashflow
- —
- DSCR
- —
- Eligible?
- —
Short-term bridge; refi at stabilization.
Listing history 24 events
-
2026-06-18days on market $1,099,000 Active 14 DOM
-
2026-06-17days on market $1,099,000 Active 13 DOM
-
2026-06-16days on market $1,099,000 Active 12 DOM
-
2026-06-15days on market $1,099,000 Active 11 DOM
-
2026-06-13days on market $1,099,000 Active 9 DOM
-
2026-06-09days on market $1,099,000 Active 5 DOM
-
2026-06-08statusdays on market $1,099,000 Active 4 DOM
-
2026-06-07statusdays on market $1,099,000 New 3 DOM
-
2026-06-04days on market $1,099,000 Contingent 24 DOM
-
2026-06-03days on market $1,099,000 Contingent 23 DOM
-
2026-06-02days on market $1,099,000 Contingent 22 DOM
-
2026-06-01days on market $1,099,000 Contingent 21 DOM
-
2026-05-31days on market $1,099,000 Contingent 20 DOM
-
2026-05-11$1,099,000 New 631-char remark
-
2016-03-23historical 332-char remark
Show marketing remark (332 chars)
This property is eligible under Seller's First Look initiative through 2/17/16!...2 Family with much potential! Separate heat, hot water and electric. Convenient location; easy access to RT 128, close to Arlington and Burlington. Property will not qualify for conventional financing, FHA etc. Construction loan or Cash transaction!
-
2016-03-21soldstatus $360,000 Sold 332-char remark
Show marketing remark (332 chars)
This property is eligible under Seller's First Look initiative through 2/17/16!...2 Family with much potential! Separate heat, hot water and electric. Convenient location; easy access to RT 128, close to Arlington and Burlington. Property will not qualify for conventional financing, FHA etc. Construction loan or Cash transaction!
-
2016-02-06status Contingent 332-char remark
Show marketing remark (332 chars)
This property is eligible under Seller's First Look initiative through 2/17/16!...2 Family with much potential! Separate heat, hot water and electric. Convenient location; easy access to RT 128, close to Arlington and Burlington. Property will not qualify for conventional financing, FHA etc. Construction loan or Cash transaction!
-
2016-01-29price $379,900 332-char remark
Show marketing remark (332 chars)
This property is eligible under Seller's First Look initiative through 2/17/16!...2 Family with much potential! Separate heat, hot water and electric. Convenient location; easy access to RT 128, close to Arlington and Burlington. Property will not qualify for conventional financing, FHA etc. Construction loan or Cash transaction!
-
2016-01-29$379,000 New 332-char remark
Show marketing remark (332 chars)
This property is eligible under Seller's First Look initiative through 2/17/16!...2 Family with much potential! Separate heat, hot water and electric. Convenient location; easy access to RT 128, close to Arlington and Burlington. Property will not qualify for conventional financing, FHA etc. Construction loan or Cash transaction!
-
2004-12-30soldstatus $537,000
Show marketing remark (162 chars)
Great multi in Woburn near the Winchester line-Lexington line. Large brick ranch style with possible third unit. House will be delivered vacant. Motivated Seller.
-
2004-12-30soldstatus $537,000
Show marketing remark (162 chars)
Great multi in Woburn near the Winchester line-Lexington line. Large brick ranch style with possible third unit. House will be delivered vacant. Motivated Seller.
-
2004-11-26historical
Show marketing remark (162 chars)
Great multi in Woburn near the Winchester line-Lexington line. Large brick ranch style with possible third unit. House will be delivered vacant. Motivated Seller.
-
2004-11-10$539,000
Show marketing remark (162 chars)
Great multi in Woburn near the Winchester line-Lexington line. Large brick ranch style with possible third unit. House will be delivered vacant. Motivated Seller.
-
2003-11-21soldstatus $499,000
ⓘ Source: listings_history table (triggers on properties + properties_extension) + one-shot
backfill from property_details.listing_events for pre-trigger history.
Tax reassessment forecast MA · Partial reset (capped growth)
- Current annual tax
- $7,169 · $597/mo
- Projected year-2 tax
- $10,343 · $862/mo
- Expected delta
- +$3,174/yr (+$265/mo · 44.3%)
ⓘ Screening estimate from a state-policy table — verify with the county assessor before closing.
Climate risk First Street
- Flood 1/10 Low FEMA zone X (unshaded) · 0% chance over 30 yrs
- Wildfire 1/10 Low
- Heat 5/10 Major 7 d/yr ≥98°F today · 15 d/yr by 30 yrs out
- Wind 6/10 Major 50% chance of damaging wind over 30 yrs
- Air quality 3/10 Moderate 2 unhealthy d/yr today · 3 by 30 yrs out
Nearby sold comps map
Loading sold comps map…
Walkable amenities ~0.75 mi
Loading nearby amenities…
Taxation est. · year 1
- Rental income
- $90,960
- − Mortgage interest
- −$61,561
- − Property taxes
- −$7,169
- − Insurance
- −$5,495
- − Repairs & maintenance
- −$7,277
- − Management
- −$7,277
- − Depreciation
- −$31,971
- Taxable loss
- −$29,790
- Est. tax savings @ 24.0%
- +$7,150
- After-tax cash flow
- $-2,815/yr
For passive investors: Depreciation is non-cash, so a rental often shows a tax loss while cash-flowing — sheltering income. Rental losses are passive: they offset passive income freely, and up to $25,000/yr can offset ordinary (W-2) income if you actively participate and your MAGI is under $100k (phasing out to $0 by $150k); unused losses carry forward. On sale, claimed depreciation is recaptured at up to 25%, and gains may owe capital-gains tax (a 1031 exchange can defer both). Figures are a year-1 estimate at your 24.0% rate — not tax advice; consult a CPA.
Schools (NCES district)
- District
- Woburn
- NCES district ID
- 2513200
- Math proficiency
- 35% ▼ -12.00%
- Reading proficiency
- 49% ▼ -4.00%
- Median HH income
- $76,178
- Composite
- 38.6/100
- National rank
- #4161
- State rank
- #177 of 302 in MA
Livability — Woburn
- Score
- 79/100
- State rank
- #42
- US rank
- #1982
Category grades
Schools grade is shown separately in the Schools card above.
Census & demographics
- Census place
- Woburn, MA
- County
- Middlesex County · 1,437,704 people
- City population
- 41,939
- Metro
- Boston-Cambridge-Newton, MA-NH
- Population (ZIP)
- 41,939
- Household income
- $111,185
- Rent vs Own
- Severe rent burden
- 1723.0
Population outlook (Middlesex County) Hauer SSP2
- Today (2025)
- 1,740,269 people
- By 2030
- 1,817,187 · +4.4%
- By 2040
- 1,963,195 · +12.8%
- By 2050
- 2,087,461 · +20.0%
- By 2075
- 2,344,036 · +34.7%
- By 2100
- 2,383,776 · +37.0%
Race, ethnicity, and origin ACS 2023
- Neighborhood character
- Predominantly White (74%)
- Race & ethnicity
- White 74% Asian 8% Two or more races 6% Black 6% Hispanic / Latino 6%
- Hispanic origin (detail)
- Puerto Rican 1%
- Common ancestry
- Russian 3% Lithuanian 3% Estonian 2%
- Foreign-born
- 20% · Canada, China, Jamaica
- Languages at home
- 76% English-only · Other Indo-European 12% Spanish 4% French/Haitian/Cajun 2%
Political lean MEDSL · Middlesex
- 2024 margin
- Solid D (+39.5) · D 68.5% · R 29.0% · Other 2.5%
- 2008→2024 swing
- +9.3pp toward D · 2008: 30.1pp · 2024: 39.5pp
- All cycles
- 2024: D+39.5 2020: D+45.2 2016: D+38.1 2012: D+26.9 2008: D+30.1
Not yet ingested
- Civics
- —
Market trends
- HPI YoY
- ▼ -513.87%
- Current HPI
- 297.9709
- Rent YoY
- ▼ -3.65%
- Metro
- Boston-Cambridge-Newton, MA-NH
- State GDP YoY
- ▲ 2.28%
- F500 in state
- 38
Industry mix (Fortune 500 HQ in MA)
| Industry | F500 HQs | Revenue |
|---|---|---|
| Technology | 3 | $17B |
|
||
| Insurance | 2 | $84B |
|
||
| Retail | 2 | $76B |
|
||
| Life Sciences | 1 | $43B |
|
||
| Energy Technology | 1 | $31B |
|
||
| Aerospace / Defense | 1 | $18B |
|
||
Price history
+120.2% since first listed11 events — show timeline
- 2026-06-04 Listed $1,099,000 MLS PIN
- 2016-03-23 Listing Removed — MLS PIN
- 2016-03-21 Sold (MLS) $360,000 MLS PIN
- 2016-02-06 Pending — MLS PIN
- 2016-01-29 Price Changed $379,900 MLS PIN
- 2016-01-29 Listed $379,000 MLS PIN
- 2004-12-30 Sold (Public Records) $537,000 Public Records
- 2004-12-30 Sold (MLS) $537,000 MLS PIN
- 2004-11-26 Listing Removed — MLS PIN
- 2004-11-10 Listed $539,000 MLS PIN
- 2003-11-21 Sold (Public Records) $499,000 Public Records
Property tax history
+2.1%/yrLatest (2025): $7,169 · +8.2% YoY. Source: county tax records.
Cash-flow waterfall
monthlySold comps — $/sqft
last 12 mo · ≤1 miLoading sold comps…