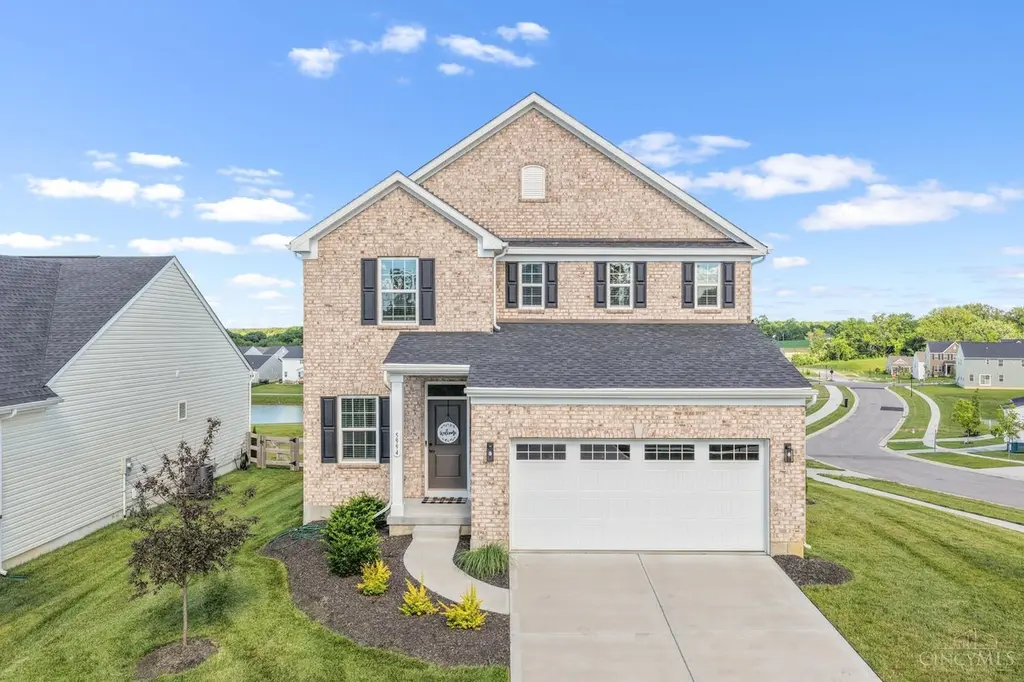
5994 Outlook Ct · Maineville, OH
Flood risk 1/10 · Minimal
- FEMA flood zone
- X (unshaded)
- Chance of flooding over 30 yrs
- 0.0%
- Est. flood insurance / yr
- $507 – $1,088
Fire risk 1/10 · Minimal
- Est. fire insurance / yr
- $713 – $1,323
Heat risk 4/10 · Minor
- Hot days now (above 101°F)
- 7 days/yr
- Hot days in 30 yrs
- 19 days/yr
Wind risk 2/10 · Minimal
- Chance of severe wind over 30 yrs
- 1.0%
Air-quality risk 4/10 · Minor
- Unhealthy air days now
- 4 days/yr
- Unhealthy air days in 30 yrs
- 6 days/yr
Risk factors via First Street. Map © Google.
Why this score? — see what drove the C+ grade
The composite is a weighted blend of 9 inputs, each scored 0–100. Each bar is that input's sub-score; the figure is the points it added to the 100-point composite (weight × sub-score).
- Cash flow +27.5/30.0
- DSCR +9.6/10.0
- 1% rule +7.6/10.0
- Schools +6.1/10.0
- Livability +3.5/5.0
- Rent growth +2.5/5.0
- Condition / age +2.5/5.0
- ARV discount +1.9/15.0
- Appreciation +0.0/10.0
$439,900
🖨 Deal sheet (PDF) 📄 Offer letter ✓ Due diligence
Listing remarks
Beautiful water views, finished lower level + resort-style amenities including pool, walking trails, playground & stocked ponds make this home stand out from the rest! Why wait to build when you can move right in? Welcome home to this beautifully maintained, 2-year-new home in the Villages of Classicway! Featuring 4 bedrooms, 2.5 bathrooms, 2,549 sqft of living space & finished lower level; this home blends modern style with everyday functionality. The open-concept floor plan showcases a neutral palette, abundant natural light & seamless living spaces ideal for entertaining. The kitchen features a large island, stainless steel appliances, pantry & dining area. Upstai
Key facts
- Stocked ponds
- Large island
- Finished lower level
Tags
Property features AI
Finance
- HOA & community: HOA with quarterly fee of $126; Association amenities include water, clubhouse, landscaping, play area, pool, and walking trails
Exterior
- Parking: Attached front garage (2 car); Driveway
- Utilities: Public water; Public sewer; Natural gas
- Home design: Traditional style single-family home; Two levels; Poured foundation
- Construction: Brick and vinyl siding exterior; Shingle roof
- Exterior features: Corner lot; Deck
Interior
- Kitchen: Pantry; Eat-in kitchen; Kitchen island; Dishwasher; Microwave; Oven/Range
- Bedrooms: 4 bedrooms total; Primary bedroom (14 x 13) on level 2; Bedroom 2 (11 x 12) on level 2; Bedroom 3 (11 x 10) on level 2; Bedroom 4 (10 x 13) on level 2
- Bathrooms: Two full bathrooms; One half bathroom on level 1; Primary bathroom with shower and additional features
- Heating & cooling: Gas heating; Central air conditioning; Gas water heating
- Interior features: Recessed lights; 6 total rooms; Finished full basement
- Laundry & utility: Garage door opener
Neighborhood map
What this means for you Summary
Snapshot
- This is a 4-bed/2.5-bath single-family listed at $440k.
Deal economics
- At list price, monthly cash flow is $1k ($16k/yr) — positive.
- The deal already cash-flows at list — no discount required.
- Meets the 1% rule at list price ($6k rent vs $440k).
- Cap rate 9.8% vs local median 3.9% in Maineville — top-decile yield for the area; either an underpriced asset or a hidden risk that comps aren't pricing in. Stress-test before assuming the spread holds.
Location & tenants
- Location reads 69/100 on livability (#529 in OH) — a middle-class / working-renter tenant base. Strengths: crime A+, employment A+, cost of living A+; Watch: amenities F, commute F, health & safety F.
- Little Miami Local (rural): math 67% / reading 70% proficiency, ranked #140 of 656 in OH (top 21%) — acceptable for families but not a draw, mixed tenant base, ~2y average lease; only 17% free/reduced lunch — higher-income household profile.
- Market conditions: 127 active listings in the ZIP; 2 comparable units currently listed for rent nearby; high-income renter base; 1,224 units permitted in Warren County in 2024 (474 in 5+ unit buildings).
- At $5,542/mo this rent would consume 55% of the median local household income ($120k/yr) — very limited rent-growth headroom before tenants either downsize or default.
Forward outlook
- Local home prices are declining (-3.0%/yr); year-one equity from $3k of loan paydown is wiped out by about $13k of value loss. Plan a longer hold.
- Warren County population projected at +16% by 2050 — long-run rental-demand tailwind backs the buy-and-hold thesis.
- At projected returns (-3.0% appreciation + 3.0% rent growth), your $123k cash investment doubles in ~9 years — after that, you're playing with house money.
Negotiation context
- Only 4 days on market — expect competitive offers; lowballing is unlikely to land.
- 2 sale attempts since 3y ago with the ask held roughly flat each time — persistent listings suggest the price (not the market) is what's stuck; bring a comps-based counter.
Questions for the listing agent
- What does the HOA fee cover, when was the last increase, and are there any pending special assessments or reserve-fund shortfalls?
- Is there a deadline driving the sale (1031 exchange, divorce, estate, relocation)? That informs how much negotiation room exists.
- Schools are A-rated — typically a magnet for longer-tenancy family renters. What's the average tenant stay here, and is there a school-zone premium baked into asking?
- What's the average days-on-market for RENTAL listings here right now (not sales)? A rising rental-DOM trend means longer vacancies and softer asking-rent achievability than the comps imply.
- What's the recent tenant-quality profile in this submarket — average credit score on applications, eviction rate, late-payment / NSF rate, and stable-employment percentage? A property-management company in the area should have these aggregated.
- How much new for-sale + rental construction is in the pipeline within 1–3 miles? Heavy new supply typically softens prices + rents 12–24 months out; constrained supply supports both.
Investment metrics
- 1% rule
- 1.26% ✓
- Cap rate
- 9.83%
- Cash-on-cash
- 12.63%
- DSCR
- 1.56
- GRM
- 6.6
CMA / ARV
- ARV (on-the-fly)
- $390,981
- Comps found
- 12
Show comp detail 12 sales within ~0.75 mi
| Address | Dist | Beds/Ba | Sqft | Sold | Price | $/sf | Match |
|---|---|---|---|---|---|---|---|
| 5976 Outlook Ct | 0.04mi | 4/2.5 | 2,423 (-2%) | 2mo | $515,000 | $213 | 94 |
| 2657 Affirmed Dr | 0.36mi | 4/2.5 | 2,559 (+4%) | 12mo | $403,000 | $157 | 67 |
| 2713 Aristides Ct | 0.32mi | 3/2.0 (-1) | 2,335 (-5%) | 6mo | $409,900 | $176 | 65 |
| 2681 Affirmed Dr | 0.38mi | 3/2.5 (-1) | 2,559 (+4%) | 7mo | $395,000 | $154 | 65 |
| 5521 Appaloosa Cir | 0.56mi | 4/2.5 | 2,352 (-4%) | 5mo | $373,000 | $159 | 62 |
| 2854 Alysheba Ct | 0.52mi | 3/3.0 (-1) | 2,560 (+4%) | 2mo | $420,000 | $164 | 60 |
| 5209 Man O War Dr | 0.62mi | 4/3.0 | 2,518 (+2%) | 8mo | $430,000 | $171 | 58 |
| 5781 Montrose Ct | 0.21mi | 5/3.5 (+1) | 2,826 (+15%) | 10mo | $395,000 | $140 | 48 |
| 2727 Unbridled Way | 0.37mi | 3/3.5 (-1) | 2,769 (+13%) | 9mo | $440,000 | $159 | 45 |
| 5181 Man O War Dr | 0.61mi | 4/2.5 | 2,803 (+14%) | 13mo | $440,000 | $157 | 38 |
| 5185 Appaloosa Cir | 0.66mi | 3/3.5 (-1) | 2,825 (+15%) | 10mo | $380,000 | $135 | 27 |
| 5663 Appaloosa Cir | 0.74mi | 3/3.5 (-1) | 2,100 (-15%) | 13mo | $389,900 | $186 | 21 |
Match score weights: distance 35% · size 25% · config 20% · recency 20%. Top-matched comps best support the ARV.
Projected returns pro-forma
-3.0% appreciation · 3.0% rent growth · sell at horizon
- IRR
- 2.4%
- Equity multiple
- 1.09×
- Total profit
- $11,382
- Equity at exit
- $65,591
- IRR
- 12.0%
- Equity multiple
- 1.95×
- Total profit
- $116,659
- Equity at exit
- $38,035
Cash invested: $123,172 (down + closing). Projections, not guarantees.
Landlord ↔ Tenant lean methodology
- Overall (STATE)
- 73 Landlord-Friendly
- State Ohio
- 73 Landlord-Friendly · R+6
- County
- — inherits STATE
- City
- — inherits STATE
ZIP-level market 45152
- Home prices YoY
- -31.1%
- Active inventory
- 127
- Price-to-rent
- 6.6×
Monthly cashflow live
- Estimated rent
- $5,542 medium interval (Pro) →
- Mortgage (P&I)
- −$2,307
- Tax est. 1.5%
- −$550 /mo · $6,598/yr
- Insurance
- −$183
- HOA
- −$42
- Vacancy / Maint / Mgmt
- −$1,164
- Net cashflow
- $1,296
Break-even live
Sensitivity live
| Price | -10% $1,600 | -5% $1,448 | +0% $1,296 | +5% $1,144 | +10% $992 |
|---|---|---|---|---|---|
| Rent | -10% $858 | -5% $1,077 | +0% $1,296 | +5% $1,515 | +10% $1,734 |
| Rate | -1.0pp $1,518 | -0.5pp $1,408 | base $1,296 | +0.5pp $1,182 | +1.0pp $1,066 |
UW: 25.0% down · 7.5% · 30yr · 1.5% tax · 5.0% vac · 8.0% maint · 8.0% mgmt
Financing live
Cash to close
- Down payment
- $109,975
- Closing costs
- $13,197
- Reserves months
- —
- Total cash needed
- —
Loan-product check · same deal, 3 products live
Conventional
25% down · 7.5% · 30yr
- Down + closing
- —
- Monthly P&I
- —
- Monthly cashflow
- —
- DSCR
- —
- Eligible?
- —
Personal DTI + credit; lowest rate.
DSCR
20% down · 8.5% · 30yr
- Down + closing
- —
- Monthly P&I
- —
- Monthly cashflow
- —
- DSCR
- —
- Eligible?
- —
No personal income docs; deal must DSCR.
Hard money
10% down · 12.0% · 12mo
- Down + closing
- —
- Monthly P&I
- —
- Monthly cashflow
- —
- DSCR
- —
- Eligible?
- —
Short-term bridge; refi at stabilization.
Rent comps 2 comps
| Address | Beds | Baths | Sqft | Rent | $/sqft | DOM | Units | Dist |
|---|---|---|---|---|---|---|---|---|
| 5738 Azra Ct Morrow, OH | 4.0 | 2.5 | 2600 | $5,995 | $2.31 | 44d | 1 | 0.29mi |
| 6976 Briarcliff Ct Maineville, OH | 4.0 | 3.0 | 2475 | $3,595 | $1.45 | 17d | 1 | 1.32mi |
HOA detail
- Monthly dues
- $42 · $504/yr
- Likely covers
- waterpool
Listing history 3 events
-
2026-06-21days on market $439,900 Active 4 DOM
-
2026-06-18remarks 683-char remark
-
2026-06-18$439,900 Active 1 DOM
ⓘ Source: listings_history table (triggers on properties + properties_extension) + one-shot
backfill from property_details.listing_events for pre-trigger history.
Climate risk First Street
- Flood 1/10 Low FEMA zone X (unshaded) · 0% chance over 30 yrs
- Wildfire 1/10 Low
- Heat 4/10 Moderate 7 d/yr ≥101°F today · 19 d/yr by 30 yrs out
- Wind 2/10 Low 100% chance of damaging wind over 30 yrs
- Air quality 4/10 Moderate 4 unhealthy d/yr today · 6 by 30 yrs out
Nearby sold comps map
Loading sold comps map…
Walkable amenities ~0.75 mi
Loading nearby amenities…
Taxation est. · year 1
- Rental income
- $66,505
- − Mortgage interest
- −$24,641
- − Property taxes
- −$6,598
- − Insurance
- −$2,200
- − Repairs & maintenance
- −$5,320
- − Management
- −$5,320
- − HOA
- −$504
- − Depreciation
- −$12,797
- Taxable income
- $9,124
- Est. tax owed @ 24.0%
- −$2,190
- After-tax cash flow
- $13,365/yr
For passive investors: Depreciation is non-cash, so a rental often shows a tax loss while cash-flowing — sheltering income. Rental losses are passive: they offset passive income freely, and up to $25,000/yr can offset ordinary (W-2) income if you actively participate and your MAGI is under $100k (phasing out to $0 by $150k); unused losses carry forward. On sale, claimed depreciation is recaptured at up to 25%, and gains may owe capital-gains tax (a 1031 exchange can defer both). Figures are a year-1 estimate at your 24.0% rate — not tax advice; consult a CPA.
Schools (NCES district)
- District
- Little Miami Local
- NCES district ID
- 3905044
- Math proficiency
- 67% ▼ -11.00%
- Reading proficiency
- 70% ▼ -6.00%
- Median HH income
- $74,949
- Composite
- 60.5/100
- National rank
- #844
- State rank
- #140 of 656 in OH
Livability — Maineville
- Score
- 69/100
- State rank
- #529
- US rank
- #9001
Category grades
Schools grade is shown separately in the Schools card above.
Census & demographics
- County
- Warren · 227,646 people
- Metro
- Cincinnati, OH-KY-IN
- Population (ZIP)
- 13,577
- Household income
- $120,340
- Rent vs Own
- Severe rent burden
- 5.6
Population outlook (Warren County) Hauer SSP2
- Today (2025)
- 248,603 people
- By 2030
- 259,345 · +4.3%
- By 2040
- 277,666 · +11.7%
- By 2050
- 289,599 · +16.5%
- By 2075
- 311,681 · +25.4%
- By 2100
- 302,738 · +21.8%
Race, ethnicity, and origin ACS 2023
- Neighborhood character
- Predominantly White (91%)
- Race & ethnicity
- White 91% Hispanic / Latino 4% Two or more races 3% Black 2% Asian 2%
- Common ancestry
- Romanian 7% Italian 3% Lithuanian 2%
- Foreign-born
- 3% · Canada, South Korea
- Languages at home
- 96% English-only · Spanish 2% Chinese 1%
Political lean MEDSL · Warren
- 2024 margin
- Solid R (+31.5) · D 33.8% · R 65.3%
- 2008→2024 swing
- +4.5pp toward D · 2008: -36.1pp · 2024: -31.5pp
- All cycles
- 2024: R+31.5 2020: R+30.8 2016: R+37.6 2012: R+39.5 2008: R+36.1
Not yet ingested
- Civics
- —
Market trends
- HPI YoY
- ▼ -108.41%
- Current HPI
- 239.7828
- Rent YoY
- —
- Metro
- —
- State GDP YoY
- ▲ 1.98%
- F500 in state
- 48
Industry mix (Fortune 500 HQ in OH)
| Industry | F500 HQs | Revenue |
|---|---|---|
| Insurance | 3 | $145B |
|
||
| Industrial Machinery | 3 | $49B |
|
||
| Financial Services | 3 | $24B |
|
||
| Consumer Goods | 2 | $93B |
|
||
| Aerospace / Defense | 2 | $47B |
|
||
| Utilities | 2 | $33B |
|
||
Price history
+25.7% since first listed4 events — show timeline
- 2026-06-18 Listed $439,900 Cincy MLS
- 2023-12-31 Listing Removed — Cincy MLS
- 2023-12-16 Price Changed $337,990 Cincy MLS
- 2023-11-15 Listed $349,990 Cincy MLS
Cash-flow waterfall
monthlySold comps — $/sqft
last 12 mo · ≤1 miLoading sold comps…