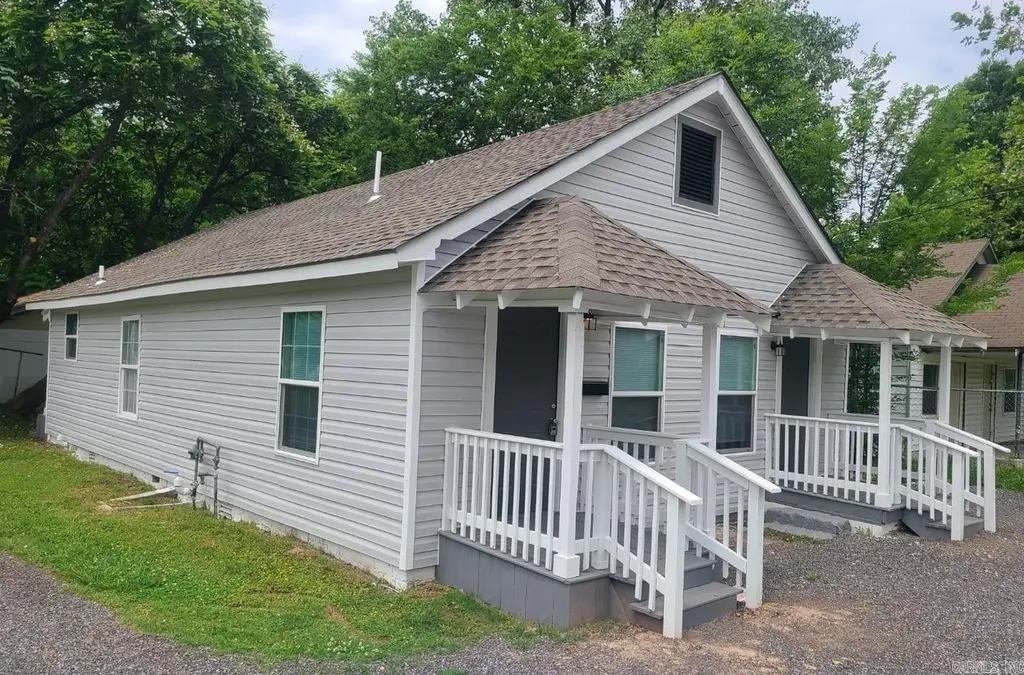
303-305 Short St · North Little Rock, AR
Flood risk 5/10 · Moderate
- FEMA flood zone
- X (unshaded)
- Chance of flooding over 30 yrs
- 0.5%
- Est. flood insurance / yr
- $507 – $1,088
Fire risk 3/10 · Minor
- Est. fire insurance / yr
- $1,499 – $2,785
Heat risk 7/10 · Major
- Hot days now (above 110°F)
- 7 days/yr
- Hot days in 30 yrs
- 19 days/yr
Wind risk 4/10 · Minor
- Chance of severe wind over 30 yrs
- 10.0%
Air-quality risk 2/10 · Minimal
- Unhealthy air days now
- 2 days/yr
- Unhealthy air days in 30 yrs
- 2 days/yr
Risk factors via First Street. Map © Google.
Why this score? — see what drove the D- grade
The composite is a weighted blend of 9 inputs, each scored 0–100. Each bar is that input's sub-score; the figure is the points it added to the 100-point composite (weight × sub-score).
- Cash flow +11.6/30.0
- ARV discount +7.5/15.0
- Livability +3.7/5.0
- DSCR +3.4/10.0
- 1% rule +2.7/10.0
- Rent growth +2.5/5.0
- Condition / age +2.5/5.0
- Schools +2.0/10.0
- Appreciation +0.0/10.0
$175,000
🖨 Deal sheet 📄 Offer letter ✓ Due diligence
Listing remarks
Investors! 3 units across 1 duplex and 1 single family home. Home rents for $830/month with a long term tenant. Duplex is currently vacant, rent for $550-600. Owner provides water. Perfect for someone to live in 1 unit and rent the rest! Properties were rehabbed 3 years ago. No seller financing.
Key facts
- Currently vacant
- Rehabbed 3 years ago
- 1 duplex
Tags
Property features AI
Finance
- Other: 3 total units: two 1-bedroom units and one 3-bedroom unit; Unit square footage and building area recorded from tax records
- Financial info: Potential financing: cash or conventional loan; Leases typically monthly; Minimum monthly rent for 1-bedroom units around $550 to $600; 3-bedroom unit rent listed at $830
Exterior
- Parking: 1-car garage
- Utilities: Municipal electric; Natural gas; Public sewer; Public water
- Home design: Multifamily property with 3 units; Zoned R; Located in North Little Rock, Pulaski County
- Construction: Composition roof; Crawl space and slab foundation
- Exterior features: Block and metal/vinyl siding exterior; Level lot; Paved road access; Lot inside city limits
Interior
- Kitchen: Free-standing stove; Electric range; Refrigerator included
- Bedrooms: Combination of 1-bedroom and 3-bedroom units (see Multi-Unit Information for counts)
- Flooring: Luxury vinyl
- Bathrooms: One bathroom per unit (3 one-bath units total)
- Heating & cooling: Central gas heat; Central electric cooling; Window air units
- Interior features: Sheet rock ceilings and walls; Other wall treatments (see remarks); Luxury vinyl flooring
- Laundry & utility: Tenant pays electric and gas
Neighborhood map
What this means for you Summary
Snapshot
- This is a 4-bed/2.0-bath other listed at $175k.
Deal economics
- At list price, monthly cash flow is $-56 ($-671/yr) — negative.
- To cash-flow at today's rent, offer at most $165k (5.6% below list).
- To meet the 1% rule (rent ≥ 1% of price), the offer needs to be $134k (23.4% below list).
- Recommended offer: $134k (23.4% below list) — sets the bar for 1% rule.
Location & tenants
- Location reads 73/100 on livability (#24 in AR) — a middle-class / working-renter tenant base. Strengths: commute A+, cost of living A+, housing A+; Watch: schools D+, crime F, amenities F.
- N. Little Rock School District (urban): math 21% / reading 26% proficiency, ranked #191 of 238 in AR (top 80%) — low school quality limits family demand, transient renter base, plan for 1-2y turnover; 66% free/reduced lunch — lower-income household profile, screen leases tightly.
- Market conditions: 78 active listings in the ZIP; 13 comparable units currently listed for rent nearby; rentals at typical pace (median 23d on market — plan ~3-4 weeks tenant-placement turnaround); 46% of comp listings sitting > 30 days — soft ceiling on asking rent; 1,006 units permitted in Pulaski County in 2024 (0 in 5+ unit buildings).
Forward outlook
- Local home prices are declining (-3.0%/yr); year-one equity from $1k of loan paydown is wiped out by about $5k of value loss. Plan a longer hold.
- Pulaski County population projected at +6% by 2050 — modest demand growth; plan on rents tracking national, not racing it.
Negotiation context
- It's been on market 29 days — a 2% lower offer ($172k) is reasonable based on typical stale-listing flexibility.
Risks & watch-outs
- Watch-outs: built in 1935 — expect roof / HVAC / electrical / plumbing capex.
- Climate carrying-cost: moderate flood risk; extreme-heat days projected 7→19/yr by 2055 (HVAC capex compounding) — expect insurance premiums to compound above CPI over the hold.
Questions for the listing agent
- What do current leases actually rent for vs. the listed asking? Can we see a recent rent roll and the last 12 months of T-12 income?
- Built in 1935 — when were the roof, HVAC, electrical panel, plumbing, and water heater last replaced?
- Is there a deadline driving the sale (1031 exchange, divorce, estate, relocation)? That informs how much negotiation room exists.
- Schools are D-rated, which usually means shorter tenancies and higher turnover. Who's the typical renter profile here, and what's been the actual vacancy rate?
- Crime grade is F in this area — have there been break-ins, vandalism, or insurance claims at this property in the last 3 years? What carrier currently insures it and at what premium?
- The area grade is low — what's the realistic commute time and amenity access for the typical tenant pool here? Any planned neighborhood developments (good or bad) we should know about?
- What's the average days-on-market for RENTAL listings here right now (not sales)? A rising rental-DOM trend means longer vacancies and softer asking-rent achievability than the comps imply.
- What's the recent tenant-quality profile in this submarket — average credit score on applications, eviction rate, late-payment / NSF rate, and stable-employment percentage? A property-management company in the area should have these aggregated.
- How much new for-sale + rental construction is in the pipeline within 1–3 miles? Heavy new supply typically softens prices + rents 12–24 months out; constrained supply supports both.
Investment metrics
- 1% rule
- 0.77% ✗
- Cap rate
- 5.91%
- Cash-on-cash
- -1.37%
- DSCR
- 0.94
- GRM
- 10.9
CMA / ARV
No comps found within radius.
Projected returns pro-forma
-3.0% appreciation · 3.0% rent growth · sell at horizon
- IRR
- -18.6%
- Equity multiple
- 0.35×
- Total profit
- $-31,958
- Equity at exit
- $26,093
- IRR
- -11.0%
- Equity multiple
- 0.34×
- Total profit
- $-32,571
- Equity at exit
- $15,131
Cash invested: $49,000 (down + closing). Projections, not guarantees.
Landlord ↔ Tenant lean methodology
- Overall (STATE)
- 92 Strongly Landlord-Friendly
- State Arkansas
- 92 Strongly Landlord-Friendly · R+14
- County
- — inherits STATE
- City
- — inherits STATE
ZIP-level market 72117
- Home prices YoY
- -30.4%
- Active inventory
- 78
- Price-to-rent
- 10.9×
Monthly cashflow live
- Estimated rent
- $1,340 high interval (Pro) →
- Mortgage (P&I)
- −$918
- Tax from tax record
- −$124 /mo · $1,484/yr
- Insurance
- −$73
- HOA
- −$0
- Vacancy / Maint / Mgmt
- −$281
- Net cashflow
- $-56
Break-even live
UW: 25.0% down · 7.5% · 30yr · 1.5% tax · 5.0% vac · 8.0% maint · 8.0% mgmt
Financing live
Cash to close
- Down payment
- $43,750
- Closing costs
- $5,250
- Reserves months
- —
- Total cash needed
- —
Loan-product check · same deal, 3 products live
Conventional
25% down · 7.5% · 30yr
- Down + closing
- —
- Monthly P&I
- —
- Monthly cashflow
- —
- DSCR
- —
- Eligible?
- —
Personal DTI + credit; lowest rate.
DSCR
20% down · 8.5% · 30yr
- Down + closing
- —
- Monthly P&I
- —
- Monthly cashflow
- —
- DSCR
- —
- Eligible?
- —
No personal income docs; deal must DSCR.
Hard money
10% down · 12.0% · 12mo
- Down + closing
- —
- Monthly P&I
- —
- Monthly cashflow
- —
- DSCR
- —
- Eligible?
- —
Short-term bridge; refi at stabilization.
Rent comps 13 comps
| Address | Beds | Baths | Sqft | Rent | $/sqft | DOM | Units | Dist |
|---|---|---|---|---|---|---|---|---|
| 4007 Rogers St North Little Rock, AR | 4.0 | 2.0 | 1157 | $1,595 | $1.38 | 43d | 1 | 0.01mi |
| 4716 School St North Little Rock, AR | 3.0 | 1.0 | 1347 | $1,150 | $0.85 | 43d | 1 | 0.55mi |
| 4820 Haywood St North Little Rock, AR | 4.0 | 2.0 | 1223 | $1,595 | $1.30 | 14d | 1 | 0.57mi |
| 4911 School St North Little Rock, AR | 4.0 | 2.0 | 1223 | $1,595 | $1.30 | 14d | 1 | 0.61mi |
| 5204 Alpha St North Little Rock, AR | 3.0 | 1.0 | 753 | $850 | $1.13 | 43d | 1 | 0.61mi |
| 4912 School St North Little Rock, AR | 3.0 | 1.0 | 1056 | $950 | $0.90 | 23d | 1 | 0.63mi |
| 814 N G St North Little Rock, AR | 3.0 | 2.0 | 1280 | $1,100 | $0.86 | 23d | 1 | 0.71mi |
| 717 Greenlea Dr North Little Rock, AR | 3.0 | 1.0 | 912 | $1,095 | $1.20 | 43d | 1 | 0.76mi |
| 817 Greenlea Dr North Little Rock, AR | 3.0 | 1.0 | 912 | $1,195 | $1.31 | 23d | 1 | 0.76mi |
| 908 Greenlea Dr North Little Rock, AR | 3.0 | 1.0 | 912 | $1,300 | $1.43 | 21d | 1 | 0.81mi |
| 2107 Muldrow Dr North Little Rock, AR | 3.0 | 1.0 | 900 | $1,015 | $1.13 | 43d | 1 | 0.87mi |
| 3 Neal Pl North Little Rock, AR | 3.0 | 1.0 | 1144 | $975 | $0.85 | 43d | 1 | 1.48mi |
| 3 Neal Pl North Little Rock, AR | 3.0 | 1.0 | 1144 | $975 | $0.85 | 23d | 1 | 1.48mi |
Listing history 19 events
-
2026-06-18days on market $175,000 Active 29 DOM
-
2026-06-17days on market $175,000 Active 28 DOM
-
2026-06-16days on market $175,000 Active 27 DOM
-
2026-06-15days on market $175,000 Active 26 DOM
-
2026-06-14days on market $175,000 Active 24 DOM
-
2026-06-13days on market $175,000 Active 23 DOM
-
2026-06-10days on market $175,000 Active 21 DOM
-
2026-06-09days on market $175,000 Active 20 DOM
-
2026-06-08days on market $175,000 Active 19 DOM
-
2026-06-07days on market $175,000 Active 18 DOM
-
2026-06-05days on market $175,000 Active 15 DOM
-
2026-06-03days on market $175,000 Active 14 DOM
-
2026-06-02days on market $175,000 Active 13 DOM
-
2026-06-01days on market $175,000 Active 12 DOM
-
2026-05-31days on market $175,000 Active 11 DOM
-
2026-05-31days on market $175,000 Active 10 DOM
-
2026-05-20$175,000 New Listing
-
2024-08-06soldstatus $175,000
-
2022-01-06soldstatus $102,000
ⓘ Source: listings_history table (triggers on properties + properties_extension) + one-shot
backfill from property_details.listing_events for pre-trigger history.
Tax reassessment forecast AR · Resets to sale price
- Current annual tax
- $1,484 · $124/mo
- Projected year-2 tax
- $1,484 · $124/mo
- Expected delta
- $0/yr ($0/mo · 0.0%)
ⓘ Screening estimate from a state-policy table — verify with the county assessor before closing.
Climate risk First Street
- Flood 5/10 Major FEMA zone X (unshaded) · 50% chance over 30 yrs
- Wildfire 3/10 Moderate
- Heat 7/10 Severe 7 d/yr ≥110°F today · 19 d/yr by 30 yrs out
- Wind 4/10 Moderate 10% chance of damaging wind over 30 yrs
- Air quality 2/10 Low 2 unhealthy d/yr today · 2 by 30 yrs out
Nearby sold comps map
Loading sold comps map…
Walkable amenities ~0.75 mi
Loading nearby amenities…
Taxation est. · year 1
- Rental income
- $16,077
- − Mortgage interest
- −$9,803
- − Property taxes
- −$1,484
- − Insurance
- −$875
- − Repairs & maintenance
- −$1,286
- − Management
- −$1,286
- − Depreciation
- −$5,091
- Taxable loss
- −$3,748
- Est. tax savings @ 24.0%
- +$900
- After-tax cash flow
- $228/yr
For passive investors: Depreciation is non-cash, so a rental often shows a tax loss while cash-flowing — sheltering income. Rental losses are passive: they offset passive income freely, and up to $25,000/yr can offset ordinary (W-2) income if you actively participate and your MAGI is under $100k (phasing out to $0 by $150k); unused losses carry forward. On sale, claimed depreciation is recaptured at up to 25%, and gains may owe capital-gains tax (a 1031 exchange can defer both). Figures are a year-1 estimate at your 24.0% rate — not tax advice; consult a CPA.
Schools (NCES district)
- District
- N. Little Rock School District
- NCES district ID
- 0510680
- Math proficiency
- 21% ▼ -11.00%
- Reading proficiency
- 26% ▼ -9.00%
- Median HH income
- $38,325
- Composite
- 19.69/100
- National rank
- #8728
- State rank
- #191 of 238 in AR
Livability — North Little Rock
- Score
- 73/100
- State rank
- #24
- US rank
- #5452
Category grades
Schools grade is shown separately in the Schools card above.
Census & demographics
- Census place
- North Little Rock, AR
- City population
- 55,470
- Population (ZIP)
- 14,339
Population outlook (Pulaski County) Hauer SSP2
- Today (2025)
- 415,378 people
- By 2030
- 423,720 · +2.0%
- By 2040
- 435,182 · +4.8%
- By 2050
- 440,904 · +6.1%
- By 2075
- 445,521 · +7.3%
- By 2100
- 419,173 · +0.9%
Race, ethnicity, and origin ACS 2023
- Neighborhood character
- Majority Black (63%)
- Race & ethnicity
- Black 63% White 24% Two or more races 7% Hispanic / Latino 5%
- Hispanic origin (detail)
- Mexican 5%
- Common ancestry
- Serbian 1% Slovak 1% Lithuanian 0%
- Foreign-born
- 3% · Canada
- Languages at home
- 95% English-only · Spanish 4%
Political lean MEDSL · Pulaski
- 2024 margin
- Strong D (+22.1) · D 59.8% · R 37.7% · Other 2.5%
- 2008→2024 swing
- +10.6pp toward D · 2008: 11.6pp · 2024: 22.1pp
- All cycles
- 2024: D+22.1 2020: D+22.5 2016: D+17.9 2012: D+11.4 2008: D+11.6
Not yet ingested
- Civics
- —
Market trends
- HPI YoY
- ▼ -53.78%
- Current HPI
- 123.3727
- Rent YoY
- —
- Metro
- —
- State GDP YoY
- ▲ 3.80%
- F500 in state
- 10
Industry mix (Fortune 500 HQ in AR)
| Industry | F500 HQs | Revenue |
|---|---|---|
| Retail | 1 | $681B |
|
||
| Food / Agriculture | 1 | $53B |
|
||
| Retail / Energy | 1 | $22B |
|
||
| Transportation / Logistics | 1 | $12B |
|
||
| Energy | 1 | $4B |
|
||
Price history
+71.6% since first listed3 events — show timeline
- 2026-05-20 Listed $175,000 CARMLS
- 2024-08-06 Sold (Public Records) $175,000 Public Records
- 2022-01-06 Sold (Public Records) $102,000 Public Records
Property tax history
+14.7%/yrLatest (2025): $1,484 · +6.0% YoY. Source: county tax records.
Cash-flow waterfall
monthlySold comps — $/sqft
last 12 mo · ≤1 miLoading sold comps…