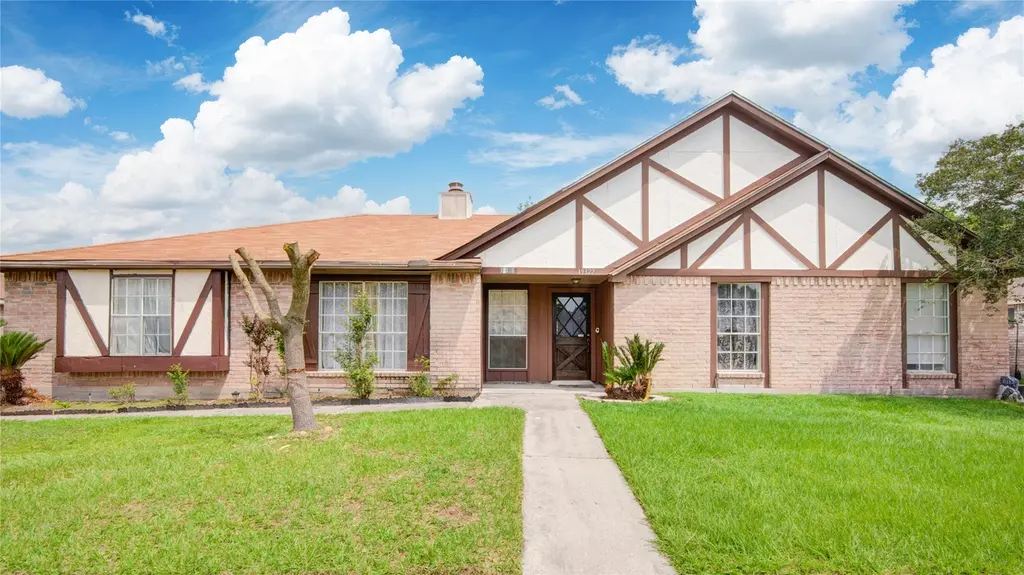
19326 Plantain Dr · Houston, TX
Flood risk 6/10 · Moderate
- FEMA flood zone
- X (unshaded)
- Chance of flooding over 30 yrs
- 0.67%
- Est. flood insurance / yr
- $507 – $1,088
Fire risk 3/10 · Minor
- Est. fire insurance / yr
- $1,222 – $2,270
Heat risk 9/10 · Severe
- Hot days now (above 110°F)
- 7 days/yr
- Hot days in 30 yrs
- 23 days/yr
Wind risk 9/10 · Severe
- Chance of severe wind over 30 yrs
- 99.0%
Air-quality risk 2/10 · Minimal
- Unhealthy air days now
- 2 days/yr
- Unhealthy air days in 30 yrs
- 2 days/yr
Risk factors via First Street. Map © Google.
Why this score? — see what drove the C grade
The composite is a weighted blend of 9 inputs, each scored 0–100. Each bar is that input's sub-score; the figure is the points it added to the 100-point composite (weight × sub-score).
- Cash flow +19.0/30.0
- ARV discount +8.0/15.0
- DSCR +6.0/10.0
- 1% rule +5.7/10.0
- Schools +5.7/10.0
- Appreciation +4.4/10.0
- Livability +3.7/5.0
- Condition / age +2.5/5.0
- Rent growth +1.8/5.0
$190,000
🖨 Deal sheet 📄 Offer letter ✓ Due diligence
Listing remarks
Great opportunity to own this 3-bedroom, 2-bath duplex located at 19326 Plantain Dr in Katy, TX. ONLY THE LEFT SIDE OF THE DUPLEX IS FOR SALE! The property features a new roof installed in 2022 and a recently replaced HVAC system. Inside, the home offers a spacious family room, separate living area, and a kitchen with a breakfast nook with updated appliances. The layout provides good bones and functional space, making it an excellent candidate for renovation or rental potential. The large backyard includes a storage shed and plenty of room for outdoor enhancements, landscaping, or entertaining. Conveniently located with easy access to I-10, this property is close to hospitals, shopping, res
Key facts
- Large backyard
- Replaced hvac system
- Storage shed
Tags
Property features AI
Finance
- Other: Lease not being considered
- HOA & community: Silvermill HOA with an annual fee of $420 covering common areas
Exterior
- Parking: No dedicated parking listed
- Utilities: Public water; Public sewer
- Home design: Residential property; Single-story; Full ownership; Slab foundation
- Construction: Built in 1981; Brick and wood siding construction
- Exterior features: Private yard; Composition roof
Interior
- Kitchen: Dishwasher; Electric oven; Electric range; Disposal; Oven
- Bedrooms: Primary bedroom (First floor) — 17 x 13; Bedroom (First floor) — 12 x 10; Bedroom (First floor) — 11 x 10
- Flooring: Carpet; Laminate; Tile
- Bathrooms: 2 full bathrooms
- Heating & cooling: Central heating (electric); Central air conditioning (electric)
- Interior features: Granite counters; One fireplace; 7 total rooms
- Laundry & utility: Utility room (First floor)
Neighborhood map
What this means for you Summary
Snapshot
- This is a 3-bed/2.0-bath townhouse listed at $190k.
Deal economics
- At list price, monthly cash flow is $197 ($2k/yr) — positive.
- The deal already cash-flows at list — no discount required.
- Meets the 1% rule at list price ($2k rent vs $190k).
- Recommended offer: $187k (1.5% below list) — sets the bar for market timing.
- Cap rate 7.5% vs local median 3.2% in Houston — top-decile yield for the area; either an underpriced asset or a hidden risk that comps aren't pricing in. Stress-test before assuming the spread holds.
Location & tenants
- Location reads 74/100 on livability (#184 in TX, #4,771 nationally) — a middle-class / working-renter tenant base. Strengths: amenities A+, cost of living A+, housing A+; Watch: crime F.
- Katy ISD (suburban): math 61% / reading 63% proficiency, ranked #29 of 826 in TX (top 4%) — acceptable for families but not a draw, mixed tenant base, ~2y average lease.
- Zoned schools: Mayde Creek H S (math 42% / reading 54%, grade D, #571 of 1,632 statewide, top 36%, 2,940 students, 78% FRL) — zoned schools average 78% FRL vs 27% district-wide (51 pts higher); higher-poverty schools than district average — tighter screening recommended.
- Zoned-school proficiency averages 48% at this address vs 62% district-wide (-14 pts) — the specific schools serving this property underperform the Katy ISD average; the district grade overstates school quality for this exact location.
- Market conditions: Rents soft (-2.9%/yr); 744 active listings in the ZIP; 40 comparable units currently listed for rent nearby; rentals leasing fast (median 10d on market — plan ~1-2 weeks tenant-placement turnaround); solid renter incomes; 29,883 units permitted in Harris County in 2024 (8,621 in 5+ unit buildings).
Forward outlook
- Local home prices are declining (-1.3%/yr); year-one equity from $1k of loan paydown is wiped out by about $2k of value loss. Plan a longer hold.
- Harris County population projected at +47% by 2050 — long-run rental-demand tailwind backs the buy-and-hold thesis.
Negotiation context
- It's been on market 16 days — a 2% lower offer ($187k) is reasonable based on typical stale-listing flexibility.
- 2 sale attempts with the ask held roughly flat each time — persistent listings suggest the price (not the market) is what's stuck; bring a comps-based counter.
Risks & watch-outs
- Climate carrying-cost: major flood risk; severe wind risk, 99% chance of damaging wind over 30y; extreme-heat days projected 7→23/yr by 2055 (HVAC capex compounding) — expect insurance premiums to compound above CPI over the hold.
Questions for the listing agent
- What does the HOA fee cover, when was the last increase, and are there any pending special assessments or reserve-fund shortfalls?
- Is there a deadline driving the sale (1031 exchange, divorce, estate, relocation)? That informs how much negotiation room exists.
- Schools are D-rated, which usually means shorter tenancies and higher turnover. Who's the typical renter profile here, and what's been the actual vacancy rate?
- Crime grade is F in this area — have there been break-ins, vandalism, or insurance claims at this property in the last 3 years? What carrier currently insures it and at what premium?
- What's the average days-on-market for RENTAL listings here right now (not sales)? A rising rental-DOM trend means longer vacancies and softer asking-rent achievability than the comps imply.
- What's the recent tenant-quality profile in this submarket — average credit score on applications, eviction rate, late-payment / NSF rate, and stable-employment percentage? A property-management company in the area should have these aggregated.
- How much new for-sale + rental construction is in the pipeline within 1–3 miles? Heavy new supply typically softens prices + rents 12–24 months out; constrained supply supports both.
Investment metrics
- 1% rule
- 1.07% ✓
- Cap rate
- 7.54%
- Cash-on-cash
- 4.45%
- DSCR
- 1.20
- GRM
- 7.8
CMA / ARV
- ARV (median comp)
- $192,004
- List price
- $190,000
- Delta
- -1.04%
- Verdict
- FAIR
- Comps
- 20 within 1.0 mi
Show comp detail 12 sales within ~0.75 mi
| Address | Dist | Beds/Ba | Sqft | Sold | Price | $/sf | Match |
|---|---|---|---|---|---|---|---|
| 19323 Hollowlog Dr | 0.02mi | 3/2.0 | 1,540 (0%) | 1mo | $199,900 | $130 | 98 |
| 19546 Lazy Valley Dr | 0.26mi | 3/2.0 | 1,554 (+1%) | 4mo | $200,000 | $129 | 84 |
| 19307 Plantain Dr | 0.05mi | 3/2.0 | 1,505 (-2%) | 16mo | $218,000 | $145 | 81 |
| 3302 Purslane Dr | 0.07mi | 3/2.0 | 1,670 (+8%) | 3mo | $209,000 | $125 | 80 |
| 3335 Deermoss Dr | 0.08mi | 3/2.0 | 1,388 (-10%) | 4mo | $189,900 | $137 | 77 |
| 19427 Plantain Dr | 0.14mi | 3/1.0 | 1,394 (-10%) | 3mo | $170,000 | $122 | 72 |
| 19514 Lazy Valley Dr | 0.19mi | 3/2.0 | 1,670 (+8%) | 9mo | $156,000 | $93 | 69 |
| 19214 Lazy Valley Dr | 0.11mi | 3/2.0 | 1,345 (-13%) | 7mo | $170,000 | $126 | 68 |
| 3351 Deermoss Dr | 0.11mi | 2/2.0 (-1) | 1,393 (-10%) | 10mo | $190,000 | $136 | 66 |
| 19411 Lazy Valley Dr | 0.10mi | 3/2.0 | 1,345 (-13%) | 10mo | $202,500 | $151 | 66 |
| 19519 Woodglen Dr | 0.18mi | 3/1.0 | 1,394 (-10%) | 8mo | $165,000 | $118 | 66 |
| 19531 Lazy Valley Dr | 0.23mi | 2/2.0 (-1) | 1,400 (-9%) | 10mo | $198,900 | $142 | 61 |
Match score weights: distance 35% · size 25% · config 20% · recency 20%. Top-matched comps best support the ARV.
Projected returns pro-forma
-1.27% appreciation · 0.0% rent growth · sell at horizon
- IRR
- -4.5%
- Equity multiple
- 0.81×
- Total profit
- $-9,921
- Equity at exit
- $43,406
- IRR
- -0.5%
- Equity multiple
- 0.96×
- Total profit
- $-2,018
- Equity at exit
- $43,517
Cash invested: $53,200 (down + closing). Projections, not guarantees.
Landlord ↔ Tenant lean methodology
- Overall (STATE)
- 87 Strongly Landlord-Friendly
- State Texas
- 87 Strongly Landlord-Friendly · R+5
- County
- — inherits STATE
- City
- — inherits STATE
ZIP-level market 77449
- Home prices YoY
- -0.5%
- Rents YoY
- -2.9%
- Active inventory
- 744
- Price-to-rent
- 7.8×
Monthly cashflow live
- Estimated rent
- $2,036 high interval (Pro) →
- Mortgage (P&I)
- −$996
- Tax from tax record
- −$300 /mo · $3,606/yr
- Insurance
- −$79
- HOA
- −$35
- Vacancy / Maint / Mgmt
- −$428
- Net cashflow
- $197
Break-even live
UW: 25.0% down · 7.5% · 30yr · 1.5% tax · 5.0% vac · 8.0% maint · 8.0% mgmt
Financing live
Cash to close
- Down payment
- $47,500
- Closing costs
- $5,700
- Reserves months
- —
- Total cash needed
- —
Loan-product check · same deal, 3 products live
Conventional
25% down · 7.5% · 30yr
- Down + closing
- —
- Monthly P&I
- —
- Monthly cashflow
- —
- DSCR
- —
- Eligible?
- —
Personal DTI + credit; lowest rate.
DSCR
20% down · 8.5% · 30yr
- Down + closing
- —
- Monthly P&I
- —
- Monthly cashflow
- —
- DSCR
- —
- Eligible?
- —
No personal income docs; deal must DSCR.
Hard money
10% down · 12.0% · 12mo
- Down + closing
- —
- Monthly P&I
- —
- Monthly cashflow
- —
- DSCR
- —
- Eligible?
- —
Short-term bridge; refi at stabilization.
Rent comps 40 comps
| Address | Beds | Baths | Sqft | Rent | $/sqft | DOM | Units | Dist |
|---|---|---|---|---|---|---|---|---|
| 19434 Brook Village Rd Houston, TX | 3.0 | 2.0 | 1822 | $1,950 | $1.07 | 43d | 1 | 0.31mi |
| 19403 Misty Cove Dr Katy, TX | 4.0 | 2.0 | 1714 | $1,999 | $1.17 | 5d | 1 | 0.41mi |
| 19407 Dawn Canyon Rd Houston, TX | 3.0 | 2.0 | 1576 | $1,716 | $1.09 | 43d | 1 | 0.47mi |
| 19138 Morton Rd Unit TOBC2 Houston, TX | 2.0 | 2.0 | 1091 | $1,745 | $1.60 | 2d | 1 | 0.57mi |
| 2606 Olster Dr Houston, TX | 3.0 | 2.0 | 1527 | $1,571 | $1.03 | 5d | 1 | 0.67mi |
| 2607 Cypressvine Dr Houston, TX | 3.0 | 2.0 | 1527 | $2,000 | $1.31 | 19d | 1 | 0.70mi |
| 2622 Broomsedge Dr Houston, TX | 3.0 | 2.0 | 1746 | $1,050 | $0.60 | 5d | 1 | 0.73mi |
| 2411 Shady Brook Dr Houston, TX | 3.0 | 2.0 | 1715 | $1,916 | $1.12 | 5d | 1 | 0.93mi |
| 20102 Twilight Canyon Rd Katy, TX | 4.0 | 2.5 | 1633 | $3,395 | $2.08 | 2d | 1 | 1.03mi |
| 19638 Southaven Dr Houston, TX | 3.0 | 2.0 | 1684 | $1,769 | $1.05 | 16d | 1 | 1.04mi |
| 18407 Early Green Trl Unit 1316402P Houston, TX | 3.0 | 2.0 | 1550 | $3,988 | $2.57 | 2d | 1 | 1.09mi |
| 3331 Dale Ridge Trl Houston, TX | 4.0 | 2.5 | 2216 | $2,121 | $0.96 | 22d | 1 | 1.10mi |
| 2603 N Fry Rd Katy, TX | 3.0 | 1.0–2.0 | 954 | $2,213 | $2.32 | 1d | 39 | 1.11mi |
| 2919 Amber Cliff Dr Katy, TX | 3.0 | 2.0 | 1526 | $1,900 | $1.25 | 43d | 1 | 1.16mi |
| 18747 Denise Dale Ln Houston, TX | 3.0 | 2.0 | 1136 | $1,695 | $1.49 | 5d | 1 | 1.17mi |
| 2931 Barker Cypress Rd Houston, TX | 1.0–3.0 | 1.0–2.0 | 1065 | $1,796 | $1.69 | 1d | 20 | 1.17mi |
| 19319 Cypress Arbor Ct Katy, TX | 4.0 | 3.0 | 1794 | $1,940 | $1.08 | 7d | 1 | 1.19mi |
| 2500 Greenhouse Rd Unit 424 Houston, TX | 2.0 | 2.0 | 1205 | $1,639 | $1.36 | 5d | 1 | 1.22mi |
| 2500 Greenhouse Rd Unit 3174 Houston, TX | 3.0 | 2.0 | 1440 | $2,083 | $1.45 | 10d | 1 | 1.22mi |
| 2500 Greenhouse Rd Unit 2148 Houston, TX | 2.0 | 2.0 | 1205 | $1,631 | $1.35 | 2d | 1 | 1.22mi |
| 2500 Greenhouse Rd Unit 2537 Houston, TX | 2.0 | 2.0 | 1205 | $1,714 | $1.42 | 43d | 1 | 1.22mi |
| 2500 Greenhouse Rd Unit 2047 Houston, TX | 2.0 | 2.0 | 1205 | $1,674 | $1.39 | 11d | 1 | 1.22mi |
| 2500 Greenhouse Rd Unit 2533 Houston, TX | 3.0 | 2.0 | 1440 | $2,094 | $1.45 | 43d | 1 | 1.22mi |
| 2500 Greenhouse Rd Unit 3112 Houston, TX | 3.0 | 2.0 | 1440 | $2,051 | $1.42 | 2d | 1 | 1.22mi |
| 2500 Greenhouse Rd Unit 2174 Houston, TX | 2.0 | 2.0 | 1205 | $1,663 | $1.38 | 10d | 1 | 1.22mi |
| 19776 Clay Rd Katy, TX | 2.0 | 2.0 | 1174 | $1,475 | $1.26 | 43d | 1 | 1.23mi |
| 19770 Clay Rd Katy, TX | 1.0–2.0 | 1.0–2.0 | 1002 | $1,843 | $1.84 | 2d | 15 | 1.24mi |
| 4211 Falcon Meadow Dr Katy, TX | 3.0 | 2.0 | 1436 | $1,795 | $1.25 | 24d | 1 | 1.25mi |
| 3130 Birchleaf Dr Katy, TX | 3.0 | 2.0 | 1700 | $1,840 | $1.08 | 43d | 1 | 1.26mi |
| 2411 Greenhouse Rd Houston, TX | 1.0–3.0 | 1.0–2.0 | 1109 | $2,008 | $1.81 | 2d | 37 | 1.27mi |
| 2937 Barker Cypress Rd Houston, TX | 2.0 | 2.0 | 1138 | $1,456 | $1.28 | 43d | 1 | 1.29mi |
| 2926 Barker Cypress Rd Unit 3047 Houston, TX | 3.0 | 2.0 | 1424 | $2,200 | $1.54 | 11d | 1 | 1.35mi |
| 2926 Barker Cypress Rd Unit 2165 Houston, TX | 2.0 | 2.0 | 1250 | $1,937 | $1.55 | 2d | 1 | 1.35mi |
| 2926 Barker Cypress Rd Unit 3165 Houston, TX | 3.0 | 2.0 | 1424 | $2,157 | $1.51 | 2d | 1 | 1.35mi |
| 19311 Cypress Bay Dr Katy, TX | 3.0 | 2.0 | 2052 | $2,080 | $1.01 | 3d | 1 | 1.35mi |
| 2926 Barker Cypress Rd Unit 3174 Houston, TX | 3.0 | 2.0 | 1424 | $2,189 | $1.54 | 10d | 1 | 1.36mi |
| 2926 Barker Cypress Rd Unit 2959 Houston, TX | 3.0 | 2.0 | 1424 | $2,110 | $1.48 | 43d | 1 | 1.36mi |
| 2926 Barker Cypress Rd Unit 2174 Houston, TX | 2.0 | 2.0 | 1250 | $1,969 | $1.58 | 10d | 1 | 1.36mi |
| 2926 Barker Cypress Rd Unit 2963 Houston, TX | 2.0 | 2.0 | 1250 | $1,820 | $1.46 | 43d | 1 | 1.36mi |
| 2926 Barker Cypress Rd Houston, TX | 2.0 | 2.0 | 1091 | $1,745 | $1.60 | 12d | 1 | 1.38mi |
HOA detail
- Monthly dues
- $35 · $420/yr
- Likely covers
- landscaping
Listing history 16 events
-
2026-06-18days on market $190,000 Active 16 DOM
-
2026-06-17days on market $190,000 Active 15 DOM
-
2026-06-16days on market $190,000 Active 14 DOM
-
2026-06-15days on market $190,000 Active 13 DOM
-
2026-06-13days on market $190,000 Active 11 DOM
-
2026-06-09days on market $190,000 Active 7 DOM
-
2026-06-08days on market $190,000 Active 6 DOM
-
2026-06-07days on market $190,000 Active 5 DOM
-
2026-06-04days on market $190,000 Active 2 DOM
-
2026-06-03days on market $190,000 Active 1 DOM
-
2026-06-02days on market $190,000 Active 30 DOM
-
2026-06-01days on market $190,000 Active 29 DOM
-
2026-05-31days on market $190,000 Active 28 DOM
-
2026-05-04$190,000 Active 876-char remark
-
2008-08-04soldstatus
-
1988-01-02soldstatus
ⓘ Source: listings_history table (triggers on properties + properties_extension) + one-shot
backfill from property_details.listing_events for pre-trigger history.
Tax reassessment forecast TX · Resets to sale price
- Current annual tax
- $3,606 · $300/mo
- Projected year-2 tax
- $3,606 · $300/mo
- Expected delta
- $0/yr ($0/mo · 0.0%)
ⓘ Screening estimate from a state-policy table — verify with the county assessor before closing.
Climate risk First Street
- Flood 6/10 Major FEMA zone X (unshaded) · 67% chance over 30 yrs
- Wildfire 3/10 Moderate
- Heat 9/10 Extreme 7 d/yr ≥110°F today · 23 d/yr by 30 yrs out
- Wind 9/10 Extreme 99% chance of damaging wind over 30 yrs
- Air quality 2/10 Low 2 unhealthy d/yr today · 2 by 30 yrs out
Nearby sold comps map
Loading sold comps map…
Walkable amenities ~0.75 mi
Loading nearby amenities…
Taxation est. · year 1
- Rental income
- $24,431
- − Mortgage interest
- −$10,643
- − Property taxes
- −$3,606
- − Insurance
- −$950
- − Repairs & maintenance
- −$1,954
- − Management
- −$1,954
- − HOA
- −$420
- − Depreciation
- −$5,527
- Taxable loss
- −$624
- Est. tax savings @ 24.0%
- +$150
- After-tax cash flow
- $2,518/yr
For passive investors: Depreciation is non-cash, so a rental often shows a tax loss while cash-flowing — sheltering income. Rental losses are passive: they offset passive income freely, and up to $25,000/yr can offset ordinary (W-2) income if you actively participate and your MAGI is under $100k (phasing out to $0 by $150k); unused losses carry forward. On sale, claimed depreciation is recaptured at up to 25%, and gains may owe capital-gains tax (a 1031 exchange can defer both). Figures are a year-1 estimate at your 24.0% rate — not tax advice; consult a CPA.
Schools (NCES district)
- District
- Katy ISD
- NCES district ID
- 4825170
- Math proficiency
- 61% ▼ -7.00%
- Reading proficiency
- 63% ▼ -3.00%
- Median HH income
- $90,312
- Composite
- 56.59/100
- National rank
- #1146
- State rank
- #29 of 826 in TX
Livability — Houston
- Score
- 74/100
- State rank
- #184
- US rank
- #4771
Category grades
Schools grade is shown separately in the Schools card above.
Census & demographics
- County
- Harris County · 4,702,590 people
- City population
- 3,226,434
- Metro
- Houston-The Woodlands-Sugar Land, TX
- Population (ZIP)
- 130,028
- Household income
- $87,808
- Rent vs Own
- Severe rent burden
- 3088.0
Population outlook (Harris County) Hauer SSP2
- Today (2025)
- 5,571,493 people
- By 2030
- 6,089,821 · +9.3%
- By 2040
- 7,142,806 · +28.2%
- By 2050
- 8,185,864 · +46.9%
- By 2075
- 10,574,329 · +89.8%
- By 2100
- 12,109,958 · +117.4%
Race, ethnicity, and origin ACS 2023
- Neighborhood character
- Diverse neighborhood (Simpson 0.68)
- Race & ethnicity
- Hispanic / Latino 49% Two or more races 22% Black 20% White 19% Asian 6%
- Hispanic origin (detail)
- Mexican 26% Puerto Rican 1% Cuban 4%
- Common ancestry
- Lithuanian 1% Italian 1%
- Foreign-born
- 32% · Canada, Jamaica, Vietnam
- Languages at home
- 48% English-only · Spanish 40% Other Indo-European 3% Vietnamese 1%
Political lean MEDSL · Harris
- 2024 margin
- Lean D (+5.5) · D 52.0% · R 46.4% · Other 1.6%
- 2008→2024 swing
- +3.9pp toward D · 2008: 1.6pp · 2024: 5.5pp
- All cycles
- 2024: D+5.5 2020: D+13.3 2016: D+12.4 2012: D+0.1 2008: D+1.6
Not yet ingested
- Civics
- —
Market trends
- HPI YoY
- ▼ -1.27%
- Current HPI
- 254.6622
- Rent YoY
- ▼ -2.86%
- Metro
- Houston-The Woodlands-Sugar Land, TX
- State GDP YoY
- ▲ 3.95%
- F500 in state
- 110
Industry mix (Fortune 500 HQ in TX)
| Industry | F500 HQs | Revenue |
|---|---|---|
| Energy | 16 | $1,198B |
|
||
| Technology | 5 | $198B |
|
||
| Engineering / Construction | 4 | $72B |
|
||
| Energy Services | 3 | $60B |
|
||
| Utilities | 3 | $41B |
|
||
| Healthcare | 2 | $330B |
|
||
Price history
+0.0% since first listed5 events — show timeline
- 2026-06-02 Listed $190,000 HARMLS
- 2026-06-02 Listing Removed — HARMLS
- 2026-05-04 Listed $190,000 HARMLS
- 2008-08-04 Sold (Public Records) — Public Records
- 1988-01-02 Sold (Public Records) — Public Records
Property tax history
+6.9%/yrLatest (2025): $3,606 · +10.4% YoY. Source: county tax records.
Cash-flow waterfall
monthlySold comps — $/sqft
last 12 mo · ≤1 miLoading sold comps…