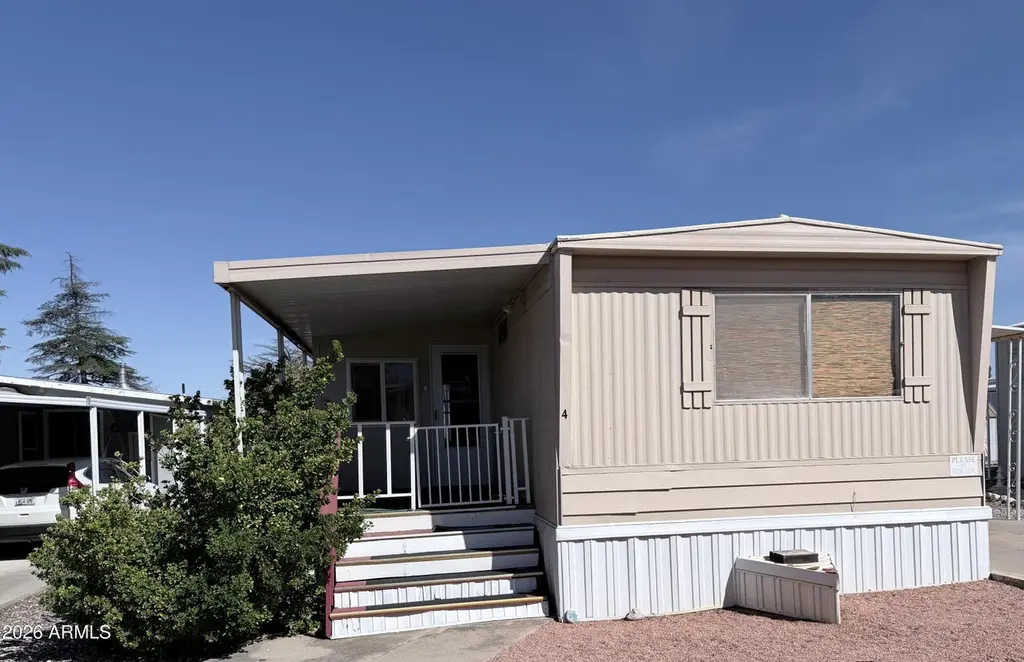
325 W State Route 89a St #4 · Cottonwood, AZ
Flood risk No data
- FEMA flood zone
- —
- Chance of flooding over 30 yrs
- —
- Est. flood insurance / yr
- —
Fire risk No data
- Est. fire insurance / yr
- —
Heat risk No data
- Hot days now (above threshold)
- —
- Hot days in 30 yrs
- —
Wind risk No data
- Chance of severe wind over 30 yrs
- —
Air-quality risk No data
- Unhealthy air days now
- —
- Unhealthy air days in 30 yrs
- —
Risk factors via First Street. Map © Google.
Why this score? — see what drove the B+ grade
The composite is a weighted blend of 9 inputs, each scored 0–100. Each bar is that input's sub-score; the figure is the points it added to the 100-point composite (weight × sub-score).
- Cash flow +30.0/30.0
- ARV discount +15.0/15.0
- 1% rule +10.0/10.0
- DSCR +10.0/10.0
- Livability +4.0/5.0
- Condition / age +3.8/5.0
- Rent growth +2.4/5.0
- Schools +1.9/10.0
- Appreciation +0.0/10.0
$44,500
🖨 Deal sheet (PDF) 📄 Offer letter ✓ Due diligence
Listing remarks
Welcome to this charming home in the desirable 55+ El Rio Del Oro Community! Offering just over 900 sq ft, this well maintained residence features 2 bdrms, 2 full bathrooms with a functional inviting layout. Enjoy newer wood flooring in all main living areas, an updated bright white kitchen with plenty of storage space! RO system & owned water softener! Primary suite is spacious, offers carpet & a remodeled bathroom. Guest bdrm offers carpet & its own private bthrm. Stackable washer/dryer located in the hallway & central heating & air for complete comfort all year long! An enclosed, lockable Az room 200 sq. ft. provides additional flexible space, perfect for
Key facts
- Wood flooring
- Owned water softener
- Ro system
Tags
Property features AI
Finance
- Other: Building area reported by owner; Lot size not available
- Financial info: Current financing: Other
- HOA & community: Land lease of $923.85 per month; No association fees listed; Community pool and community spa (heated); Biking/walking path
Exterior
- Parking: 2 covered parking spaces; 2 open parking spaces; 2 carport spaces
- Utilities: City water; Public sewer
- Home design: Manufactured/Mobile home; Leasehold ownership; Views of desert, red rocks/boulders and mountains; Asphalt road surface
- Construction: Metal siding and painted exterior; Rolled/hot mop roof
- Exterior features: Shed(s); Desert front and gravel/stone front; City-maintained road access
Interior
- Kitchen: Reverse osmosis water system; Refrigerator
- Bedrooms: Possible 2 bedrooms
- Flooring: Carpet; Wood
- Bathrooms: 2 full bathrooms
- Heating & cooling: Heat pump heating; Central air conditioning
- Interior features: Pantry; Full bath in primary bedroom; Accessible approach with ramp; Storage
Neighborhood map
What this means for you Summary
Snapshot
- This is a 2-bed/2.0-bath manufactured listed at $44k. Condition is rated good.
Deal economics
- At list price, monthly cash flow is $1k ($12k/yr) — positive.
- The deal already cash-flows at list — no discount required.
- Meets the 1% rule at list price ($2k rent vs $44k).
- Recommended offer: $42k (6.0% below list) — sets the bar for market timing.
- Cap rate 33.5% vs local median 3.8% in Cottonwood — top-decile yield for the area; either an underpriced asset or a hidden risk that comps aren't pricing in. Stress-test before assuming the spread holds.
Location & tenants
- Location reads 79/100 on livability (#7 in AZ, #2,176 nationally) — a middle-class / working-renter tenant base. Strengths: health & safety A+, commute A, cost of living A; Watch: employment D, amenities F.
- Cottonwood-Oak Creek Elementary District (4487) (town): math 17% / reading 28% proficiency, ranked #174 of 249 in AZ (top 70%) — low school quality limits family demand, transient renter base, plan for 1-2y turnover.
- Zoned schools: Dr Daniel Bright Elementary School (math 11% / reading 26%, grade F, #790 of 1,109 statewide, top 72%, 625 students, 72% FRL) — zoned schools average 72% FRL vs 52% district-wide (20 pts higher); higher-poverty schools than district average — tighter screening recommended.
- Market conditions: Rents soft (-0.2%/yr); 266 active listings in the ZIP; 5 comparable units currently listed for rent nearby; rentals at typical pace (median 14d on market — plan ~3-4 weeks tenant-placement turnaround); 2,062 units permitted in Yavapai County in 2024 (98 in 5+ unit buildings).
- This rent runs 35% of the median local income ($57k/yr) — at the standard rent-burdened threshold; future hikes will face affordability resistance.
Forward outlook
- Local home prices are declining (-3.0%/yr); year-one equity from $308 of loan paydown is wiped out by about $1k of value loss. Plan a longer hold.
- Yavapai County population projected at +10% by 2050 — modest demand growth; plan on rents tracking national, not racing it.
- At projected returns (-3.0% appreciation + 0.0% rent growth), your $12k cash investment doubles in ~2 years — after that, you're playing with house money.
Negotiation context
- It's been on market 75 days — a 6% lower offer ($42k) is reasonable based on typical stale-listing flexibility.
Questions for the listing agent
- It's been on market 75 days. Have you received any prior offers? Is the seller open to a 6% concession, seller financing, or rate buy-down credit?
- Built in 1976 — when were the roof, HVAC, electrical panel, plumbing, and water heater last replaced?
- Why hasn't it sold? Are there any deal-killer items the seller is aware of (foundation, flood, title, zoning, code violations)?
- Is there a deadline driving the sale (1031 exchange, divorce, estate, relocation)? That informs how much negotiation room exists.
- What's the average days-on-market for RENTAL listings here right now (not sales)? A rising rental-DOM trend means longer vacancies and softer asking-rent achievability than the comps imply.
- What's the recent tenant-quality profile in this submarket — average credit score on applications, eviction rate, late-payment / NSF rate, and stable-employment percentage? A property-management company in the area should have these aggregated.
- How much new for-sale + rental construction is in the pipeline within 1–3 miles? Heavy new supply typically softens prices + rents 12–24 months out; constrained supply supports both.
Investment metrics
- 1% rule
- 3.74% ✓
- Cap rate
- 33.48%
- Cash-on-cash
- 97.09%
- DSCR
- 5.32
- GRM
- 2.2
CMA / ARV
- ARV (on-the-fly)
- $75,270
- Comps found
- 6
Show comp detail 6 sales within ~0.75 mi
| Address | Dist | Beds/Ba | Sqft | Sold | Price | $/sf | Match |
|---|---|---|---|---|---|---|---|
| 228 E Cottonwood Pl #50 | 0.28mi | 2/2.0 | 960 (-0%) | 23mo | $75,000 | $78 | 67 |
| 325 W State Route 89a #28 | 0.18mi | 2/2.0 | 1,078 (+12%) | 15mo | $77,000 | $71 | 60 |
| 325 State Route 89a #14 | 0.24mi | 1/1.0 (-1) | 872 (-10%) | 13mo | $49,000 | $56 | 53 |
| 325 State Route 89a #17 | 0.24mi | 2/1.5 | 840 (-13%) | 15mo | $70,000 | $83 | 53 |
| 325 W 89a #30 | 0.23mi | 2/2.0 | 1,080 (+12%) | 21mo | $65,000 | $60 | 52 |
| 656 S 4th St | 0.39mi | 2/1.0 | 1,020 (+6%) | 22mo | $135,000 | $132 | 50 |
Match score weights: distance 35% · size 25% · config 20% · recency 20%. Top-matched comps best support the ARV.
Projected returns pro-forma
-3.0% appreciation · 0.0% rent growth · sell at horizon
- IRR
- 94.6%
- Equity multiple
- 5.18×
- Total profit
- $52,140
- Equity at exit
- $6,635
- IRR
- 96.8%
- Equity multiple
- 9.77×
- Total profit
- $109,320
- Equity at exit
- $3,848
Cash invested: $12,460 (down + closing). Projections, not guarantees.
Landlord ↔ Tenant lean methodology
- Overall (STATE)
- 87 Strongly Landlord-Friendly
- State Arizona
- 87 Strongly Landlord-Friendly · R+3
- County
- — inherits STATE
- City
- — inherits STATE
ZIP-level market 86326
- Home prices YoY
- -32.2%
- Rents YoY
- -0.2%
- Active inventory
- 266
- Price-to-rent
- 2.2×
Monthly cashflow live
- Estimated rent
- $1,665 high interval (Pro) →
- Mortgage (P&I)
- −$233
- Tax est. 1.5%
- −$56 /mo · $668/yr
- Insurance
- −$19
- HOA
- −$0
- Vacancy / Maint / Mgmt
- −$350
- Net cashflow
- $1,008
Break-even live
Sensitivity live
| Price | -10% $1,039 | -5% $1,023 | +0% $1,008 | +5% $993 | +10% $977 |
|---|---|---|---|---|---|
| Rent | -10% $877 | -5% $942 | +0% $1,008 | +5% $1,074 | +10% $1,140 |
| Rate | -1.0pp $1,031 | -0.5pp $1,019 | base $1,008 | +0.5pp $997 | +1.0pp $985 |
UW: 25.0% down · 7.5% · 30yr · 1.5% tax · 5.0% vac · 8.0% maint · 8.0% mgmt
Financing live
Cash to close
- Down payment
- $11,125
- Closing costs
- $1,335
- Reserves months
- —
- Total cash needed
- —
Loan-product check · same deal, 3 products live
Conventional
25% down · 7.5% · 30yr
- Down + closing
- —
- Monthly P&I
- —
- Monthly cashflow
- —
- DSCR
- —
- Eligible?
- —
Personal DTI + credit; lowest rate.
DSCR
20% down · 8.5% · 30yr
- Down + closing
- —
- Monthly P&I
- —
- Monthly cashflow
- —
- DSCR
- —
- Eligible?
- —
No personal income docs; deal must DSCR.
Hard money
10% down · 12.0% · 12mo
- Down + closing
- —
- Monthly P&I
- —
- Monthly cashflow
- —
- DSCR
- —
- Eligible?
- —
Short-term bridge; refi at stabilization.
Rent comps 5 comps
| Address | Beds | Baths | Sqft | Rent | $/sqft | DOM | Units | Dist |
|---|---|---|---|---|---|---|---|---|
| 133 S 8th Pl Cottonwood, AZ | 2.0 | 2.0 | 1017 | $1,700 | $1.67 | 14d | 1 | 0.66mi |
| 920 S 6th St Cottonwood, AZ | 2.0 | 1.0 | 1000 | $1,660 | $1.66 | 14d | 1 | 0.71mi |
| 905 N 2nd St Cottonwood, AZ | 2.0 | 1.0 | 752 | $1,305 | $1.74 | 21d | 1 | 1.05mi |
| 1322 Marauder Dr Cottonwood, AZ | 2.0 | 1.5 | 995 | $1,510 | $1.52 | 14d | 1 | 1.23mi |
| 935 Salida Ln Cottonwood, AZ | 2.0 | 2.0 | 1100 | $1,985 | $1.80 | 14d | 1 | 1.32mi |
Listing history 18 events
-
2026-06-18days on market $44,500 Active 75 DOM
-
2026-06-17days on market $44,500 Active 74 DOM
-
2026-06-16days on market $44,500 Active 73 DOM
-
2026-06-15days on market $44,500 Active 72 DOM
-
2026-06-14days on market $44,500 Active 70 DOM
-
2026-06-13days on market $44,500 Active 69 DOM
-
2026-06-10days on market $44,500 Active 67 DOM
-
2026-06-09days on market $44,500 Active 66 DOM
-
2026-06-08days on market $44,500 Active 65 DOM
-
2026-06-07days on market $44,500 Active 64 DOM
-
2026-06-05days on market $44,500 Active 61 DOM
-
2026-06-03pricedays on market $44,500 Active 60 DOM
-
2026-06-02days on market $50,000 Active 59 DOM
-
2026-06-01days on market $50,000 Active 58 DOM
-
2026-05-31days on market $50,000 Active 57 DOM
-
2026-05-30days on market $50,000 Active 56 DOM
-
2026-04-27price $50,000
-
2026-04-04$55,000 Active
ⓘ Source: listings_history table (triggers on properties + properties_extension) + one-shot
backfill from property_details.listing_events for pre-trigger history.
Nearby sold comps map
Loading sold comps map…
Walkable amenities ~0.75 mi
Loading nearby amenities…
Taxation est. · year 1
- Rental income
- $19,984
- − Mortgage interest
- −$2,493
- − Property taxes
- −$668
- − Insurance
- −$222
- − Repairs & maintenance
- −$1,599
- − Management
- −$1,599
- − Depreciation
- −$1,295
- Taxable income
- $12,110
- Est. tax owed @ 24.0%
- −$2,906
- After-tax cash flow
- $9,191/yr
For passive investors: Depreciation is non-cash, so a rental often shows a tax loss while cash-flowing — sheltering income. Rental losses are passive: they offset passive income freely, and up to $25,000/yr can offset ordinary (W-2) income if you actively participate and your MAGI is under $100k (phasing out to $0 by $150k); unused losses carry forward. On sale, claimed depreciation is recaptured at up to 25%, and gains may owe capital-gains tax (a 1031 exchange can defer both). Figures are a year-1 estimate at your 24.0% rate — not tax advice; consult a CPA.
Condition & rehab AI · 12 photos
This well-maintained mobile home in the El Rio Del Oro Community offers a good condition with newer updates and a functional layout. It is ready for a new owner to move in.
Value-add opportunities
- Both Paint exterior siding — Enhances curb appeal and value
- Both Replace carpet in bedrooms — Improves comfort and appearance
- Both Install new window treatments — Enhances energy efficiency and aesthetics
Renovation cost estimate screening
Value-add ROI direction
- Both Paint exterior siding — Enhances curb appeal and value ↑
- Both Replace carpet in bedrooms — Improves comfort and appearance ↑
- Both Install new window treatments — Enhances energy efficiency and aesthetics ↑
ⓘ Cost ranges are severity-bucket heuristics (US national rule-of-thumb). Get contractor quotes + a written scope before underwriting a rehab budget.
Schools (NCES district)
- District
- Cottonwood-Oak Creek Elementary District (4487)
- NCES district ID
- 0402370
- Math proficiency
- 17% ▼ -10.00%
- Reading proficiency
- 28% ▼ -7.00%
- Median HH income
- $41,740
- Composite
- 19.16/100
- National rank
- #8822
- State rank
- #174 of 249 in AZ
Livability — Cottonwood
- Score
- 79/100
- State rank
- #7
- US rank
- #2176
Category grades
Schools grade is shown separately in the Schools card above.
Census & demographics
- Census place
- Cottonwood, AZ
- County
- Yavapai County · 190,406 people
- City population
- 24,852
- Metro
- Prescott Valley-Prescott, AZ
- Population (ZIP)
- 24,852
- Household income
- $57,378
- Rent vs Own
- Severe rent burden
- 894.0
Population outlook (Yavapai County) Hauer SSP2
- Today (2025)
- 241,389 people
- By 2030
- 249,523 · +3.4%
- By 2040
- 259,966 · +7.7%
- By 2050
- 264,736 · +9.7%
- By 2075
- 269,334 · +11.6%
- By 2100
- 256,505 · +6.3%
Race, ethnicity, and origin ACS 2023
- Neighborhood character
- Predominantly White (73%)
- Race & ethnicity
- White 73% Hispanic / Latino 20% Two or more races 14% Native American 1%
- Hispanic origin (detail)
- Mexican 17%
- Common ancestry
- Italian 3% Romanian 3% Lithuanian 2%
- Foreign-born
- 12% · Canada
- Languages at home
- 84% English-only · Spanish 14% German/W. Germanic 1%
Political lean MEDSL · Yavapai
- 2024 margin
- Solid R (+33.9) · D 32.6% · R 66.5%
- 2008→2024 swing
- -9.5pp toward R · 2008: -24.4pp · 2024: -33.9pp
- All cycles
- 2024: R+33.9 2020: R+29.3 2016: R+31.4 2012: R+30.7 2008: R+24.4
Not yet ingested
- Civics
- —
Market trends
- HPI YoY
- ▼ -165.27%
- Current HPI
- 347.5058
- Rent YoY
- ▼ -0.22%
- Metro
- Prescott Valley-Prescott, AZ
- State GDP YoY
- ▲ 4.54%
- F500 in state
- 20
Industry mix (Fortune 500 HQ in AZ)
| Industry | F500 HQs | Revenue |
|---|---|---|
| Technology | 2 | $13B |
|
||
| Mining / Metals | 1 | $23B |
|
||
| Environmental Services | 1 | $16B |
|
||
| Metals / Steel | 1 | $14B |
|
||
| Technology Distribution | 1 | $9B |
|
||
| Homebuilding | 1 | $8B |
|
||
Price history
-9.1% since first listed2 events — show timeline
- 2026-04-27 Price Changed $50,000 ARMLS
- 2026-04-04 Listed $55,000 ARMLS
Cash-flow waterfall
monthlySold comps — $/sqft
last 12 mo · ≤1 miLoading sold comps…