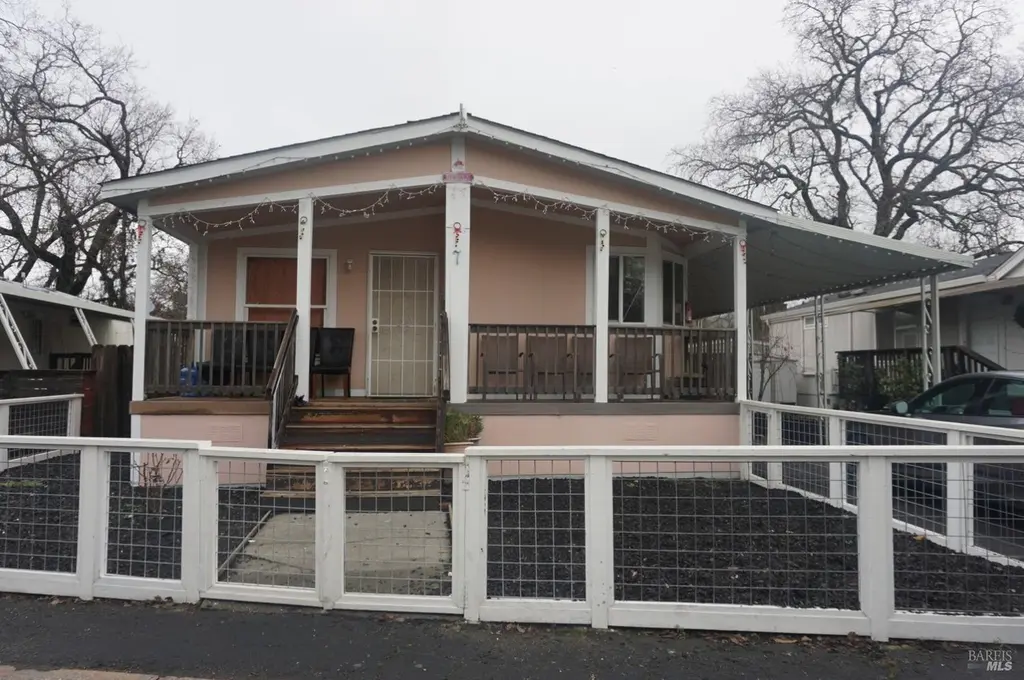
6004 Monticello Rd #7 · Moskowite Corner, CA
Flood risk 1/10 · Minimal
- FEMA flood zone
- X (unshaded)
- Chance of flooding over 30 yrs
- 0.0%
- Est. flood insurance / yr
- $507 – $1,088
Fire risk 6/10 · Moderate
- Est. fire insurance / yr
- $659 – $1,223
Heat risk 5/10 · Moderate
- Hot days now (above 99°F)
- 7 days/yr
- Hot days in 30 yrs
- 16 days/yr
Wind risk 1/10 · Minimal
- Chance of severe wind over 30 yrs
- —
Air-quality risk 10/10 · Severe
- Unhealthy air days now
- 26 days/yr
- Unhealthy air days in 30 yrs
- 27 days/yr
Risk factors via First Street. Map © Google.
Why this score? — see what drove the B- grade
The composite is a weighted blend of 9 inputs, each scored 0–100. Each bar is that input's sub-score; the figure is the points it added to the 100-point composite (weight × sub-score).
- Cash flow +30.0/30.0
- 1% rule +10.0/10.0
- DSCR +10.0/10.0
- ARV discount +7.5/15.0
- Schools +4.0/10.0
- Condition / age +2.5/5.0
- Rent growth +2.4/5.0
- Livability +1.9/5.0
- Appreciation +0.0/10.0
$135,000
🖨 Deal sheet (PDF) 📄 Offer letter ✓ Due diligence
Listing remarks MLS
Newer Mfg Home located in a Family park. Spacious Family room WITH CEILING FAN.Vaulted ceiling in Kitchen/dining. Room divder with pantry storage on kitchen side. Indoor laundry room .HOme has 3 bedroom with 2 full bathrooms The primary bedroom is large with a soaking tub and walkin a shower in bathroom. Storge shed in back with a added office room. Backyard patio for entertaining. Short distance to Napa for your shopping needs
Key facts
- Pantry storage
- Vaulted ceiling
- Soaking tub
Tags
Neighborhood map
What this means for you Summary
Snapshot
- This is a 3-bed/2.0-bath manufactured listed at $135k.
Deal economics
- At list price, monthly cash flow is $2k ($23k/yr) — positive.
- The deal already cash-flows at list — no discount required.
- Meets the 1% rule at list price ($3k rent vs $135k).
- Recommended offer: $119k (12.0% below list) — sets the bar for market timing.
- Cap rate 23.2% vs local median 3.5% in Moskowite Corner — top-decile yield for the area; either an underpriced asset or a hidden risk that comps aren't pricing in. Stress-test before assuming the spread holds.
Location & tenants
- Location reads 37/100 on livability (#1,427 in CA) — a limited-amenity area; tenant pool skews transient or value-seeking. Strengths: crime A; Watch: health & safety D, schools F, amenities F.
- Napa Valley Unified (urban): math 35% / reading 48% proficiency, ranked #599 of 1,400 in CA (top 43%) — families likely to look elsewhere, expect single-tenant / working-renter base with shorter leases.
- Market conditions: Rents soft (-0.5%/yr); 538 active listings in the ZIP; high-income renter base; 427 units permitted in Napa County in 2024 (189 in 5+ unit buildings).
- This rent runs 37% of the median local income ($113k/yr) — at the standard rent-burdened threshold; future hikes will face affordability resistance.
Forward outlook
- Local home prices are declining (-3.0%/yr); year-one equity from $933 of loan paydown is wiped out by about $4k of value loss. Plan a longer hold.
- Napa County population projected at +14% by 2050 — modest demand growth; plan on rents tracking national, not racing it.
- At projected returns (-3.0% appreciation + 0.0% rent growth), your $38k cash investment doubles in ~2 years — after that, you're playing with house money.
Negotiation context
- It's been on market 136 days — a 12% lower offer ($119k) is reasonable based on typical stale-listing flexibility.
- 8 sale attempts since 14y ago with the ask held roughly flat each time — persistent listings suggest the price (not the market) is what's stuck; bring a comps-based counter.
- Current owner paid $115k; 17% above their basis — modest negotiation headroom, anchor on the comps not their cost.
Risks & watch-outs
- Climate carrying-cost: major wildfire risk; extreme-heat days projected 7→16/yr by 2055 (HVAC capex compounding) — expect insurance premiums to compound above CPI over the hold.
Questions for the listing agent
- It's been on market 136 days. Have you received any prior offers? Is the seller open to a 12% concession, seller financing, or rate buy-down credit?
- Why hasn't it sold? Are there any deal-killer items the seller is aware of (foundation, flood, title, zoning, code violations)?
- Is there a deadline driving the sale (1031 exchange, divorce, estate, relocation)? That informs how much negotiation room exists.
- Schools are F-rated, which usually means shorter tenancies and higher turnover. Who's the typical renter profile here, and what's been the actual vacancy rate?
- What's the average days-on-market for RENTAL listings here right now (not sales)? A rising rental-DOM trend means longer vacancies and softer asking-rent achievability than the comps imply.
- What's the recent tenant-quality profile in this submarket — average credit score on applications, eviction rate, late-payment / NSF rate, and stable-employment percentage? A property-management company in the area should have these aggregated.
- How much new for-sale + rental construction is in the pipeline within 1–3 miles? Heavy new supply typically softens prices + rents 12–24 months out; constrained supply supports both.
Investment metrics
- 1% rule
- 2.56% ✓
- Cap rate
- 23.21%
- Cash-on-cash
- 60.41%
- DSCR
- 3.69
- GRM
- 3.3
CMA / ARV
- ARV (median comp)
- $82,715
- List price
- $135,000
- Delta
- 63.21%
- Verdict
- OVERPRICED
- Comps
- 2 within 1.0 mi
Show comp detail 3 sales within ~0.75 mi
| Address | Dist | Beds/Ba | Sqft | Sold | Price | $/sf | Match |
|---|---|---|---|---|---|---|---|
| 6004 Monticello Rd #8 | 0.00mi | 3/2.0 | 1,200 (-5%) | 18mo | $60,000 | $50 | 77 |
| 6004 Monticello Rd #43 | 0.35mi | 2/2.0 (-1) | 1,248 (-1%) | 10mo | $73,000 | $58 | 69 |
| 6004 Monticello Rd #46 | 0.35mi | 3/2.0 | 1,400 (+11%) | 8mo | $95,000 | $68 | 58 |
Match score weights: distance 35% · size 25% · config 20% · recency 20%. Top-matched comps best support the ARV.
Projected returns pro-forma
-3.0% appreciation · 0.0% rent growth · sell at horizon
- IRR
- 55.9%
- Equity multiple
- 3.36×
- Total profit
- $89,188
- Equity at exit
- $20,129
- IRR
- 59.8%
- Equity multiple
- 6.15×
- Total profit
- $194,569
- Equity at exit
- $11,672
Cash invested: $37,800 (down + closing). Projections, not guarantees.
Landlord ↔ Tenant lean methodology
- Overall (STATE)
- 18 Strongly Tenant-Friendly
- State California
- 18 Strongly Tenant-Friendly · D+13
- County
- — inherits STATE
- City
- — inherits STATE
ZIP-level market 94558
- Rents YoY
- -0.5%
- Active inventory
- 538
- Price-to-rent
- 3.3×
Monthly cashflow live
- Estimated rent
- $3,451 medium interval (Pro) →
- Mortgage (P&I)
- −$708
- Tax from tax record
- −$60 /mo · $714/yr
- Insurance
- −$56
- HOA
- −$0
- Vacancy / Maint / Mgmt
- −$725
- Net cashflow
- $1,903
Break-even live
Sensitivity live
| Price | -10% $1,979 | -5% $1,941 | +0% $1,903 | +5% $1,865 | +10% $1,826 |
|---|---|---|---|---|---|
| Rent | -10% $1,630 | -5% $1,767 | +0% $1,903 | +5% $2,039 | +10% $2,176 |
| Rate | -1.0pp $1,971 | -0.5pp $1,937 | base $1,903 | +0.5pp $1,868 | +1.0pp $1,832 |
UW: 25.0% down · 7.5% · 30yr · 1.5% tax · 5.0% vac · 8.0% maint · 8.0% mgmt
Financing live
Cash to close
- Down payment
- $33,750
- Closing costs
- $4,050
- Reserves months
- —
- Total cash needed
- —
Loan-product check · same deal, 3 products live
Conventional
25% down · 7.5% · 30yr
- Down + closing
- —
- Monthly P&I
- —
- Monthly cashflow
- —
- DSCR
- —
- Eligible?
- —
Personal DTI + credit; lowest rate.
DSCR
20% down · 8.5% · 30yr
- Down + closing
- —
- Monthly P&I
- —
- Monthly cashflow
- —
- DSCR
- —
- Eligible?
- —
No personal income docs; deal must DSCR.
Hard money
10% down · 12.0% · 12mo
- Down + closing
- —
- Monthly P&I
- —
- Monthly cashflow
- —
- DSCR
- —
- Eligible?
- —
Short-term bridge; refi at stabilization.
Listing history 34 events
-
2026-06-18days on market $135,000 Active 136 DOM
-
2026-06-17days on market $135,000 Active 135 DOM
-
2026-06-16days on market $135,000 Active 134 DOM
-
2026-06-15days on market $135,000 Active 133 DOM
-
2026-06-14days on market $135,000 Active 131 DOM
-
2026-06-13days on market $135,000 Active 130 DOM
-
2026-06-10days on market $135,000 Active 128 DOM
-
2026-06-09days on market $135,000 Active 127 DOM
-
2026-06-08days on market $135,000 Active 126 DOM
-
2026-06-07days on market $135,000 Active 125 DOM
-
2026-06-05days on market $135,000 Active 122 DOM
-
2026-06-03days on market $135,000 Active 121 DOM
-
2026-06-02days on market $135,000 Active 120 DOM
-
2026-06-01days on market $135,000 Active 119 DOM
-
2026-05-31days on market $135,000 Active 118 DOM
-
2026-05-30days on market $135,000 Active 117 DOM
-
2026-02-02$135,000 Active 438-char remark
Show marketing remark (438 chars)
Newer Mfg Home located in a Family park. Spacious Family room WITH CEILING FAN.Vaulted ceiling in Kitchen/dining. Room divder with pantry storage on kitchen side. Indoor laundry room .HOme has 3 bedroom with 2 full bathrooms The primary bedroom is large with a soaking tub and walkin a shower in bathroom. Storge shed in back with a added office room. Backyard patio for entertaining. Short distance to Napa for your shopping needs
-
2025-10-16price $129,999
-
2025-07-01status Active
-
2025-06-12price $135,000
-
2025-01-23price $149,000
-
2024-12-31$155,000 Active
-
2023-01-19soldstatus $115,000 Closed
-
2023-01-18soldstatus $115,000
-
2022-12-13historical Contingent (Show)
-
2022-11-28$125,000 Active
-
2022-11-28$125,000
-
2014-11-14soldstatus $69,000 Sold
-
2014-08-17status Contingent
-
2014-08-08status Active
-
2014-08-08historical Off-Market
-
2013-08-10$69,000 Active
-
2013-07-13historical Expired
-
2012-07-18$72,000 Active
ⓘ Source: listings_history table (triggers on properties + properties_extension) + one-shot
backfill from property_details.listing_events for pre-trigger history.
Tax reassessment forecast CA · Resets to sale price
- Current annual tax
- $714 · $60/mo
- Projected year-2 tax
- $1,026 · $86/mo
- Expected delta
- +$312/yr (+$26/mo · 43.7%)
ⓘ Screening estimate from a state-policy table — verify with the county assessor before closing.
Climate risk First Street
- Flood 1/10 Low FEMA zone X (unshaded) · 0% chance over 30 yrs
- Wildfire 6/10 Major
- Heat 5/10 Major 7 d/yr ≥99°F today · 16 d/yr by 30 yrs out
- Wind 1/10 Low
- Air quality 10/10 Extreme 26 unhealthy d/yr today · 27 by 30 yrs out
Nearby sold comps map
Loading sold comps map…
Walkable amenities ~0.75 mi
Loading nearby amenities…
Taxation est. · year 1
- Rental income
- $41,416
- − Mortgage interest
- −$7,562
- − Property taxes
- −$714
- − Insurance
- −$675
- − Repairs & maintenance
- −$3,313
- − Management
- −$3,313
- − Depreciation
- −$3,927
- Taxable income
- $21,911
- Est. tax owed @ 24.0%
- −$5,259
- After-tax cash flow
- $17,575/yr
For passive investors: Depreciation is non-cash, so a rental often shows a tax loss while cash-flowing — sheltering income. Rental losses are passive: they offset passive income freely, and up to $25,000/yr can offset ordinary (W-2) income if you actively participate and your MAGI is under $100k (phasing out to $0 by $150k); unused losses carry forward. On sale, claimed depreciation is recaptured at up to 25%, and gains may owe capital-gains tax (a 1031 exchange can defer both). Figures are a year-1 estimate at your 24.0% rate — not tax advice; consult a CPA.
Schools (NCES district)
- District
- Napa Valley Unified
- NCES district ID
- 0626640
- Math proficiency
- 35% ▲ 1.00%
- Reading proficiency
- 48% ▲ 2.00%
- Median HH income
- $72,007
- Composite
- 40.18/100
- National rank
- #7827
- State rank
- #599 of 1400 in CA
Livability — Moskowite Corner
- Score
- 37/100
- State rank
- #1427
- US rank
- #27607
Category grades
Schools grade is shown separately in the Schools card above.
Census & demographics
- Census place
- Moskowite Corner, CA
- County
- Napa County · 120,669 people
- Metro
- Napa, CA
- Population (ZIP)
- 63,657
- Household income
- $113,269
- Rent vs Own
- Severe rent burden
- 2095.0
Population outlook (Napa County) Hauer SSP2
- Today (2025)
- 153,987 people
- By 2030
- 159,490 · +3.6%
- By 2040
- 168,796 · +9.6%
- By 2050
- 176,213 · +14.4%
- By 2075
- 190,113 · +23.5%
- By 2100
- 190,528 · +23.7%
Race, ethnicity, and origin ACS 2023
- Neighborhood character
- Diverse neighborhood (Simpson 0.56)
- Race & ethnicity
- White 54% Hispanic / Latino 37% Two or more races 15% Asian 3% Native American 1%
- Hispanic origin (detail)
- Mexican 31%
- Common ancestry
- Italian 4% Lithuanian 2% Portuguese 2%
- Foreign-born
- 21% · Canada
- Languages at home
- 68% English-only · Spanish 28% Other Indo-European 1% Tagalog/Filipino 1%
Political lean MEDSL · Napa
- 2024 margin
- Solid D (+34.9) · D 65.9% · R 31.1% · Other 3.0%
- 2008→2024 swing
- +2.4pp toward D · 2008: 32.5pp · 2024: 34.9pp
- All cycles
- 2024: D+34.9 2020: D+40.4 2016: D+35.2 2012: D+25.7 2008: D+32.5
Not yet ingested
- Civics
- —
Market trends
- HPI YoY
- ▼ -842.94%
- Current HPI
- 296.0661
- Rent YoY
- ▼ -0.50%
- Metro
- Napa, CA
- State GDP YoY
- ▲ 3.21%
- F500 in state
- 116
Industry mix (Fortune 500 HQ in CA)
| Industry | F500 HQs | Revenue |
|---|---|---|
| Technology | 27 | $1,492B |
|
||
| Financial Services | 3 | $174B |
|
||
| Retail | 3 | $44B |
|
||
| Insurance | 3 | $26B |
|
||
| Media / Entertainment | 2 | $115B |
|
||
| Pharmaceuticals / Biotech | 2 | $62B |
|
||
Price history
+87.5% since first listed18 events — show timeline
- 2026-02-02 Listed $135,000 BAREIS
- 2025-10-16 Price Changed $129,999 BAREIS
- 2025-07-01 Relisted — BAREIS
- 2025-06-12 Price Changed $135,000 BAREIS
- 2025-01-23 Price Changed $149,000 BAREIS
- 2024-12-31 Listed $155,000 BAREIS
- 2023-01-19 Sold (MLS) $115,000 BAREIS
- 2023-01-18 Sold (MLS) $115,000 San Francisco MLS
- 2022-12-13 Contingent — BAREIS
- 2022-11-28 Listed $125,000 BAREIS
- 2022-11-28 Listed $125,000 San Francisco MLS
- 2014-11-14 Sold (MLS) $69,000 BAREIS
- 2014-08-17 Pending — BAREIS
- 2014-08-08 Relisted — BAREIS
- 2014-08-08 Delisted — BAREIS
- 2013-08-10 Listed $69,000 BAREIS
- 2013-07-13 Delisted — BAREIS
- 2012-07-18 Listed $72,000 BAREIS
Property tax history
-1.4%/yrLatest (2025): $714 · +1.8% YoY. Source: county tax records.
Cash-flow waterfall
monthlySold comps — $/sqft
last 12 mo · ≤1 miLoading sold comps…