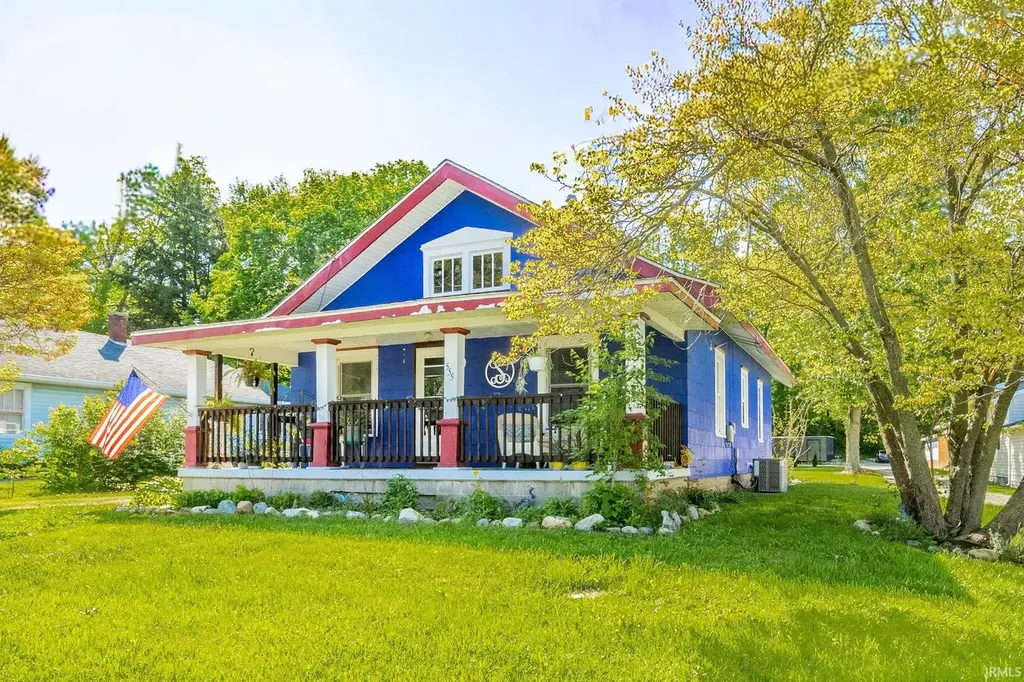
555 Elliott Ave · New Castle, IN
Flood risk 6/10 · Moderate
- FEMA flood zone
- X (unshaded)
- Chance of flooding over 30 yrs
- 0.68%
- Est. flood insurance / yr
- $473 – $860
Fire risk 1/10 · Minimal
- Est. fire insurance / yr
- $717 – $1,331
Heat risk 3/10 · Minor
- Hot days now (above 99°F)
- 7 days/yr
- Hot days in 30 yrs
- 18 days/yr
Wind risk 2/10 · Minimal
- Chance of severe wind over 30 yrs
- 1.0%
Air-quality risk 2/10 · Minimal
- Unhealthy air days now
- 1 days/yr
- Unhealthy air days in 30 yrs
- 2 days/yr
Risk factors via First Street. Map © Google.
Why this score? — see what drove the C- grade
The composite is a weighted blend of 9 inputs, each scored 0–100. Each bar is that input's sub-score; the figure is the points it added to the 100-point composite (weight × sub-score).
- Cash flow +21.4/30.0
- ARV discount +7.5/15.0
- DSCR +6.8/10.0
- 1% rule +4.6/10.0
- Livability +3.8/5.0
- Rent growth +3.6/5.0
- Schools +2.7/10.0
- Condition / age +2.5/5.0
- Appreciation +0.0/10.0
$99,000
🖨 Deal sheet (PDF) 📄 Offer letter ✓ Due diligence
Listing remarks MLS
Spacious 2 bedroom home with a large garage and a large yard. The home needs some finish work, but has character. The room off the kitchen is plumbed for a second bath. Separate utility room. Nice front porch and back deck. Central air unit is not that old. Sold AS IS
Key facts
- 0.52 acre lot
- 2 garage spots
- Built 1900
Property features AI
Exterior
- Parking: Attached garage; 2 garage spaces; Circular driveway
- Utilities: Public water; Public sewer
- Home design: Single-family site-built home; One story
- Construction: Wood siding and asbestos exterior materials; Block foundation
- Exterior features: Covered porch/patio; Level lot
Interior
- Kitchen: Electric range; Refrigerator
- Bedrooms: Total of 6 rooms (includes bedrooms and living spaces); Laundry located on the main level
- Bathrooms: One full bathroom on the main level
- Heating & cooling: Natural gas forced-air heating; Central air conditioning
- Interior features: Refrigerator; Washer; Electric range; Dryer; Unfinished basement
- Laundry & utility: Washer and dryer; Main-level laundry
Neighborhood map
What this means for you Summary
Snapshot
- This is a 2-bed/1.5-bath single-family listed at $99k.
Deal economics
- At list price, monthly cash flow is $146 ($2k/yr) — positive.
- The deal already cash-flows at list — no discount required.
- To meet the 1% rule (rent ≥ 1% of price), the offer needs to be $95k (3.9% below list).
- Recommended offer: $95k (3.9% below list) — sets the bar for 1% rule.
- Cap rate 8.1% vs local median 4.7% in New Castle — top-decile yield for the area; either an underpriced asset or a hidden risk that comps aren't pricing in. Stress-test before assuming the spread holds.
Location & tenants
- Location reads 75/100 on livability (#64 in IN, #4,219 nationally) — a middle-class / working-renter tenant base. Strengths: crime A+, cost of living A+, housing A+; Watch: amenities F, commute F, employment D-.
- New Castle Community School Corporation (town): math 30% / reading 35% proficiency, ranked #229 of 301 in IN (top 76%) — families likely to look elsewhere, expect single-tenant / working-renter base with shorter leases.
- Zoned schools: Parker Elementary School (math 22% / reading 17%, grade F, #814 of 994 statewide, top 83%, 258 students, 79% FRL); New Castle Middle School (math 20% / reading 31%, grade F, #243 of 330 statewide, top 74%, 666 students, 61% FRL); New Castle High School (math 27% / reading 52%, grade F, #221 of 369 statewide, top 63%, 836 students, 56% FRL).
- Market conditions: Rents rising fast (+4.6%/yr); 217 active listings in the ZIP; 4 comparable units currently listed for rent nearby; rentals at typical pace (median 25d on market — plan ~3-4 weeks tenant-placement turnaround); 47 units permitted in Henry County in 2024 (0 in 5+ unit buildings).
Forward outlook
- Local home prices are declining (-3.0%/yr); year-one equity from $684 of loan paydown is wiped out by about $3k of value loss. Plan a longer hold.
- Henry County population projected at -12% by 2050 — secular population decline; favor cash flow + early exit over multi-decade hold.
Negotiation context
- Only 1 days on market — expect competitive offers; lowballing is unlikely to land.
- 6 sale attempts since 24y ago with the ask held roughly flat each time — persistent listings suggest the price (not the market) is what's stuck; bring a comps-based counter.
- Current owner paid $50k; list at $99k implies a 98% gain — meaningful room to come down on a strong offer.
Risks & watch-outs
- Watch-outs: built in 1900 — expect roof / HVAC / electrical / plumbing capex.
- Climate carrying-cost: major flood risk — expect insurance premiums to compound above CPI over the hold.
Questions for the listing agent
- Built in 1900 — when were the roof, HVAC, electrical panel, plumbing, and water heater last replaced?
- Is there a deadline driving the sale (1031 exchange, divorce, estate, relocation)? That informs how much negotiation room exists.
- Schools are D-rated, which usually means shorter tenancies and higher turnover. Who's the typical renter profile here, and what's been the actual vacancy rate?
- What's the average days-on-market for RENTAL listings here right now (not sales)? A rising rental-DOM trend means longer vacancies and softer asking-rent achievability than the comps imply.
- What's the recent tenant-quality profile in this submarket — average credit score on applications, eviction rate, late-payment / NSF rate, and stable-employment percentage? A property-management company in the area should have these aggregated.
- How much new for-sale + rental construction is in the pipeline within 1–3 miles? Heavy new supply typically softens prices + rents 12–24 months out; constrained supply supports both.
Investment metrics
- 1% rule
- 0.96% ✗
- Cap rate
- 8.06%
- Cash-on-cash
- 6.32%
- DSCR
- 1.28
- GRM
- 8.7
CMA / ARV
- ARV (on-the-fly)
- $99,072
- Comps found
- 11
Show comp detail 11 sales within ~0.75 mi
| Address | Dist | Beds/Ba | Sqft | Sold | Price | $/sf | Match |
|---|---|---|---|---|---|---|---|
| 555 Elliott Ave | 0.00mi | 2/1.0 | 1,152 (0%) | 1mo | $99,000 | $86 | 97 |
| 1616 Carpenter Ct | 0.69mi | 2/1.0 | 1,152 (0%) | 10mo | $68,500 | $59 | 58 |
| 1603 C Ave | 0.72mi | 2/1.0 | 1,204 (+4%) | 1mo | $47,500 | $39 | 56 |
| 999 Church St | 0.30mi | 2/1.0 | 1,066 (-8%) | 21mo | $151,650 | $142 | 54 |
| 149 S 6th St | 0.24mi | 3/1.0 (+1) | 1,028 (-11%) | 14mo | $74,900 | $73 | 52 |
| 301 Park Ave | 0.60mi | 2/1.0 | 1,062 (-8%) | 12mo | $112,500 | $106 | 47 |
| 508 Cedar Dr | 0.65mi | 2/1.0 | 1,255 (+9%) | 7mo | $164,900 | $131 | 47 |
| 1035 Jameson Ct | 0.70mi | 3/1.5 (+1) | 1,152 (0%) | 20mo | $169,900 | $147 | 45 |
| 324 Park Ave | 0.66mi | 2/1.0 | 1,296 (+12%) | 9mo | $45,700 | $35 | 39 |
| 1141 S Main St | 0.62mi | 2/1.0 | 1,322 (+15%) | 15mo | $155,000 | $117 | 32 |
| 929 S 16th St | 0.68mi | 2/1.0 | 988 (-14%) | 18mo | $20,000 | $20 | 27 |
Match score weights: distance 35% · size 25% · config 20% · recency 20%. Top-matched comps best support the ARV.
Projected returns pro-forma
-3.0% appreciation · 4.59% rent growth · sell at horizon
- IRR
- -5.0%
- Equity multiple
- 0.81×
- Total profit
- $-5,231
- Equity at exit
- $14,761
- IRR
- 6.3%
- Equity multiple
- 1.50×
- Total profit
- $13,838
- Equity at exit
- $8,560
Cash invested: $27,720 (down + closing). Projections, not guarantees.
Landlord ↔ Tenant lean methodology
- Overall (STATE)
- 90 Strongly Landlord-Friendly
- State Indiana
- 90 Strongly Landlord-Friendly · R+11
- County
- — inherits STATE
- City
- — inherits STATE
ZIP-level market 47362
- Home prices YoY
- -16.0%
- Rents YoY
- 4.6%
- Active inventory
- 217
- Price-to-rent
- 8.7×
Monthly cashflow live
- Estimated rent
- $952 medium interval (Pro) →
- Mortgage (P&I)
- −$519
- Tax from tax record
- −$46 /mo · $547/yr
- Insurance
- −$41
- HOA
- −$0
- Vacancy / Maint / Mgmt
- −$200
- Net cashflow
- $146
Break-even live
Sensitivity live
| Price | -10% $202 | -5% $174 | +0% $146 | +5% $118 | +10% $90 |
|---|---|---|---|---|---|
| Rent | -10% $71 | -5% $108 | +0% $146 | +5% $184 | +10% $221 |
| Rate | -1.0pp $196 | -0.5pp $171 | base $146 | +0.5pp $120 | +1.0pp $94 |
UW: 25.0% down · 7.5% · 30yr · 1.5% tax · 5.0% vac · 8.0% maint · 8.0% mgmt
Financing live
Cash to close
- Down payment
- $24,750
- Closing costs
- $2,970
- Reserves months
- —
- Total cash needed
- —
Loan-product check · same deal, 3 products live
Conventional
25% down · 7.5% · 30yr
- Down + closing
- —
- Monthly P&I
- —
- Monthly cashflow
- —
- DSCR
- —
- Eligible?
- —
Personal DTI + credit; lowest rate.
DSCR
20% down · 8.5% · 30yr
- Down + closing
- —
- Monthly P&I
- —
- Monthly cashflow
- —
- DSCR
- —
- Eligible?
- —
No personal income docs; deal must DSCR.
Hard money
10% down · 12.0% · 12mo
- Down + closing
- —
- Monthly P&I
- —
- Monthly cashflow
- —
- DSCR
- —
- Eligible?
- —
Short-term bridge; refi at stabilization.
Rent comps 4 comps
| Address | Beds | Baths | Sqft | Rent | $/sqft | DOM | Units | Dist |
|---|---|---|---|---|---|---|---|---|
| 940 S 15th St New Castle, IN | 1.0–2.0 | 1.0–1.5 | 816 | $1,075 | $1.32 | 0d | 2 | 0.68mi |
| 1216 S 19th St New Castle, IN | 2.0 | 1.0 | 824 | $1,000 | $1.21 | 25d | 1 | 1.00mi |
| 1402 Alabama St New Castle, IN | 2.0 | 1.0 | 912 | $795 | $0.87 | 25d | 1 | 1.23mi |
| 1618 P Ave New Castle, IN | 3.0 | 1.5 | 1064 | $950 | $0.89 | 3d | 1 | 1.32mi |
Listing history 12 events
-
2026-05-13status Pending
-
2026-05-13$99,000 Active
-
2021-12-08soldstatus $49,900 274-char remark
Show marketing remark (268 chars)
Spacious 2 bedroom home with a large garage and a large yard. The home needs some finish work, but has character. The room off the kitchen is plumbed for a second bath. Separate utility room. Nice front porch and back deck. Central air unit is not that old. Sold AS IS
-
2021-12-08soldstatus $49,900 268-char remark
Show marketing remark (268 chars)
Spacious 2 bedroom home with a large garage and a large yard. The home needs some finish work, but has character. The room off the kitchen is plumbed for a second bath. Separate utility room. Nice front porch and back deck. Central air unit is not that old. Sold AS IS
-
2021-12-08soldstatus $49,900
Show marketing remark (268 chars)
Spacious 2 bedroom home with a large garage and a large yard. The home needs some finish work, but has character. The room off the kitchen is plumbed for a second bath. Separate utility room. Nice front porch and back deck. Central air unit is not that old. Sold AS IS
-
2021-09-03$49,900 274-char remark
Show marketing remark (268 chars)
Spacious 2 bedroom home with a large garage and a large yard. The home needs some finish work, but has character. The room off the kitchen is plumbed for a second bath. Separate utility room. Nice front porch and back deck. Central air unit is not that old. Sold AS IS
-
2021-09-03$49,900
Show marketing remark (268 chars)
Spacious 2 bedroom home with a large garage and a large yard. The home needs some finish work, but has character. The room off the kitchen is plumbed for a second bath. Separate utility room. Nice front porch and back deck. Central air unit is not that old. Sold AS IS
-
2021-09-03$49,900 268-char remark
Show marketing remark (268 chars)
Spacious 2 bedroom home with a large garage and a large yard. The home needs some finish work, but has character. The room off the kitchen is plumbed for a second bath. Separate utility room. Nice front porch and back deck. Central air unit is not that old. Sold AS IS
-
2010-09-21historical
-
2010-04-30$39,900
-
2003-12-30historical
-
2002-12-30$74,900
ⓘ Source: listings_history table (triggers on properties + properties_extension) + one-shot
backfill from property_details.listing_events for pre-trigger history.
Tax reassessment forecast IN · Partial reset (capped growth)
- Current annual tax
- $547 · $46/mo
- Projected year-2 tax
- $694 · $58/mo
- Expected delta
- +$147/yr (+$12/mo · 26.9%)
ⓘ Screening estimate from a state-policy table — verify with the county assessor before closing.
Climate risk First Street
- Flood 6/10 Major FEMA zone X (unshaded) · 68% chance over 30 yrs
- Wildfire 1/10 Low
- Heat 3/10 Moderate 7 d/yr ≥99°F today · 18 d/yr by 30 yrs out
- Wind 2/10 Low 100% chance of damaging wind over 30 yrs
- Air quality 2/10 Low 1 unhealthy d/yr today · 2 by 30 yrs out
Nearby sold comps map
Loading sold comps map…
Walkable amenities ~0.75 mi
Loading nearby amenities…
Taxation est. · year 1
- Rental income
- $11,422
- − Mortgage interest
- −$5,546
- − Property taxes
- −$547
- − Insurance
- −$495
- − Repairs & maintenance
- −$914
- − Management
- −$914
- − Depreciation
- −$2,880
- Taxable income
- $127
- Est. tax owed @ 24.0%
- −$31
- After-tax cash flow
- $1,721/yr
For passive investors: Depreciation is non-cash, so a rental often shows a tax loss while cash-flowing — sheltering income. Rental losses are passive: they offset passive income freely, and up to $25,000/yr can offset ordinary (W-2) income if you actively participate and your MAGI is under $100k (phasing out to $0 by $150k); unused losses carry forward. On sale, claimed depreciation is recaptured at up to 25%, and gains may owe capital-gains tax (a 1031 exchange can defer both). Figures are a year-1 estimate at your 24.0% rate — not tax advice; consult a CPA.
Schools (NCES district)
- District
- New Castle Community School Corporation
- NCES district ID
- 1807440
- Math proficiency
- 30% ▼ -13.00%
- Reading proficiency
- 35% ▼ -9.00%
- Median HH income
- $36,717
- Composite
- 26.99/100
- National rank
- #7067
- State rank
- #229 of 301 in IN
Livability — New Castle
- Score
- 75/100
- State rank
- #64
- US rank
- #4219
Category grades
Schools grade is shown separately in the Schools card above.
Census & demographics
- Census place
- New Castle, IN
- County
- Henry County · 29,337 people
- City population
- 29,337
- Metro
- New Castle, IN
- Population (ZIP)
- 29,337
- Household income
- $60,258
- Rent vs Own
- Severe rent burden
- 545.0
Population outlook (Henry County) Hauer SSP2
- Today (2025)
- 48,028 people
- By 2030
- 47,125 · -1.9%
- By 2040
- 44,820 · -6.7%
- By 2050
- 42,207 · -12.1%
- By 2075
- 35,814 · -25.4%
- By 2100
- 26,779 · -44.2%
Race, ethnicity, and origin ACS 2023
- Neighborhood character
- Predominantly White (90%)
- Race & ethnicity
- White 90% Two or more races 3% Black 3% Hispanic / Latino 3%
- Common ancestry
- Italian 2% Slovak 1% Lithuanian 1%
- Foreign-born
- 2% · Canada
- Languages at home
- 97% English-only · Spanish 2%
Political lean MEDSL · Henry
- 2024 margin
- Solid R (+47.7) · D 25.3% · R 73.0% · Other 1.7%
- 2008→2024 swing
- -43.8pp toward R · 2008: -3.9pp · 2024: -47.7pp
- All cycles
- 2024: R+47.7 2020: R+45.2 2016: R+43.7 2012: R+17.0 2008: R+3.9
Not yet ingested
- Civics
- —
Market trends
- HPI YoY
- ▼ -43.70%
- Current HPI
- 228.8885
- Rent YoY
- ▲ 4.59%
- Metro
- New Castle, IN
- State GDP YoY
- ▲ 2.90%
- F500 in state
- 18
Industry mix (Fortune 500 HQ in IN)
| Industry | F500 HQs | Revenue |
|---|---|---|
| Industrial Machinery | 2 | $37B |
|
||
| Healthcare | 1 | $177B |
|
||
| Pharmaceuticals | 1 | $45B |
|
||
| Metals / Steel | 1 | $18B |
|
||
| Agriculture | 1 | $17B |
|
||
| Packaging | 1 | $12B |
|
||
Price history
+32.2% since first listed12 events — show timeline
- 2026-05-13 Pending — IRMLS
- 2026-05-13 Listed $99,000 IRMLS
- 2021-12-08 Sold (MLS) $49,900 RRELMS
- 2021-12-08 Sold (MLS) $49,900 IRMLS
- 2021-12-08 Sold (MLS) $49,900 MIBOR as Distributed by MLS Grid
- 2021-09-03 Listed $49,900 RRELMS
- 2021-09-03 Listed $49,900 MIBOR as Distributed by MLS Grid
- 2021-09-03 Listed $49,900 IRMLS
- 2010-09-21 Listing Removed — MIBOR as Distributed by MLS Grid
- 2010-04-30 Listed $39,900 MIBOR as Distributed by MLS Grid
- 2003-12-30 Listing Removed — MIBOR as Distributed by MLS Grid
- 2002-12-30 Listed $74,900 MIBOR as Distributed by MLS Grid
Property tax history
-10.6%/yrLatest (2024): $547 · +6.6% YoY. Source: county tax records.
Cash-flow waterfall
monthlySold comps — $/sqft
last 12 mo · ≤1 miLoading sold comps…