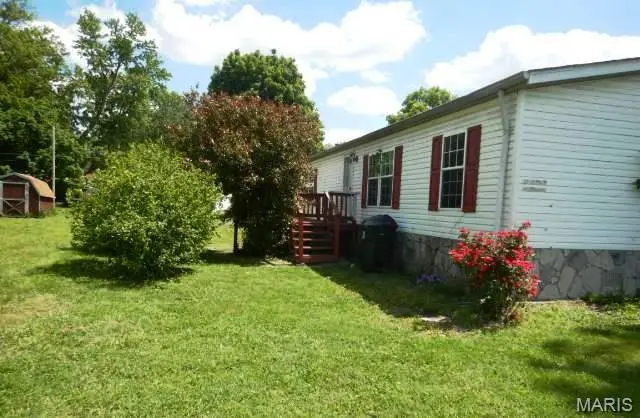
1424 N Main St · Dupo, IL
Flood risk 1/10 · Minimal
- FEMA flood zone
- X (shaded)
- Chance of flooding over 30 yrs
- 0.0%
- Est. flood insurance / yr
- $507 – $1,088
Fire risk 1/10 · Minimal
- Est. fire insurance / yr
- $804 – $1,492
Heat risk 5/10 · Moderate
- Hot days now (above 107°F)
- 7 days/yr
- Hot days in 30 yrs
- 21 days/yr
Wind risk 2/10 · Minimal
- Chance of severe wind over 30 yrs
- 1.0%
Air-quality risk 3/10 · Minor
- Unhealthy air days now
- 2 days/yr
- Unhealthy air days in 30 yrs
- 3 days/yr
Risk factors via First Street. Map © Google.
Why this score? — see what drove the B- grade
The composite is a weighted blend of 9 inputs, each scored 0–100. Each bar is that input's sub-score; the figure is the points it added to the 100-point composite (weight × sub-score).
- Cash flow +30.0/30.0
- 1% rule +10.0/10.0
- DSCR +10.0/10.0
- ARV discount +9.1/15.0
- Livability +3.8/5.0
- Rent growth +2.5/5.0
- Condition / age +2.5/5.0
- Schools +1.2/10.0
- Appreciation +0.0/10.0
$69,900
🖨 Deal sheet (PDF) 📄 Offer letter ✓ Due diligence
Listing remarks MLS
Spacious and open home with so much to offer the new owner! The property features open floor plan, main floor laundry, two full baths, three bedrooms, covered porch on the back and so much more! Affordable opportunity with plenty of potential! This manufactured double-wide home offers an open-concept layout with vaulted ceilings, creating an airy and inviting main living area. Featuring a functional floor plan with room to make it your own. Situated on a double lot, there is ample outdoor space for gardening, recreation, additional parking, or future improvements. While the property does need repairs and updating, it presents an excellent opportunity for investors, flippers, or buyers looking to build equity. Bring your vision and restore this home to its full potential!
Key facts
- 5,662 sq ft lot
- Built 1997
- Listed 69 days
Neighborhood map
What this means for you Summary
Snapshot
- This is a 3-bed/2.0-bath manufactured listed at $70k.
Deal economics
- At list price, monthly cash flow is $637 ($8k/yr) — positive.
- The deal already cash-flows at list — no discount required.
- Meets the 1% rule at list price ($1k rent vs $70k).
- Recommended offer: $66k (6.0% below list) — sets the bar for market timing.
Location & tenants
- Location reads 75/100 on livability (#208 in IL, #3,916 nationally) — a middle-class / working-renter tenant base. Strengths: commute A+, cost of living A+, crime A-; Watch: schools F, amenities F, employment F.
- Dupo CUSD 196 (suburban): math 7% / reading 19% proficiency, ranked #543 of 620 in IL (top 88%) — low school quality limits family demand, transient renter base, plan for 1-2y turnover.
- Market conditions: 22 active listings in the ZIP; 2 comparable units currently listed for rent nearby; 783 units permitted in St. Clair County in 2024 (378 in 5+ unit buildings).
Forward outlook
- Local home prices are declining (-3.0%/yr); year-one equity from $483 of loan paydown is wiped out by about $2k of value loss. Plan a longer hold.
- St. Clair County population projected at -23% by 2050 — secular population decline; favor cash flow + early exit over multi-decade hold.
- At projected returns (-3.0% appreciation + 3.0% rent growth), your $20k cash investment doubles in ~4 years — after that, you're playing with house money.
Negotiation context
- It's been on market 70 days — a 6% lower offer ($66k) is reasonable based on typical stale-listing flexibility.
- Current owner paid $4k; list at $70k implies a 1648% gain — meaningful room to come down on a strong offer.
Risks & watch-outs
- Climate carrying-cost: extreme-heat days projected 7→21/yr by 2055 (HVAC capex compounding) — expect insurance premiums to compound above CPI over the hold.
Questions for the listing agent
- It's been on market 70 days. Have you received any prior offers? Is the seller open to a 6% concession, seller financing, or rate buy-down credit?
- Why hasn't it sold? Are there any deal-killer items the seller is aware of (foundation, flood, title, zoning, code violations)?
- Is there a deadline driving the sale (1031 exchange, divorce, estate, relocation)? That informs how much negotiation room exists.
- Schools are F-rated, which usually means shorter tenancies and higher turnover. Who's the typical renter profile here, and what's been the actual vacancy rate?
- What's the average days-on-market for RENTAL listings here right now (not sales)? A rising rental-DOM trend means longer vacancies and softer asking-rent achievability than the comps imply.
- What's the recent tenant-quality profile in this submarket — average credit score on applications, eviction rate, late-payment / NSF rate, and stable-employment percentage? A property-management company in the area should have these aggregated.
- How much new for-sale + rental construction is in the pipeline within 1–3 miles? Heavy new supply typically softens prices + rents 12–24 months out; constrained supply supports both.
Investment metrics
- 1% rule
- 2.03% ✓
- Cap rate
- 17.23%
- Cash-on-cash
- 39.06%
- DSCR
- 2.74
- GRM
- 4.1
CMA / ARV
- ARV (median comp)
- $72,450
- List price
- $69,900
- Delta
- -3.52%
- Verdict
- FAIR
- Comps
- 2 within 2.0 mi
Projected returns pro-forma
-3.0% appreciation · 3.0% rent growth · sell at horizon
- IRR
- 35.3%
- Equity multiple
- 2.50×
- Total profit
- $29,265
- Equity at exit
- $10,422
- IRR
- 42.1%
- Equity multiple
- 4.98×
- Total profit
- $77,812
- Equity at exit
- $6,044
Cash invested: $19,572 (down + closing). Projections, not guarantees.
Landlord ↔ Tenant lean methodology
- Overall (STATE)
- 43 Moderately Tenant-Leaning
- State Illinois
- 43 Moderately Tenant-Leaning · D+7
- County
- — inherits STATE
- City
- — inherits STATE
ZIP-level market 62239
- Active inventory
- 22
- Price-to-rent
- 4.1×
Monthly cashflow live
- Estimated rent
- $1,418 medium interval (Pro) →
- Mortgage (P&I)
- −$367
- Tax est. 1.5%
- −$87 /mo · $1,048/yr
- Insurance
- −$29
- HOA
- −$0
- Vacancy / Maint / Mgmt
- −$298
- Net cashflow
- $637
Break-even live
Sensitivity live
| Price | -10% $685 | -5% $661 | +0% $637 | +5% $613 | +10% $589 |
|---|---|---|---|---|---|
| Rent | -10% $525 | -5% $581 | +0% $637 | +5% $693 | +10% $749 |
| Rate | -1.0pp $672 | -0.5pp $655 | base $637 | +0.5pp $619 | +1.0pp $600 |
UW: 25.0% down · 7.5% · 30yr · 1.5% tax · 5.0% vac · 8.0% maint · 8.0% mgmt
Financing live
Cash to close
- Down payment
- $17,475
- Closing costs
- $2,097
- Reserves months
- —
- Total cash needed
- —
Loan-product check · same deal, 3 products live
Conventional
25% down · 7.5% · 30yr
- Down + closing
- —
- Monthly P&I
- —
- Monthly cashflow
- —
- DSCR
- —
- Eligible?
- —
Personal DTI + credit; lowest rate.
DSCR
20% down · 8.5% · 30yr
- Down + closing
- —
- Monthly P&I
- —
- Monthly cashflow
- —
- DSCR
- —
- Eligible?
- —
No personal income docs; deal must DSCR.
Hard money
10% down · 12.0% · 12mo
- Down + closing
- —
- Monthly P&I
- —
- Monthly cashflow
- —
- DSCR
- —
- Eligible?
- —
Short-term bridge; refi at stabilization.
Rent comps 2 comps
| Address | Beds | Baths | Sqft | Rent | $/sqft | DOM | Units | Dist |
|---|---|---|---|---|---|---|---|---|
| 30 Saint Gregory Dr East Saint Louis, IL | 4.0 | 2.0 | 1330 | $1,395 | $1.05 | 23d | 1 | 1.18mi |
| 1130 Water St East Saint Louis, IL | 3.0 | 1.0 | 1100 | $1,450 | $1.32 | 24d | 1 | 1.38mi |
Listing history 15 events
-
2026-06-21days on market $69,900 Active 70 DOM
-
2026-06-18days on market $69,900 Active 67 DOM
-
2026-06-17days on market $69,900 Active 66 DOM
-
2026-06-16days on market $69,900 Active 65 DOM
-
2026-06-15days on market $69,900 Active 64 DOM
-
2026-06-13days on market $69,900 Active 62 DOM
-
2026-06-09days on market $69,900 Active 58 DOM
-
2026-06-08days on market $69,900 Active 57 DOM
-
2026-06-07days on market $69,900 Active 56 DOM
-
2026-06-03days on market $69,900 Active 52 DOM
-
2026-06-02days on market $69,900 Active 51 DOM
-
2026-06-01days on market $69,900 Active 50 DOM
-
2026-05-31days on market $69,900 Active 49 DOM
-
2026-04-13$69,900 Active 781-char remark
Show marketing remark (781 chars)
Spacious and open home with so much to offer the new owner! The property features open floor plan, main floor laundry, two full baths, three bedrooms, covered porch on the back and so much more! Affordable opportunity with plenty of potential! This manufactured double-wide home offers an open-concept layout with vaulted ceilings, creating an airy and inviting main living area. Featuring a functional floor plan with room to make it your own. Situated on a double lot, there is ample outdoor space for gardening, recreation, additional parking, or future improvements. While the property does need repairs and updating, it presents an excellent opportunity for investors, flippers, or buyers looking to build equity. Bring your vision and restore this home to its full potential!
-
1997-09-16soldstatus $4,000
ⓘ Source: listings_history table (triggers on properties + properties_extension) + one-shot
backfill from property_details.listing_events for pre-trigger history.
Climate risk First Street
- Flood 1/10 Low FEMA zone X (shaded) · 0% chance over 30 yrs
- Wildfire 1/10 Low
- Heat 5/10 Major 7 d/yr ≥107°F today · 21 d/yr by 30 yrs out
- Wind 2/10 Low 100% chance of damaging wind over 30 yrs
- Air quality 3/10 Moderate 2 unhealthy d/yr today · 3 by 30 yrs out
Nearby sold comps map
Loading sold comps map…
Walkable amenities ~0.75 mi
Loading nearby amenities…
Taxation est. · year 1
- Rental income
- $17,014
- − Mortgage interest
- −$3,915
- − Property taxes
- −$1,048
- − Insurance
- −$350
- − Repairs & maintenance
- −$1,361
- − Management
- −$1,361
- − Depreciation
- −$2,033
- Taxable income
- $6,944
- Est. tax owed @ 24.0%
- −$1,667
- After-tax cash flow
- $5,977/yr
For passive investors: Depreciation is non-cash, so a rental often shows a tax loss while cash-flowing — sheltering income. Rental losses are passive: they offset passive income freely, and up to $25,000/yr can offset ordinary (W-2) income if you actively participate and your MAGI is under $100k (phasing out to $0 by $150k); unused losses carry forward. On sale, claimed depreciation is recaptured at up to 25%, and gains may owe capital-gains tax (a 1031 exchange can defer both). Figures are a year-1 estimate at your 24.0% rate — not tax advice; consult a CPA.
Schools (NCES district)
- District
- Dupo CUSD 196
- NCES district ID
- 1712720
- Math proficiency
- 7% ▼ -13.00%
- Reading proficiency
- 19% ▼ -15.00%
- Median HH income
- $44,220
- Composite
- 11.52/100
- National rank
- #9701
- State rank
- #543 of 620 in IL
Livability — Dupo
- Score
- 75/100
- State rank
- #208
- US rank
- #3916
Category grades
Schools grade is shown separately in the Schools card above.
Census & demographics
- Census place
- Dupo, IL
- City population
- 1,994
- Population (ZIP)
- 4,381
Population outlook (St. Clair County) Hauer SSP2
- Today (2025)
- 250,366 people
- By 2030
- 240,511 · -3.9%
- By 2040
- 217,391 · -13.2%
- By 2050
- 192,699 · -23.0%
- By 2075
- 140,637 · -43.8%
- By 2100
- 100,499 · -59.9%
Race, ethnicity, and origin ACS 2023
- Neighborhood character
- Predominantly White (87%)
- Race & ethnicity
- White 87% Black 6% Two or more races 6% Hispanic / Latino 1%
- Common ancestry
- Romanian 6% Lithuanian 5% Italian 1%
- Foreign-born
- 2%
- Languages at home
- 99% English-only · German/W. Germanic 1%
Political lean MEDSL · St. Clair
- 2024 margin
- Lean D (+7.9) · D 53.0% · R 45.1% · Other 1.8%
- 2008→2024 swing
- -14.6pp toward R · 2008: 22.4pp · 2024: 7.9pp
- All cycles
- 2024: D+7.9 2020: D+8.7 2016: D+5.6 2012: D+14.5 2008: D+22.4
Not yet ingested
- Civics
- —
Market trends
- HPI YoY
- ▼ -94.86%
- Current HPI
- 93.13
- Rent YoY
- —
- Metro
- —
- State GDP YoY
- ▲ 1.59%
- F500 in state
- 60
Industry mix (Fortune 500 HQ in IL)
| Industry | F500 HQs | Revenue |
|---|---|---|
| Insurance | 4 | $201B |
|
||
| Consumer Goods | 4 | $87B |
|
||
| Industrial Machinery | 3 | $64B |
|
||
| Healthcare | 2 | $55B |
|
||
| Retail / Pharmacy | 1 | $148B |
|
||
| Agriculture / Food | 1 | $86B |
|
||
Price history
+1647.5% since first listed2 events — show timeline
- 2026-04-13 Listed $69,900 MARIS as Distributed by MLS Grid
- 1997-09-16 Sold (Public Records) $4,000 Public Records
Property tax history
-22.1%/yrLatest (2024): $38 · -93.4% YoY. Source: county tax records.
Cash-flow waterfall
monthlySold comps — $/sqft
last 12 mo · ≤1 miLoading sold comps…