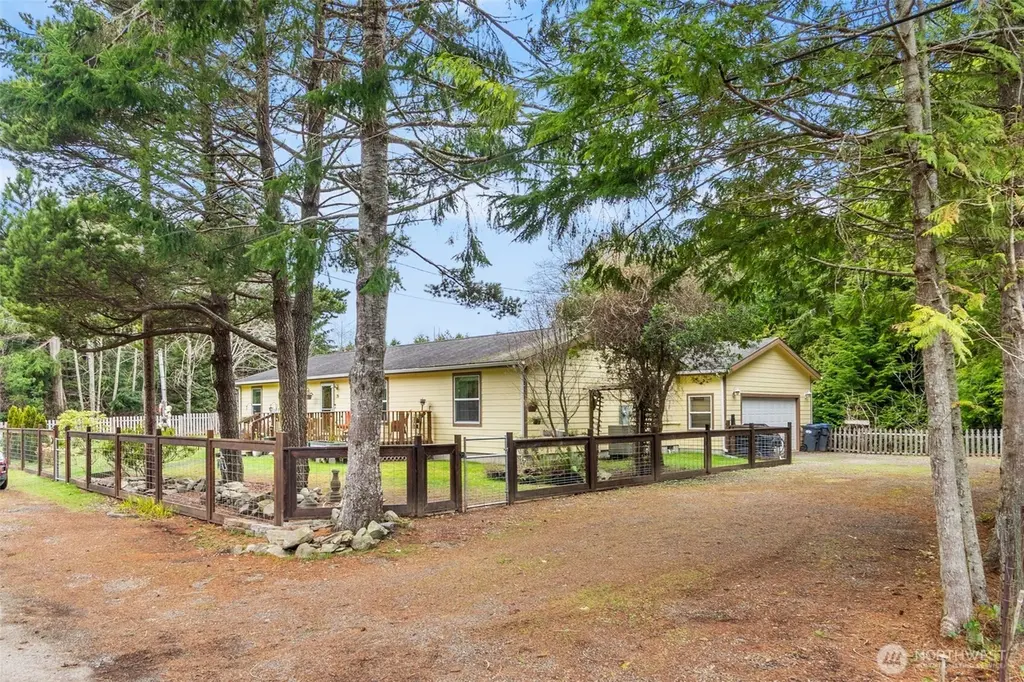
39 Paradise Ln · Pacific Beach, WA
Flood risk 1/10 · Minimal
- FEMA flood zone
- X (unshaded)
- Chance of flooding over 30 yrs
- 0.0%
- Est. flood insurance / yr
- $507 – $1,088
Fire risk 2/10 · Minimal
- Est. fire insurance / yr
- $604 – $1,122
Heat risk 1/10 · Minimal
- Hot days now (above 74°F)
- 7 days/yr
- Hot days in 30 yrs
- 14 days/yr
Wind risk 1/10 · Minimal
- Chance of severe wind over 30 yrs
- —
Air-quality risk 6/10 · Moderate
- Unhealthy air days now
- 6 days/yr
- Unhealthy air days in 30 yrs
- 6 days/yr
Risk factors via First Street. Map © Google.
Why this score? — see what drove the D grade
The composite is a weighted blend of 9 inputs, each scored 0–100. Each bar is that input's sub-score; the figure is the points it added to the 100-point composite (weight × sub-score).
- ARV discount +15.0/15.0
- Cash flow +7.6/30.0
- Appreciation +4.1/10.0
- Schools +3.4/10.0
- Rent growth +2.5/5.0
- Condition / age +2.5/5.0
- 1% rule +2.3/10.0
- Livability +2.3/5.0
- DSCR +1.7/10.0
$399,990
🖨 Deal sheet (PDF) 📄 Offer letter ✓ Due diligence
Listing remarks
2.25% ASSUMABLE LOAN. Step into your coastal sanctuary with this light, bright & well maintained home. Built to the same rigorous standards and codes as traditional stick-built residences, this modular home offers exceptional quality & peace of mind. Designed for comfort and versatility, featuring two separate living areas, a cozy fireplace, and three bedrooms—including a primary suite with its own private bath. An attached two-car garage that leads through the laundry room into the kitchen where all appliances are included. This residence is completely move-in ready. Situated on an oversized lot that hosts a variety of blueberries, strawberries & fruit trees. Locati
Key facts
- Modular home
- Primary suite
- Cozy fireplace
Tags
Neighborhood map
What this means for you Summary
Snapshot
- This is a 3-bed/2.0-bath single-family listed at $400k.
Deal economics
- At list price, monthly cash flow is $-473 ($-6k/yr) — negative.
- To cash-flow at today's rent, offer at most $332k (17.1% below list).
- To meet the 1% rule (rent ≥ 1% of price), the offer needs to be $290k (27.5% below list).
- Recommended offer: $290k (27.5% below list) — sets the bar for 1% rule.
- Cap rate 4.9% vs local median 1.4% in Pacific Beach — top-decile yield for the area; either an underpriced asset or a hidden risk that comps aren't pricing in. Stress-test before assuming the spread holds.
Location & tenants
- Location reads 46/100 on livability (#590 in WA) — a working-class tenant base; expect higher turnover. Strengths: crime A; Watch: health & safety C-, amenities F, commute F.
- North Beach School District (rural): math 32% / reading 44% proficiency, ranked #236 of 291 in WA (top 81%) — families likely to look elsewhere, expect single-tenant / working-renter base with shorter leases; 63% free/reduced lunch — lower-income household profile, screen leases tightly.
- Zoned schools: Pacific Beach Elementary School (110 students, 84% FRL); North Beach Junior High School (162 students, 78% FRL); North Beach Senior High School (177 students, 63% FRL).
- Market conditions: 105 active listings in the ZIP; 1 comparable units currently listed for rent nearby; 297 units permitted in Grays Harbor County in 2024 (17 in 5+ unit buildings).
Forward outlook
- Local home prices are declining (-1.9%/yr); year-one equity from $3k of loan paydown is wiped out by about $8k of value loss. Plan a longer hold.
- Grays Harbor County population projected at -24% by 2050 — secular population decline; favor cash flow + early exit over multi-decade hold.
Negotiation context
- It's been on market 82 days — a 6% lower offer ($376k) is reasonable based on typical stale-listing flexibility.
- 2 sale attempts since 26y ago with the ask held roughly flat each time — persistent listings suggest the price (not the market) is what's stuck; bring a comps-based counter.
- Current owner paid $20k; list at $400k implies a 1851% gain — meaningful room to come down on a strong offer.
Questions for the listing agent
- What do current leases actually rent for vs. the listed asking? Can we see a recent rent roll and the last 12 months of T-12 income?
- It's been on market 82 days. Have you received any prior offers? Is the seller open to a 27% concession, seller financing, or rate buy-down credit?
- Why hasn't it sold? Are there any deal-killer items the seller is aware of (foundation, flood, title, zoning, code violations)?
- Is there a deadline driving the sale (1031 exchange, divorce, estate, relocation)? That informs how much negotiation room exists.
- Schools are F-rated, which usually means shorter tenancies and higher turnover. Who's the typical renter profile here, and what's been the actual vacancy rate?
- The area grade is low — what's the realistic commute time and amenity access for the typical tenant pool here? Any planned neighborhood developments (good or bad) we should know about?
- What's the average days-on-market for RENTAL listings here right now (not sales)? A rising rental-DOM trend means longer vacancies and softer asking-rent achievability than the comps imply.
- What's the recent tenant-quality profile in this submarket — average credit score on applications, eviction rate, late-payment / NSF rate, and stable-employment percentage? A property-management company in the area should have these aggregated.
- How much new for-sale + rental construction is in the pipeline within 1–3 miles? Heavy new supply typically softens prices + rents 12–24 months out; constrained supply supports both.
Investment metrics
- 1% rule
- 0.73% ✗
- Cap rate
- 4.87%
- Cash-on-cash
- -5.07%
- DSCR
- 0.77
- GRM
- 11.5
CMA / ARV
- ARV (median comp)
- $601,103
- List price
- $399,990
- Delta
- -33.46%
- Verdict
- UNDERPRICED
- Comps
- 14 within 1.0 mi
Show comp detail 2 sales within ~0.75 mi
| Address | Dist | Beds/Ba | Sqft | Sold | Price | $/sf | Match |
|---|---|---|---|---|---|---|---|
| 24 Duke Ln | 0.37mi | 3/2.5 | 1,763 (+9%) | 2mo | $630,000 | $357 | 64 |
| 32 1st St N | 0.51mi | 3/2.5 | 1,724 (+6%) | 8mo | $684,000 | $397 | 56 |
Match score weights: distance 35% · size 25% · config 20% · recency 20%. Top-matched comps best support the ARV.
Projected returns pro-forma
-1.88% appreciation · 3.0% rent growth · sell at horizon
- IRR
- -17.3%
- Equity multiple
- 0.32×
- Total profit
- $-75,900
- Equity at exit
- $79,866
- IRR
- -10.3%
- Equity multiple
- 0.22×
- Total profit
- $-87,666
- Equity at exit
- $70,345
Cash invested: $111,997 (down + closing). Projections, not guarantees.
Landlord ↔ Tenant lean methodology
- Overall (STATE)
- 28 Tenant-Leaning
- State Washington
- 28 Tenant-Leaning · D+8
- County
- — inherits STATE
- City
- — inherits STATE
ZIP-level market 98571
- Home prices YoY
- -0.8%
- Active inventory
- 105
- Price-to-rent
- 11.5×
Monthly cashflow live
- Estimated rent
- $2,900 medium interval (Pro) →
- Mortgage (P&I)
- −$2,098
- Tax est. 1.5%
- −$500 /mo · $6,000/yr
- Insurance
- −$167
- HOA
- −$0
- Vacancy / Maint / Mgmt
- −$609
- Net cashflow
- $-473
Break-even live
Sensitivity live
| Price | -10% $-197 | -5% $-335 | +0% $-473 | +5% $-611 | +10% $-750 |
|---|---|---|---|---|---|
| Rent | -10% $-702 | -5% $-588 | +0% $-473 | +5% $-359 | +10% $-244 |
| Rate | -1.0pp $-272 | -0.5pp $-372 | base $-473 | +0.5pp $-577 | +1.0pp $-682 |
UW: 25.0% down · 7.5% · 30yr · 1.5% tax · 5.0% vac · 8.0% maint · 8.0% mgmt
Financing live
Cash to close
- Down payment
- $99,998
- Closing costs
- $12,000
- Reserves months
- —
- Total cash needed
- —
Loan-product check · same deal, 3 products live
Conventional
25% down · 7.5% · 30yr
- Down + closing
- —
- Monthly P&I
- —
- Monthly cashflow
- —
- DSCR
- —
- Eligible?
- —
Personal DTI + credit; lowest rate.
DSCR
20% down · 8.5% · 30yr
- Down + closing
- —
- Monthly P&I
- —
- Monthly cashflow
- —
- DSCR
- —
- Eligible?
- —
No personal income docs; deal must DSCR.
Hard money
10% down · 12.0% · 12mo
- Down + closing
- —
- Monthly P&I
- —
- Monthly cashflow
- —
- DSCR
- —
- Eligible?
- —
Short-term bridge; refi at stabilization.
Rent comps 1 comps
| Address | Beds | Baths | Sqft | Rent | $/sqft | DOM | Units | Dist |
|---|---|---|---|---|---|---|---|---|
| 38 S 4th St Pacific Beach, WA | 4.0 | 2.5 | 2196 | $2,900 | $1.32 | 45d | 1 | 0.81mi |
Listing history 4 events
-
2026-05-13status Pending
-
2026-02-20$399,990 Active
-
2000-10-05soldstatus $20,500
-
2000-07-28$21,950
ⓘ Source: listings_history table (triggers on properties + properties_extension) + one-shot
backfill from property_details.listing_events for pre-trigger history.
Climate risk First Street
- Flood 1/10 Low FEMA zone X (unshaded) · 0% chance over 30 yrs
- Wildfire 2/10 Low
- Heat 1/10 Low 7 d/yr ≥74°F today · 14 d/yr by 30 yrs out
- Wind 1/10 Low
- Air quality 6/10 Major 6 unhealthy d/yr today · 6 by 30 yrs out
Nearby sold comps map
Loading sold comps map…
Walkable amenities ~0.75 mi
Loading nearby amenities…
Taxation est. · year 1
- Rental income
- $34,800
- − Mortgage interest
- −$22,406
- − Property taxes
- −$6,000
- − Insurance
- −$2,000
- − Repairs & maintenance
- −$2,784
- − Management
- −$2,784
- − Depreciation
- −$11,636
- Taxable loss
- −$12,810
- Est. tax savings @ 24.0%
- +$3,074
- After-tax cash flow
- $-2,605/yr
For passive investors: Depreciation is non-cash, so a rental often shows a tax loss while cash-flowing — sheltering income. Rental losses are passive: they offset passive income freely, and up to $25,000/yr can offset ordinary (W-2) income if you actively participate and your MAGI is under $100k (phasing out to $0 by $150k); unused losses carry forward. On sale, claimed depreciation is recaptured at up to 25%, and gains may owe capital-gains tax (a 1031 exchange can defer both). Figures are a year-1 estimate at your 24.0% rate — not tax advice; consult a CPA.
Schools (NCES district)
- District
- North Beach School District
- NCES district ID
- 5305700
- Math proficiency
- 32% ▼ -4.00%
- Reading proficiency
- 44% ▬ 0.00%
- Median HH income
- $40,966
- Composite
- 34.46/100
- National rank
- #10153
- State rank
- #236 of 291 in WA
Livability — Pacific Beach
- Score
- 46/100
- State rank
- #590
- US rank
- #26290
Category grades
Schools grade is shown separately in the Schools card above.
Census & demographics
- Census place
- Pacific Beach, WA
- Population (ZIP)
- 52
Population outlook (Grays Harbor County) Hauer SSP2
- Today (2025)
- 66,443 people
- By 2030
- 63,255 · -4.8%
- By 2040
- 56,466 · -15.0%
- By 2050
- 50,516 · -24.0%
- By 2075
- 39,296 · -40.9%
- By 2100
- 31,142 · -53.1%
Race, ethnicity, and origin ACS 2023
- Neighborhood character
- Predominantly White (100%)
- Race & ethnicity
- White 100%
Political lean MEDSL · Grays Harbor
- 2024 margin
- Lean R (+6.0) · D 45.6% · R 51.6% · Other 2.8%
- 2008→2024 swing
- -20.6pp toward R · 2008: 14.6pp · 2024: -6.0pp
- All cycles
- 2024: R+6.0 2020: R+6.6 2016: R+7.1 2012: D+14.0 2008: D+14.6
Not yet ingested
- Civics
- —
Market trends
- HPI YoY
- ▼ -1.88%
- Current HPI
- 231.3572
- Rent YoY
- —
- Metro
- —
- State GDP YoY
- ▲ 4.65%
- F500 in state
- 22
Industry mix (Fortune 500 HQ in WA)
| Industry | F500 HQs | Revenue |
|---|---|---|
| Retail | 2 | $269B |
|
||
| Technology / Retail | 1 | $638B |
|
||
| Technology | 1 | $245B |
|
||
| Telecommunications | 1 | $38B |
|
||
| Food / Beverage | 1 | $36B |
|
||
| Automotive / Trucks | 1 | $34B |
|
||
Price history
+1722.3% since first listed4 events — show timeline
- 2026-05-13 Pending — NWMLS as Distributed by MLS Grid
- 2026-02-20 Listed $399,990 NWMLS as Distributed by MLS Grid
- 2000-10-05 Sold (MLS) $20,500 NWMLS as Distributed by MLS Grid
- 2000-07-28 Listed $21,950 NWMLS as Distributed by MLS Grid
Cash-flow waterfall
monthlySold comps — $/sqft
last 12 mo · ≤1 miLoading sold comps…