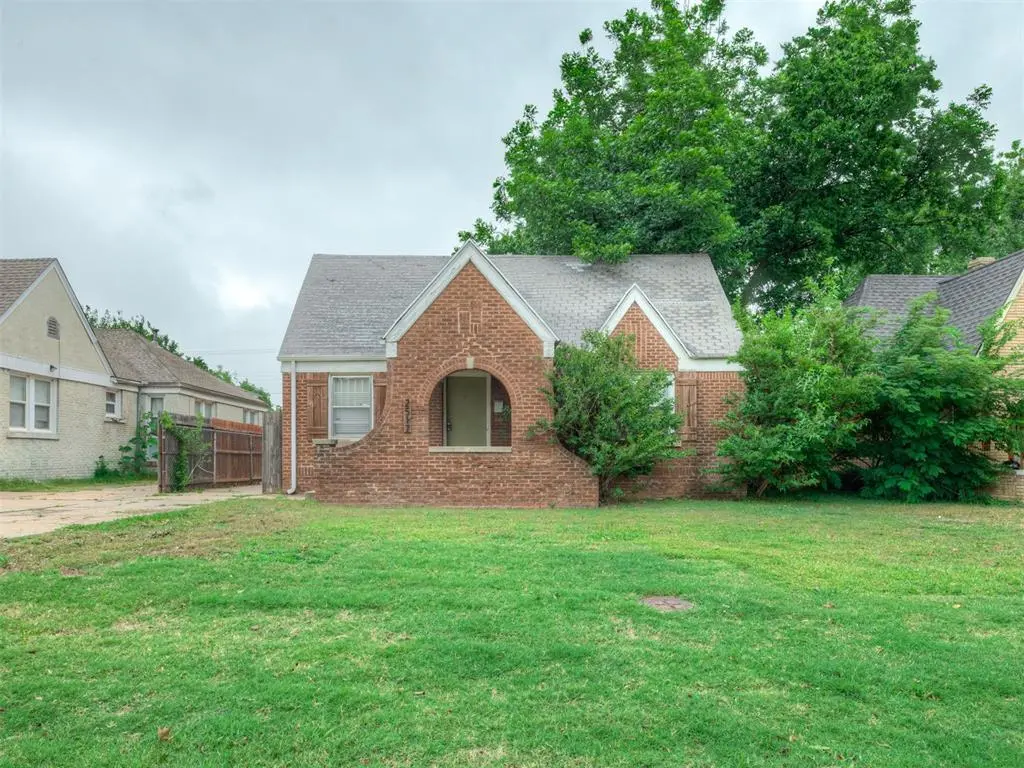
2517 NW 22nd St · Oklahoma City, OK
Flood risk 1/10 · Minimal
- FEMA flood zone
- X (unshaded)
- Chance of flooding over 30 yrs
- 0.0%
- Est. flood insurance / yr
- $507 – $1,088
Fire risk 1/10 · Minimal
- Est. fire insurance / yr
- $2,463 – $4,575
Heat risk 6/10 · Moderate
- Hot days now (above 107°F)
- 7 days/yr
- Hot days in 30 yrs
- 19 days/yr
Wind risk 2/10 · Minimal
- Chance of severe wind over 30 yrs
- 3.0%
Air-quality risk 2/10 · Minimal
- Unhealthy air days now
- 1 days/yr
- Unhealthy air days in 30 yrs
- 2 days/yr
Risk factors via First Street. Map © Google.
Why this score? — see what drove the C grade
The composite is a weighted blend of 9 inputs, each scored 0–100. Each bar is that input's sub-score; the figure is the points it added to the 100-point composite (weight × sub-score).
- Cash flow +20.6/30.0
- ARV discount +15.0/15.0
- DSCR +6.5/10.0
- 1% rule +5.0/10.0
- Rent growth +4.3/5.0
- Livability +4.0/5.0
- Condition / age +2.5/5.0
- Schools +0.7/10.0
- Appreciation +0.0/10.0
$122,500
🖨 Deal sheet 📄 Offer letter ✓ Due diligence
Listing remarks
Invest in the dynamic growth of Oklahoma City's Urban Core. This home is located in an area for redevelopment and could be the project you've been looking for! Ideally situated close to the UCO, Uptown Districts and just minutes from the Plaza, Paseo, and Midtown Districts. INVESTORS check this out!! This home is one of nine properties being sold in a trust. All nine are in a rental portfolio, two properties are occupied and all can be sold as a package. For a list of all properties see supplements. All homes are being sold in "as is" condition, seller will make no repairs. Buyer to verify all school districts.
Key facts
- Rental property
- Long term investment
- Prime location
Tags
Neighborhood map
What this means for you Summary
Snapshot
- This is a 3-bed/1.0-bath single-family listed at $122k.
Deal economics
- At list price, monthly cash flow is $163 ($2k/yr) — positive.
- The deal already cash-flows at list — no discount required.
- To meet the 1% rule (rent ≥ 1% of price), the offer needs to be $122k (0.3% below list).
- Recommended offer: $122k (0.3% below list) — sets the bar for 1% rule.
- Cap rate 7.9% vs local median 3.7% in Oklahoma City — top-decile yield for the area; either an underpriced asset or a hidden risk that comps aren't pricing in. Stress-test before assuming the spread holds.
Location & tenants
- Location reads 80/100 on livability (#3 in OK, #1,635 nationally) — a professional / high-income tenant draw. Strengths: amenities A+, commute A+, cost of living A+; Watch: crime F.
- Oklahoma City (urban): math 7% / reading 10% proficiency, ranked #254 of 270 in OK (top 94%) — low school quality limits family demand, transient renter base, plan for 1-2y turnover; 82% free/reduced lunch — lower-income household profile, screen leases tightly.
- Zoned schools: Cleveland Es (math 17% / reading 17%, grade F, #540 of 845 statewide, top 68%, 405 students, 0% FRL); Northwest Classen Hs (math 5% / reading 10%, grade F, #420 of 447 statewide, top 95%, 1,702 students, 0% FRL) — zoned schools average 0% FRL vs 82% district-wide (82 pts lower); this property's tenant base skews higher-income than the district average.
- Market conditions: Rents rising fast (+7.3%/yr); 216 active listings in the ZIP; 40 comparable units currently listed for rent nearby; rentals at typical pace (median 21d on market — plan ~3-4 weeks tenant-placement turnaround); 40% of comp listings sitting > 30 days — soft ceiling on asking rent; 5,365 units permitted in Oklahoma County in 2024 (569 in 5+ unit buildings).
Forward outlook
- Local home prices are declining (-3.0%/yr); year-one equity from $847 of loan paydown is wiped out by about $4k of value loss. Plan a longer hold.
- Oklahoma County population projected at +41% by 2050 — long-run rental-demand tailwind backs the buy-and-hold thesis.
- At projected returns (-3.0% appreciation + 7.3% rent growth), your $34k cash investment doubles in ~10 years — after that, you're playing with house money.
Negotiation context
- Only 7 days on market — expect competitive offers; lowballing is unlikely to land.
Risks & watch-outs
- Watch-outs: built in 1929 — expect roof / HVAC / electrical / plumbing capex.
- Climate carrying-cost: extreme-heat days projected 7→19/yr by 2055 (HVAC capex compounding) — expect insurance premiums to compound above CPI over the hold.
Questions for the listing agent
- Built in 1929 — when were the roof, HVAC, electrical panel, plumbing, and water heater last replaced?
- Is there a deadline driving the sale (1031 exchange, divorce, estate, relocation)? That informs how much negotiation room exists.
- Schools are F-rated, which usually means shorter tenancies and higher turnover. Who's the typical renter profile here, and what's been the actual vacancy rate?
- Crime grade is F in this area — have there been break-ins, vandalism, or insurance claims at this property in the last 3 years? What carrier currently insures it and at what premium?
- What's the average days-on-market for RENTAL listings here right now (not sales)? A rising rental-DOM trend means longer vacancies and softer asking-rent achievability than the comps imply.
- What's the recent tenant-quality profile in this submarket — average credit score on applications, eviction rate, late-payment / NSF rate, and stable-employment percentage? A property-management company in the area should have these aggregated.
- How much new for-sale + rental construction is in the pipeline within 1–3 miles? Heavy new supply typically softens prices + rents 12–24 months out; constrained supply supports both.
Investment metrics
- 1% rule
- 1.00% ✗
- Cap rate
- 7.89%
- Cash-on-cash
- 5.69%
- DSCR
- 1.25
- GRM
- 8.4
CMA / ARV
- ARV (on-the-fly)
- $168,503
- Comps found
- 12
Show comp detail 12 sales within ~0.75 mi
| Address | Dist | Beds/Ba | Sqft | Sold | Price | $/sf | Match |
|---|---|---|---|---|---|---|---|
| 2501 NW 24th St | 0.14mi | 2/1.0 (-1) | 1,071 (+6%) | 3mo | $325,000 | $303 | 76 |
| 2244 NW 20th St | 0.37mi | 2/1.0 (-1) | 1,052 (+4%) | 2mo | $176,000 | $167 | 69 |
| 2428 NW 22nd St | 0.08mi | 2/1.0 (-1) | 1,145 (+14%) | 3mo | $169,000 | $148 | 66 |
| 2509 N Cashion Pl | 0.63mi | 2/1.0 (-1) | 1,005 (-0%) | 0mo | $169,900 | $169 | 65 |
| 2543 NW 18th St | 0.30mi | 3/1.0 | 1,141 (+13%) | 3mo | $200,000 | $175 | 62 |
| 2400 NW 22nd St | 0.14mi | 2/1.0 (-1) | 1,146 (+14%) | 5mo | $165,000 | $144 | 62 |
| 2133 NW 29th St | 0.68mi | 2/1.0 (-1) | 988 (-2%) | 1mo | $143,900 | $146 | 59 |
| 2316 Cashion Pl | 0.66mi | 2/1.0 (-1) | 1,056 (+5%) | 2mo | $110,000 | $104 | 55 |
| 2410 NW 32nd St | 0.75mi | 2/1.0 (-1) | 986 (-2%) | 3mo | $190,000 | $193 | 54 |
| 2645 NW 31st St | 0.72mi | 2/1.0 (-1) | 940 (-7%) | 6mo | $149,000 | $159 | 46 |
| 2331 NW 31st St | 0.73mi | 2/1.0 (-1) | 900 (-11%) | 4mo | $160,000 | $178 | 39 |
| 2139 NW 29th St | 0.68mi | 4/2.0 (+1) | 1,152 (+14%) | 3mo | $65,000 | $56 | 33 |
Match score weights: distance 35% · size 25% · config 20% · recency 20%. Top-matched comps best support the ARV.
Projected returns pro-forma
-3.0% appreciation · 7.29% rent growth · sell at horizon
- IRR
- -3.0%
- Equity multiple
- 0.88×
- Total profit
- $-3,997
- Equity at exit
- $18,265
- IRR
- 10.8%
- Equity multiple
- 2.01×
- Total profit
- $34,476
- Equity at exit
- $10,592
Cash invested: $34,300 (down + closing). Projections, not guarantees.
Landlord ↔ Tenant lean methodology
- Overall (STATE)
- 83 Strongly Landlord-Friendly
- State Oklahoma
- 83 Strongly Landlord-Friendly · R+20
- County
- — inherits STATE
- City
- — inherits STATE
ZIP-level market 73107
- Rents YoY
- 7.3%
- Active inventory
- 216
- Price-to-rent
- 8.4×
Monthly cashflow live
- Estimated rent
- $1,221 high interval (Pro) →
- Mortgage (P&I)
- −$642
- Tax from tax record
- −$108 /mo · $1,298/yr
- Insurance
- −$51
- HOA
- −$0
- Vacancy / Maint / Mgmt
- −$256
- Net cashflow
- $163
Break-even live
UW: 25.0% down · 7.5% · 30yr · 1.5% tax · 5.0% vac · 8.0% maint · 8.0% mgmt
Financing live
Cash to close
- Down payment
- $30,625
- Closing costs
- $3,675
- Reserves months
- —
- Total cash needed
- —
Loan-product check · same deal, 3 products live
Conventional
25% down · 7.5% · 30yr
- Down + closing
- —
- Monthly P&I
- —
- Monthly cashflow
- —
- DSCR
- —
- Eligible?
- —
Personal DTI + credit; lowest rate.
DSCR
20% down · 8.5% · 30yr
- Down + closing
- —
- Monthly P&I
- —
- Monthly cashflow
- —
- DSCR
- —
- Eligible?
- —
No personal income docs; deal must DSCR.
Hard money
10% down · 12.0% · 12mo
- Down + closing
- —
- Monthly P&I
- —
- Monthly cashflow
- —
- DSCR
- —
- Eligible?
- —
Short-term bridge; refi at stabilization.
Rent comps 40 comps
| Address | Beds | Baths | Sqft | Rent | $/sqft | DOM | Units | Dist |
|---|---|---|---|---|---|---|---|---|
| 2605 NW 24th St Oklahoma City, OK | 2.0 | 1.0 | 1300 | $1,525 | $1.17 | 2d | 1 | 0.20mi |
| 2748 NW 22nd St Oklahoma City, OK | 2.0 | 1.0 | 1066 | $1,500 | $1.41 | 2d | 1 | 0.27mi |
| 2504 NW 27th St Oklahoma City, OK | 2.0 | 1.0 | 1303 | $1,450 | $1.11 | 43d | 1 | 0.32mi |
| 2236 NW 22nd St Oklahoma City, OK | 2.0 | 1.0 | 1200 | $950 | $0.79 | 21d | 1 | 0.32mi |
| 2502 NW 16th St Oklahoma City, OK | 2.0 | 1.0 | 780 | $1,100 | $1.41 | 43d | 1 | 0.43mi |
| 2854 NW 19th St Unit 2854 Oklahoma City, OK | 2.0 | 1.0 | 811 | $1,280 | $1.58 | 3d | 1 | 0.52mi |
| 2400 NW 30th St Oklahoma City, OK | 1.0–2.0 | 1.0–2.0 | 801 | $1,279 | $1.60 | 2d | 11 | 0.54mi |
| 2400 NW 30th St Oklahoma City, OK | 2.0 | 2.0 | 1078 | $1,289 | $1.20 | 43d | 1 | 0.56mi |
| 2042 NW 25th St Unit 17E Oklahoma City, OK | 2.0 | 1.0 | 725 | $750 | $1.03 | 43d | 1 | 0.58mi |
| 2030 NW 25th St Unit 4 Oklahoma City, OK | 2.0 | 1.0 | 725 | $750 | $1.03 | 43d | 1 | 0.59mi |
| 2030 NW 25th St Unit 17 Oklahoma City, OK | 2.0 | 1.0 | 725 | $750 | $1.03 | 4d | 1 | 0.59mi |
| 2030 NW 25th St Unit 1 Oklahoma City, OK | 2.0 | 1.0 | 725 | $750 | $1.03 | 43d | 1 | 0.59mi |
| 3003 NW 20th St Oklahoma City, OK | 2.0 | 1.0 | 909 | $999 | $1.10 | 43d | 1 | 0.64mi |
| 2024 NW 26th St Oklahoma City, OK | 2.0 | 1.0 | 947 | $1,099 | $1.16 | 43d | 1 | 0.64mi |
| 2132 NW 29th St Unit 2134 Oklahoma City, OK | 2.0 | 1.0 | 850 | $1,000 | $1.18 | 14d | 1 | 0.66mi |
| 2924 Pioneer St Oklahoma City, OK | 2.0 | 1.0 | 806 | $1,125 | $1.40 | 43d | 1 | 0.67mi |
| 1403 N Miller Blvd Oklahoma City, OK | 2.0 | 1.0 | 1200 | $1,100 | $0.92 | 4d | 1 | 0.68mi |
| 3000 NW 27th St Oklahoma City, OK | 2.0 | 1.0 | 967 | $1,095 | $1.13 | 11d | 1 | 0.70mi |
| 3000 NW 27th St Oklahoma City, OK | 2.0 | 1.0 | 967 | $1,095 | $1.13 | 4d | 1 | 0.70mi |
| 2937 Pioneer St Oklahoma City, OK | 4.0 | 2.5 | 1479 | $1,575 | $1.06 | 23d | 1 | 0.71mi |
| 2325 NW 12th St Unit C Oklahoma City, OK | 2.0 | 1.0 | 736 | $899 | $1.22 | 17d | 1 | 0.71mi |
| 2325 NW 12th St Unit D Oklahoma City, OK | 2.0 | 1.0 | 836 | $899 | $1.08 | 43d | 1 | 0.71mi |
| 2319 NW 12th St Unit A Oklahoma City, OK | 2.0 | 1.0 | 874 | $925 | $1.06 | 43d | 1 | 0.72mi |
| 2112 N Drexel Blvd Oklahoma City, OK | 4.0 | 2.0 | 1443 | $1,695 | $1.17 | 43d | 1 | 0.73mi |
| 2004 NW 28th St Oklahoma City, OK | 2.0 | 1.0 | 1425 | $1,195 | $0.84 | 43d | 1 | 0.76mi |
| 2525 NW 11th St Oklahoma City, OK | 3.0 | 2.0 | 1415 | $1,550 | $1.10 | 43d | 1 | 0.77mi |
| 2212 NW 31st St Oklahoma City, OK | 2.0 | 1.0 | 810 | $1,024 | $1.26 | 14d | 1 | 0.77mi |
| 2916 NW 14th St Oklahoma City, OK | 2.0 | 4.0 | 800 | $900 | $1.12 | 2d | 1 | 0.77mi |
| 3109 NW 23rd St Oklahoma City, OK | 2.0 | 1.0 | 1006 | $925 | $0.92 | 43d | 1 | 0.78mi |
| 2004 NW 15th St Oklahoma City, OK | 2.0 | 1.0 | 982 | $975 | $0.99 | 43d | 1 | 0.79mi |
| 2220 NW 32nd St Oklahoma City, OK | 2.0 | 1.0 | 850 | $1,300 | $1.53 | 21d | 1 | 0.82mi |
| 3045 Pioneer St Oklahoma City, OK | 2.0 | 1.0 | 857 | $1,050 | $1.23 | 17d | 1 | 0.83mi |
| 1207 N Ross Ave Unit 1 Oklahoma City, OK | 2.0 | 1.0 | 850 | $880 | $1.04 | 4d | 1 | 0.84mi |
| 2801 NW 11th St Oklahoma City, OK | 2.0 | 1.0 | 1100 | $1,150 | $1.05 | 14d | 1 | 0.85mi |
| 3044 NW 28th St Oklahoma City, OK | 3.0 | 1.0 | 1030 | $1,150 | $1.12 | 2d | 1 | 0.85mi |
| 2136 NW 32nd St Oklahoma City, OK | 2.0 | 1.0 | 806 | $925 | $1.15 | 21d | 1 | 0.86mi |
| 2109 NW 31st St Oklahoma City, OK | 3.0 | 1.0 | 1289 | $1,350 | $1.05 | 2d | 1 | 0.86mi |
| 3024 NW 14th St Oklahoma City, OK | 2.0 | 1.0 | 924 | $895 | $0.97 | 16d | 1 | 0.88mi |
| 3021 NW 13th St Oklahoma City, OK | 3.0 | 1.0 | 1072 | $995 | $0.93 | 23d | 1 | 0.89mi |
| 2100 NW 33rd St Oklahoma City, OK | 2.0 | 1.0 | 1004 | $1,245 | $1.24 | 2d | 1 | 0.96mi |
Listing history 8 events
-
2026-06-18days on market $122,500 Active 7 DOM
-
2026-06-17days on market $122,500 Active 6 DOM
-
2026-06-16days on market $122,500 Active 5 DOM
-
2026-06-15days on market $122,500 Active 4 DOM
-
2026-06-13pricestatusdays on market $122,500 Active 2 DOM
-
2024-08-18status Pending
-
2024-07-08$149,230 Active
-
2022-05-28price $925
ⓘ Source: listings_history table (triggers on properties + properties_extension) + one-shot
backfill from property_details.listing_events for pre-trigger history.
Tax reassessment forecast OK · Resets to sale price
- Current annual tax
- $1,298 · $108/mo
- Projected year-2 tax
- $1,298 · $108/mo
- Expected delta
- $0/yr ($0/mo · 0.0%)
ⓘ Screening estimate from a state-policy table — verify with the county assessor before closing.
Climate risk First Street
- Flood 1/10 Low FEMA zone X (unshaded) · 0% chance over 30 yrs
- Wildfire 1/10 Low
- Heat 6/10 Major 7 d/yr ≥107°F today · 19 d/yr by 30 yrs out
- Wind 2/10 Low 3% chance of damaging wind over 30 yrs
- Air quality 2/10 Low 1 unhealthy d/yr today · 2 by 30 yrs out
Nearby sold comps map
Loading sold comps map…
Walkable amenities ~0.75 mi
Loading nearby amenities…
Taxation est. · year 1
- Rental income
- $14,649
- − Mortgage interest
- −$6,862
- − Property taxes
- −$1,298
- − Insurance
- −$612
- − Repairs & maintenance
- −$1,172
- − Management
- −$1,172
- − Depreciation
- −$3,564
- Taxable loss
- −$31
- Est. tax savings @ 24.0%
- +$7
- After-tax cash flow
- $1,961/yr
For passive investors: Depreciation is non-cash, so a rental often shows a tax loss while cash-flowing — sheltering income. Rental losses are passive: they offset passive income freely, and up to $25,000/yr can offset ordinary (W-2) income if you actively participate and your MAGI is under $100k (phasing out to $0 by $150k); unused losses carry forward. On sale, claimed depreciation is recaptured at up to 25%, and gains may owe capital-gains tax (a 1031 exchange can defer both). Figures are a year-1 estimate at your 24.0% rate — not tax advice; consult a CPA.
Schools (NCES district)
- District
- Oklahoma City
- NCES district ID
- 4022770
- Math proficiency
- 7% ▼ -5.00%
- Reading proficiency
- 10% ▼ -6.00%
- Median HH income
- $35,606
- Composite
- 7.0/100
- National rank
- #9970
- State rank
- #254 of 270 in OK
Livability — Oklahoma City
- Score
- 80/100
- State rank
- #3
- US rank
- #1635
Category grades
Schools grade is shown separately in the Schools card above.
Census & demographics
- Census place
- Oklahoma City, OK
- County
- Oklahoma County · 771,644 people
- City population
- 498,656
- Metro
- Oklahoma City, OK
- Population (ZIP)
- 25,791
- Household income
- $56,873
- Rent vs Own
- Severe rent burden
- 1210.0
Population outlook (Oklahoma County) Hauer SSP2
- Today (2025)
- 911,875 people
- By 2030
- 982,413 · +7.7%
- By 2040
- 1,130,468 · +24.0%
- By 2050
- 1,288,422 · +41.3%
- By 2075
- 1,711,482 · +87.7%
- By 2100
- 2,088,448 · +129.0%
Race, ethnicity, and origin ACS 2023
- Neighborhood character
- Diverse neighborhood (Simpson 0.64)
- Race & ethnicity
- White 47% Hispanic / Latino 37% Two or more races 13% Native American 6% Black 5% Asian 2%
- Hispanic origin (detail)
- Mexican 22%
- Common ancestry
- Lithuanian 1% Italian 1% Slovak 1%
- Foreign-born
- 19% · Canada, Vietnam
- Languages at home
- 67% English-only · Spanish 30% Vietnamese 1%
Political lean MEDSL · Oklahoma
- 2024 margin
- Toss-up / Even · D 48.0% · R 49.7% · Other 2.3%
- 2008→2024 swing
- +15.1pp toward D · 2008: -16.8pp · 2024: -1.7pp
- All cycles
- 2024: R+1.7 2020: R+1.1 2016: R+10.5 2012: R+16.7 2008: R+16.8
Not yet ingested
- Civics
- —
Market trends
- HPI YoY
- ▼ -245.03%
- Current HPI
- 274.7844
- Rent YoY
- ▲ 7.29%
- Metro
- Oklahoma City, OK
- State GDP YoY
- ▲ 1.55%
- F500 in state
- 6
Industry mix (Fortune 500 HQ in OK)
| Industry | F500 HQs | Revenue |
|---|---|---|
| Energy | 3 | $48B |
|
||
Price history
3 events — show timeline
- 2024-08-18 Pending — MLSOK
- 2024-07-08 Listed $149,230 MLSOK
- 2022-05-28 Price Changed $925 RENT.
Property tax history
+4.4%/yrLatest (2025): $1,298 · +4.2% YoY. Source: county tax records.
Cash-flow waterfall
monthlySold comps — $/sqft
last 12 mo · ≤1 miLoading sold comps…