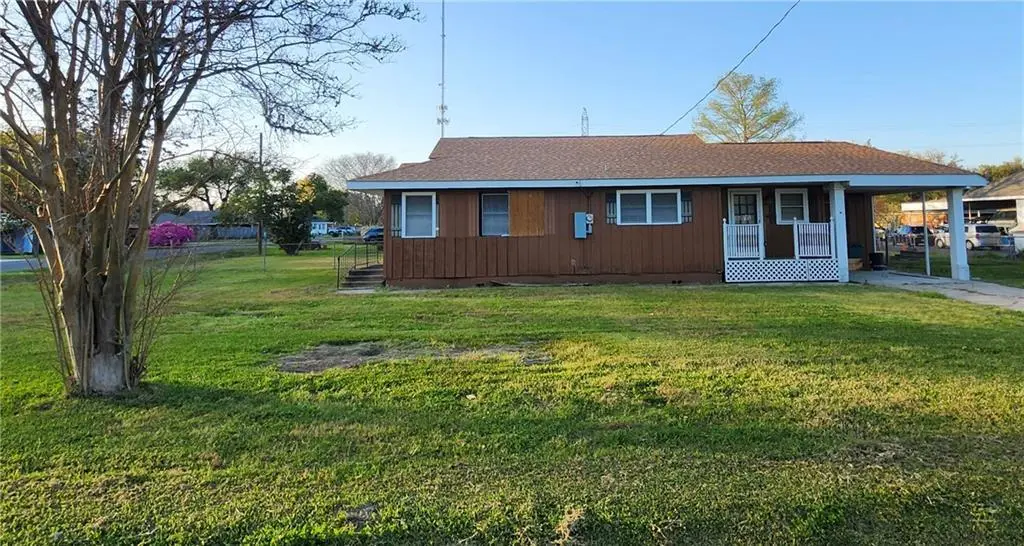
2072 Cypress St · Laplace, LA
Flood risk 1/10 · Minimal
- FEMA flood zone
- X (shaded)
- Chance of flooding over 30 yrs
- 0.0%
- Est. flood insurance / yr
- $507 – $1,088
Fire risk 1/10 · Minimal
- Est. fire insurance / yr
- $1,269 – $2,357
Heat risk 9/10 · Severe
- Hot days now (above 108°F)
- 7 days/yr
- Hot days in 30 yrs
- 21 days/yr
Wind risk 9/10 · Severe
- Chance of severe wind over 30 yrs
- 99.0%
Air-quality risk 3/10 · Minor
- Unhealthy air days now
- 2 days/yr
- Unhealthy air days in 30 yrs
- 3 days/yr
Risk factors via First Street. Map © Google.
Why this score? — see what drove the B grade
The composite is a weighted blend of 9 inputs, each scored 0–100. Each bar is that input's sub-score; the figure is the points it added to the 100-point composite (weight × sub-score).
- Cash flow +30.0/30.0
- ARV discount +15.0/15.0
- DSCR +10.0/10.0
- 1% rule +8.6/10.0
- Livability +3.5/5.0
- Rent growth +2.5/5.0
- Condition / age +2.5/5.0
- Schools +1.7/10.0
- Appreciation +0.0/10.0
$129,000
🖨 Deal sheet 📄 Offer letter ✓ Due diligence
Listing remarks MLS
3 bedroom / 2 bath home on a large corner lot featuring large living area, covered parking, and plenty of outdoor space. Interior offers a roomy kitchen with ample cabinet storage, and generously sized bedrooms. Primary bedroom has a private ensuite with updated finishes. Attached garage/workshop area includes additional storage, laundry area, and an unfinished half bath already connected. Fenced yard with plenty of space for parking or entertaining. Great opportunity - call today for a private showing!
Key facts
- Covered parking
- Large corner lot
- Roomy kitchen
Tags
Property features AI
Exterior
- Parking: Carport; Off-street parking
- Utilities: Public water; Public sewer; Electric service (standard)
- Home design: Single-story; Raised foundation; Wood siding construction; Shingle roof; Average condition
- Construction: Built with wood siding; Shingle roof; Raised foundation
- Exterior features: Fence; Front porch; Shed(s); Corner lot; City lot; Rectangular lot; Lot dimensions approximately 120 x 135 x 123 x 137
Interior
- Bathrooms: 2 full bathrooms
- Heating & cooling: Central heating; Central air conditioning
- Interior features: Ceiling fans; Pantry
- Laundry & utility: Washer hookup; Dryer hookup
Neighborhood map
What this means for you Summary
Snapshot
- This is a 3-bed/2.0-bath single-family listed at $129k.
Deal economics
- At list price, monthly cash flow is $612 ($7k/yr) — positive.
- The deal already cash-flows at list — no discount required.
- Meets the 1% rule at list price ($2k rent vs $129k).
- Recommended offer: $127k (1.5% below list) — sets the bar for market timing.
- Cap rate 12.0% vs local median 4.8% in Laplace — top-decile yield for the area; either an underpriced asset or a hidden risk that comps aren't pricing in. Stress-test before assuming the spread holds.
Location & tenants
- Location reads 70/100 on livability (#61 in LA) — a middle-class / working-renter tenant base. Strengths: cost of living A+, housing A+, health & safety A+; Watch: crime F, amenities F, commute F.
- St. John The Baptist Parish (suburban): math 13% / reading 25% proficiency, ranked #68 of 98 in LA (top 69%) — low school quality limits family demand, transient renter base, plan for 1-2y turnover; 82% free/reduced lunch — lower-income household profile, screen leases tightly.
- Market conditions: 180 active listings in the ZIP; 61 units permitted in St. John the Baptist Parish in 2024 (0 in 5+ unit buildings).
- This rent runs 31% of the median local income ($68k/yr) — at the standard rent-burdened threshold; future hikes will face affordability resistance.
Forward outlook
- Local home prices are declining (-3.0%/yr); year-one equity from $892 of loan paydown is wiped out by about $4k of value loss. Plan a longer hold.
- St. John the Baptist County population projected at -20% by 2050 — secular population decline; favor cash flow + early exit over multi-decade hold.
- At projected returns (-3.0% appreciation + 3.0% rent growth), your $36k cash investment doubles in ~6 years — after that, you're playing with house money.
Negotiation context
- It's been on market 30 days — a 2% lower offer ($127k) is reasonable based on typical stale-listing flexibility.
- 6 sale attempts with the ask held roughly flat each time — persistent listings suggest the price (not the market) is what's stuck; bring a comps-based counter.
- Current owner paid $75k; list at $129k implies a 72% gain — meaningful room to come down on a strong offer.
Risks & watch-outs
- Watch-outs: built in 1952 — expect roof / HVAC / electrical / plumbing capex.
- Climate carrying-cost: severe wind risk, 99% chance of damaging wind over 30y; extreme-heat days projected 7→21/yr by 2055 (HVAC capex compounding) — expect insurance premiums to compound above CPI over the hold.
Questions for the listing agent
- Built in 1952 — when were the roof, HVAC, electrical panel, plumbing, and water heater last replaced?
- Is there a deadline driving the sale (1031 exchange, divorce, estate, relocation)? That informs how much negotiation room exists.
- Crime grade is F in this area — have there been break-ins, vandalism, or insurance claims at this property in the last 3 years? What carrier currently insures it and at what premium?
- What's the average days-on-market for RENTAL listings here right now (not sales)? A rising rental-DOM trend means longer vacancies and softer asking-rent achievability than the comps imply.
- What's the recent tenant-quality profile in this submarket — average credit score on applications, eviction rate, late-payment / NSF rate, and stable-employment percentage? A property-management company in the area should have these aggregated.
- How much new for-sale + rental construction is in the pipeline within 1–3 miles? Heavy new supply typically softens prices + rents 12–24 months out; constrained supply supports both.
Investment metrics
- 1% rule
- 1.36% ✓
- Cap rate
- 11.98%
- Cash-on-cash
- 20.32%
- DSCR
- 1.90
- GRM
- 6.1
CMA / ARV
- ARV (median comp)
- $204,724
- List price
- $129,000
- Delta
- -19.40%
- Verdict
- UNDERPRICED
- Comps
- 20 within 1.0 mi
Show comp detail 12 sales within ~0.75 mi
| Address | Dist | Beds/Ba | Sqft | Sold | Price | $/sf | Match |
|---|---|---|---|---|---|---|---|
| 421 Birch St | 0.37mi | 3/2.0 | 1,482 (-4%) | 14mo | $75,000 | $51 | 64 |
| 225 Camellia Ave | 0.67mi | 3/2.0 | 1,572 (+2%) | 11mo | $185,000 | $118 | 56 |
| 324 Elmwood Dr | 0.68mi | 4/1.5 (+1) | 1,563 (+1%) | 4mo | $129,900 | $83 | 56 |
| 765 Madewood Dr | 0.63mi | 4/1.5 (+1) | 1,598 (+4%) | 11mo | $170,000 | $106 | 49 |
| 121 Cottage Grv | 0.62mi | 3/2.0 | 1,334 (-14%) | 12mo | $205,000 | $154 | 39 |
| 337 Elmwood Dr | 0.72mi | 4/2.0 (+1) | 1,620 (+5%) | 21mo | $169,900 | $105 | 36 |
| 1609 S Sugar Ridge Dr | 0.73mi | 3/2.0 | 1,431 (-7%) | 22mo | $220,000 | $154 | 36 |
| 308 Elmwood Dr | 0.66mi | 3/1.5 | 1,758 (+14%) | 10mo | $77,000 | $44 | 35 |
| 716 Madewood Dr | 0.58mi | 4/2.0 (+1) | 1,350 (-12%) | 16mo | $185,000 | $137 | 34 |
| 1512 Cartier Dr | 0.67mi | 3/2.0 | 1,365 (-12%) | 20mo | $104,900 | $77 | 33 |
| 1417 Meeker Loop | 0.66mi | 4/2.0 (+1) | 1,400 (-9%) | 22mo | $185,000 | $132 | 31 |
| 1527 S Sugar Ridge Rd | 0.70mi | 2/2.0 (-1) | 1,350 (-12%) | 17mo | $65,000 | $48 | 28 |
Match score weights: distance 35% · size 25% · config 20% · recency 20%. Top-matched comps best support the ARV.
Projected returns pro-forma
-3.0% appreciation · 3.0% rent growth · sell at horizon
- IRR
- 12.5%
- Equity multiple
- 1.50×
- Total profit
- $18,006
- Equity at exit
- $19,234
- IRR
- 21.4%
- Equity multiple
- 2.82×
- Total profit
- $65,660
- Equity at exit
- $11,154
Cash invested: $36,120 (down + closing). Projections, not guarantees.
Landlord ↔ Tenant lean methodology
- Overall (STATE)
- 90 Strongly Landlord-Friendly
- State Louisiana
- 90 Strongly Landlord-Friendly · R+12
- County
- — inherits STATE
- City
- — inherits STATE
ZIP-level market 70068
- Home prices YoY
- -20.1%
- Active inventory
- 180
- Price-to-rent
- 6.1×
Monthly cashflow live
- Estimated rent
- $1,757 medium interval (Pro) →
- Mortgage (P&I)
- −$676
- Tax from tax record
- −$46 /mo · $554/yr
- Insurance
- −$54
- HOA
- −$0
- Vacancy / Maint / Mgmt
- −$369
- Net cashflow
- $612
Break-even live
UW: 25.0% down · 7.5% · 30yr · 1.5% tax · 5.0% vac · 8.0% maint · 8.0% mgmt
Financing live
Cash to close
- Down payment
- $32,250
- Closing costs
- $3,870
- Reserves months
- —
- Total cash needed
- —
Loan-product check · same deal, 3 products live
Conventional
25% down · 7.5% · 30yr
- Down + closing
- —
- Monthly P&I
- —
- Monthly cashflow
- —
- DSCR
- —
- Eligible?
- —
Personal DTI + credit; lowest rate.
DSCR
20% down · 8.5% · 30yr
- Down + closing
- —
- Monthly P&I
- —
- Monthly cashflow
- —
- DSCR
- —
- Eligible?
- —
No personal income docs; deal must DSCR.
Hard money
10% down · 12.0% · 12mo
- Down + closing
- —
- Monthly P&I
- —
- Monthly cashflow
- —
- DSCR
- —
- Eligible?
- —
Short-term bridge; refi at stabilization.
Listing history 23 events
-
2026-06-19days on market $129,000 Active 30 DOM
-
2026-06-18days on market $129,000 Active 29 DOM
-
2026-06-17days on market $129,000 Active 28 DOM
-
2026-06-16days on market $129,000 Active 27 DOM
-
2026-06-15days on market $129,000 Active 26 DOM
-
2026-06-14days on market $129,000 Active 24 DOM
-
2026-06-13days on market $129,000 Active 23 DOM
-
2026-06-10days on market $129,000 Active 21 DOM
-
2026-06-09days on market $129,000 Active 20 DOM
-
2026-06-08days on market $129,000 Active 19 DOM
-
2026-06-07days on market $129,000 Active 18 DOM
-
2026-06-02days on market $129,000 Active 13 DOM
-
2026-06-01days on market $129,000 Active 12 DOM
-
2026-05-31pricedays on market $129,000 Active 11 DOM
Show marketing remark (508 chars)
3 bedroom / 2 bath home on a large corner lot featuring large living area, covered parking, and plenty of outdoor space. Interior offers a roomy kitchen with ample cabinet storage, and generously sized bedrooms. Primary bedroom has a private ensuite with updated finishes. Attached garage/workshop area includes additional storage, laundry area, and an unfinished half bath already connected. Fenced yard with plenty of space for parking or entertaining. Great opportunity - call today for a private showing!
-
2026-05-30days on market $135,000 Active 10 DOM
-
2026-05-11price $159,000
-
2026-05-11price $159,000
-
2026-04-29$165,000 Active
-
2026-04-29$165,000 Active
-
2025-05-12soldstatus $75,000 Closed
-
2025-03-24status Pending
-
2025-03-22$80,000 Active
-
2025-03-22$80,000 Active
ⓘ Source: listings_history table (triggers on properties + properties_extension) + one-shot
backfill from property_details.listing_events for pre-trigger history.
Tax reassessment forecast LA · Resets to sale price
- Current annual tax
- $554 · $46/mo
- Projected year-2 tax
- $710 · $59/mo
- Expected delta
- +$156/yr (+$13/mo · 28.1%)
ⓘ Screening estimate from a state-policy table — verify with the county assessor before closing.
Climate risk First Street
- Flood 1/10 Low FEMA zone X (shaded) · 0% chance over 30 yrs
- Wildfire 1/10 Low
- Heat 9/10 Extreme 7 d/yr ≥108°F today · 21 d/yr by 30 yrs out
- Wind 9/10 Extreme 99% chance of damaging wind over 30 yrs
- Air quality 3/10 Moderate 2 unhealthy d/yr today · 3 by 30 yrs out
Nearby sold comps map
Loading sold comps map…
Walkable amenities ~0.75 mi
Loading nearby amenities…
Taxation est. · year 1
- Rental income
- $21,084
- − Mortgage interest
- −$7,226
- − Property taxes
- −$554
- − Insurance
- −$645
- − Repairs & maintenance
- −$1,687
- − Management
- −$1,687
- − Depreciation
- −$3,753
- Taxable income
- $5,533
- Est. tax owed @ 24.0%
- −$1,328
- After-tax cash flow
- $6,012/yr
For passive investors: Depreciation is non-cash, so a rental often shows a tax loss while cash-flowing — sheltering income. Rental losses are passive: they offset passive income freely, and up to $25,000/yr can offset ordinary (W-2) income if you actively participate and your MAGI is under $100k (phasing out to $0 by $150k); unused losses carry forward. On sale, claimed depreciation is recaptured at up to 25%, and gains may owe capital-gains tax (a 1031 exchange can defer both). Figures are a year-1 estimate at your 24.0% rate — not tax advice; consult a CPA.
Schools (NCES district)
- District
- St. John The Baptist Parish
- NCES district ID
- 2201530
- Math proficiency
- 13% ▼ -42.00%
- Reading proficiency
- 25% ▼ -39.00%
- Median HH income
- $50,280
- Composite
- 17.07/100
- National rank
- #9120
- State rank
- #68 of 98 in LA
Livability — Laplace
- Score
- 70/100
- State rank
- #61
- US rank
- #7898
Category grades
Schools grade is shown separately in the Schools card above.
Census & demographics
- Census place
- Laplace, LA
- County
- Saint John the Baptist Parish · 32,720 people
- Metro
- New Orleans-Metairie, LA
- Population (ZIP)
- 32,720
- Household income
- $68,459
- Rent vs Own
- Severe rent burden
- 750.0
Population outlook (St. John the Baptist County) Hauer SSP2
- Today (2025)
- 40,972 people
- By 2030
- 39,295 · -4.1%
- By 2040
- 35,902 · -12.4%
- By 2050
- 32,988 · -19.5%
- By 2075
- 28,661 · -30.0%
- By 2100
- 26,456 · -35.4%
Race, ethnicity, and origin ACS 2023
- Neighborhood character
- Diverse neighborhood (Simpson 0.62)
- Race & ethnicity
- Black 51% White 34% Hispanic / Latino 9% Two or more races 5% Asian 1%
- Hispanic origin (detail)
- Puerto Rican 1%
- Common ancestry
- Lithuanian 11%
- Foreign-born
- 5% · Canada
- Languages at home
- 91% English-only · Spanish 6% Tagalog/Filipino 1%
Political lean MEDSL · St. John the Baptist
- 2024 margin
- Strong D (+29.1) · D 64.0% · R 34.8% · Other 1.2%
- 2008→2024 swing
- +12.9pp toward D · 2008: 16.2pp · 2024: 29.1pp
- All cycles
- 2024: D+29.1 2020: D+28.2 2016: D+24.5 2012: D+26.3 2008: D+16.2
Not yet ingested
- Civics
- —
Market trends
- HPI YoY
- ▼ -60.04%
- Current HPI
- 239.1429
- Rent YoY
- —
- Metro
- New Orleans-Metairie, LA
- State GDP YoY
- ▲ 3.29%
- F500 in state
- 10
Industry mix (Fortune 500 HQ in LA)
| Industry | F500 HQs | Revenue |
|---|---|---|
| Telecommunications | 2 | $23B |
|
||
| Utilities | 1 | $12B |
|
||
| Wholesale / Distribution | 1 | $5B |
|
||
| Advertising | 1 | $2B |
|
||
Price history
+61.3% since first listed12 events — show timeline
- 2026-05-31 Price Changed $129,000 AcadianaMLS
- 2026-05-31 Price Changed $129,000 GSREIN
- 2026-05-20 Listed $135,000 GSREIN
- 2026-05-20 Listed $135,000 AcadianaMLS
- 2026-05-11 Price Changed $159,000 AcadianaMLS
- 2026-05-11 Price Changed $159,000 GBRMLS
- 2026-04-29 Listed $165,000 GBRMLS
- 2026-04-29 Listed $165,000 AcadianaMLS
- 2025-05-12 Sold (MLS) $75,000 GSREIN
- 2025-03-24 Pending — GSREIN
- 2025-03-22 Listed $80,000 GSREIN
- 2025-03-22 Listed $80,000 AcadianaMLS
Property tax history
+0.6%/yrLatest (2021): $554 · +8.8% YoY. Source: county tax records.
Cash-flow waterfall
monthlySold comps — $/sqft
last 12 mo · ≤1 miLoading sold comps…