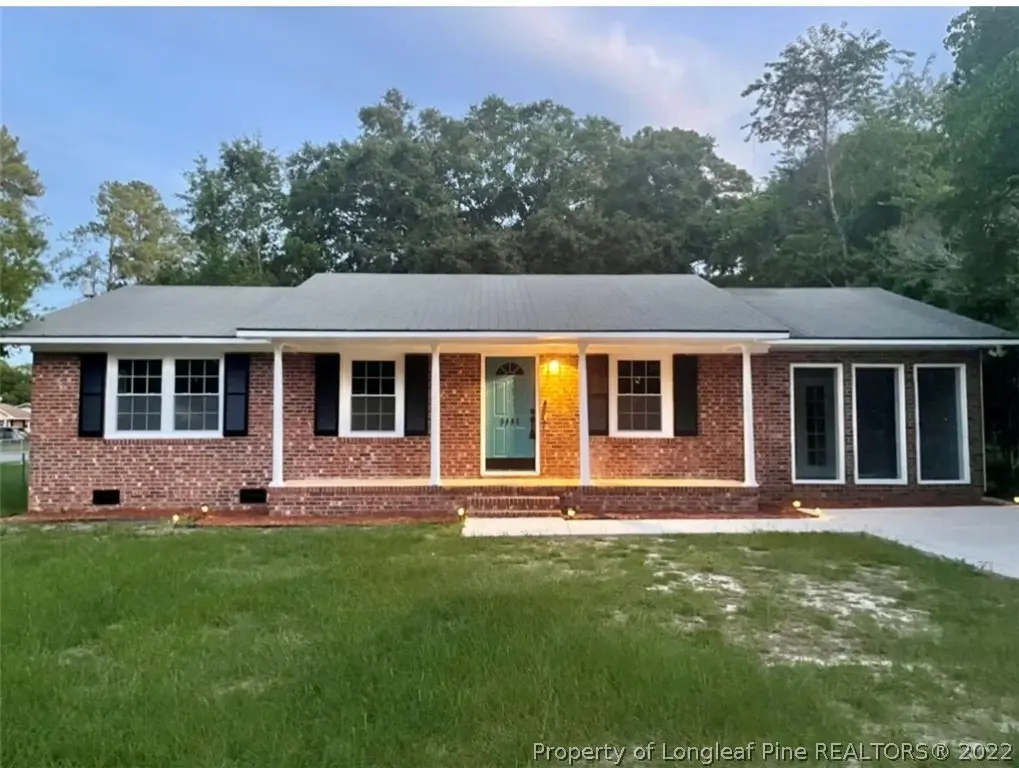
5895 Columbine Rd · Hope Mills, NC
Flood risk 1/10 · Minimal
- FEMA flood zone
- X (unshaded)
- Chance of flooding over 30 yrs
- 0.0%
- Est. flood insurance / yr
- $507 – $1,088
Fire risk 5/10 · Moderate
- Est. fire insurance / yr
- $906 – $1,684
Heat risk 7/10 · Major
- Hot days now (above 106°F)
- 7 days/yr
- Hot days in 30 yrs
- 16 days/yr
Wind risk 6/10 · Moderate
- Chance of severe wind over 30 yrs
- 74.0%
Air-quality risk 1/10 · Minimal
- Unhealthy air days now
- 0 days/yr
- Unhealthy air days in 30 yrs
- 0 days/yr
Risk factors via First Street. Map © Google.
Why this score? — see what drove the D- grade
The composite is a weighted blend of 9 inputs, each scored 0–100. Each bar is that input's sub-score; the figure is the points it added to the 100-point composite (weight × sub-score).
- Cash flow +13.1/30.0
- ARV discount +7.1/15.0
- DSCR +3.9/10.0
- Livability +3.4/5.0
- Schools +3.1/10.0
- 1% rule +2.9/10.0
- Rent growth +2.7/5.0
- Condition / age +2.5/5.0
- Appreciation +0.0/10.0
$199,999
🖨 Deal sheet (PDF) 📄 Offer letter ✓ Due diligence
Listing remarks
Must see! Full house remodel with classic real hardwood floors, tile, and carpet in office/flex room that can be used as a forth bedroom. Features a gorgeous new barn door, large laundry room, new tile in baths as well as new tile shower for owner's room, new HVAC, fenced back yard, all on huge corner lot.
Key facts
- 0.35 acre lot
- Built 1968
Neighborhood map
What this means for you Summary
Snapshot
- This is a 3-bed/2.0-bath single-family listed at $200k.
Deal economics
- At list price, monthly cash flow is $-8 ($-96/yr) — negative.
- To cash-flow at today's rent, offer at most $199k (0.7% below list).
- To meet the 1% rule (rent ≥ 1% of price), the offer needs to be $158k (20.8% below list).
- Recommended offer: $158k (20.8% below list) — sets the bar for 1% rule.
- Cap rate 6.2% vs local median 4.8% in Hope Mills — meaningfully above typical; check what's discounted (condition, days-on-market, listing class) to confirm the premium yield is real.
Location & tenants
- Location reads 67/100 on livability (#234 in NC) — a middle-class / working-renter tenant base. Strengths: cost of living A+, housing A+, health & safety B+; Watch: crime D-, amenities F, commute F.
- Cumberland County Schools (urban): math 32% / reading 41% proficiency, ranked #126 of 178 in NC (top 71%) — families likely to look elsewhere, expect single-tenant / working-renter base with shorter leases.
- Zoned schools: Cumberland Mills Elementary (math 21% / reading 31%, grade F, #1,085 of 1,410 statewide, top 77%, 572 students, 100% FRL); Douglas Byrd Middle (math 13% / reading 30%, grade F, #422 of 475 statewide, top 89%, 935 students, 100% FRL); Douglas Byrd High (math 22% / reading 42%, grade F, #445 of 535 statewide, top 84%, 940 students, 99% FRL) — zoned schools average 99% FRL vs 55% district-wide (45 pts higher); higher-poverty schools than district average — tighter screening recommended.
- Market conditions: Rents flat; 400 active listings in the ZIP; 17 comparable units currently listed for rent nearby; rentals at typical pace (median 16d on market — plan ~3-4 weeks tenant-placement turnaround); 1,125 units permitted in Cumberland County in 2024 (104 in 5+ unit buildings).
Forward outlook
- Local home prices are declining (-3.0%/yr); year-one equity from $1k of loan paydown is wiped out by about $6k of value loss. Plan a longer hold.
Negotiation context
- Only 0 days on market — expect competitive offers; lowballing is unlikely to land.
- Current owner paid $172k; 16% above their basis — modest negotiation headroom, anchor on the comps not their cost.
Risks & watch-outs
- Climate carrying-cost: major wind risk, 74% chance of damaging wind over 30y; moderate wildfire risk; extreme-heat days projected 7→16/yr by 2055 (HVAC capex compounding) — expect insurance premiums to compound above CPI over the hold.
Questions for the listing agent
- What do current leases actually rent for vs. the listed asking? Can we see a recent rent roll and the last 12 months of T-12 income?
- Built in 1968 — when were the roof, HVAC, electrical panel, plumbing, and water heater last replaced?
- Is there a deadline driving the sale (1031 exchange, divorce, estate, relocation)? That informs how much negotiation room exists.
- Schools are D-rated, which usually means shorter tenancies and higher turnover. Who's the typical renter profile here, and what's been the actual vacancy rate?
- Crime grade is D in this area — have there been break-ins, vandalism, or insurance claims at this property in the last 3 years? What carrier currently insures it and at what premium?
- The area grade is low — what's the realistic commute time and amenity access for the typical tenant pool here? Any planned neighborhood developments (good or bad) we should know about?
- What's the average days-on-market for RENTAL listings here right now (not sales)? A rising rental-DOM trend means longer vacancies and softer asking-rent achievability than the comps imply.
- What's the recent tenant-quality profile in this submarket — average credit score on applications, eviction rate, late-payment / NSF rate, and stable-employment percentage? A property-management company in the area should have these aggregated.
- How much new for-sale + rental construction is in the pipeline within 1–3 miles? Heavy new supply typically softens prices + rents 12–24 months out; constrained supply supports both.
Investment metrics
- 1% rule
- 0.79% ✗
- Cap rate
- 6.24%
- Cash-on-cash
- -0.17%
- DSCR
- 0.99
- GRM
- 10.5
CMA / ARV
- ARV (on-the-fly)
- $198,153
- Comps found
- 12
Show comp detail 12 sales within ~0.75 mi
| Address | Dist | Beds/Ba | Sqft | Sold | Price | $/sf | Match |
|---|---|---|---|---|---|---|---|
| 2613 Cameron Woods Ln | 0.46mi | 3/2.0 | 1,091 (-1%) | 10mo | $215,000 | $197 | 68 |
| 2625 Cameron Woods Ln | 0.42mi | 3/2.0 | 1,195 (+8%) | 2mo | $210,000 | $176 | 65 |
| 2928 Chillingworth Dr | 0.58mi | 3/2.0 | 1,131 (+2%) | 5mo | $209,900 | $186 | 65 |
| 5924 Lively Ct | 0.66mi | 3/2.0 | 1,104 (-0%) | 11mo | $211,995 | $192 | 60 |
| 2601 Quail Forest Dr | 0.31mi | 3/1.5 | 1,023 (-8%) | 14mo | $195,000 | $191 | 60 |
| 5931 Hotspur Pl | 0.70mi | 3/2.0 | 1,156 (+4%) | 8mo | $204,000 | $176 | 53 |
| 2916 Loon Dr | 0.49mi | 3/2.0 | 1,262 (+14%) | 4mo | $207,500 | $164 | 50 |
| 3029 Rosemeade Dr | 0.61mi | 3/2.0 | 1,253 (+13%) | 1mo | $226,500 | $181 | 48 |
| 2853 Chillingsworth Dr | 0.53mi | 3/2.0 | 1,250 (+13%) | 7mo | $220,000 | $176 | 48 |
| 2908 Rosemeade Dr | 0.60mi | 3/2.0 | 1,258 (+14%) | 3mo | $210,000 | $167 | 47 |
| 3025 Rosemeade Dr | 0.61mi | 3/2.0 | 1,261 (+14%) | 2mo | $225,000 | $178 | 47 |
| 5912 Unaka Ct | 0.62mi | 3/2.0 | 1,269 (+15%) | 5mo | $227,000 | $179 | 42 |
Match score weights: distance 35% · size 25% · config 20% · recency 20%. Top-matched comps best support the ARV.
Projected returns pro-forma
-3.0% appreciation · 0.9% rent growth · sell at horizon
- IRR
- -18.8%
- Equity multiple
- 0.35×
- Total profit
- $-36,251
- Equity at exit
- $29,821
- IRR
- -15.7%
- Equity multiple
- 0.19×
- Total profit
- $-45,337
- Equity at exit
- $17,292
Cash invested: $56,000 (down + closing). Projections, not guarantees.
Landlord ↔ Tenant lean methodology
- Overall (STATE)
- 85 Strongly Landlord-Friendly
- State North Carolina
- 85 Strongly Landlord-Friendly · R+3
- County
- — inherits STATE
- City
- — inherits STATE
ZIP-level market 28306
- Home prices YoY
- -17.7%
- Rents YoY
- 0.9%
- Active inventory
- 400
- Price-to-rent
- 10.5×
Monthly cashflow live
- Estimated rent
- $1,585 high interval (Pro) →
- Mortgage (P&I)
- −$1,049
- Tax from tax record
- −$128 /mo · $1,536/yr
- Insurance
- −$83
- HOA
- −$0
- Vacancy / Maint / Mgmt
- −$333
- Net cashflow
- $-8
Break-even live
Sensitivity live
| Price | -10% $105 | -5% $49 | +0% $-8 | +5% $-65 | +10% $-121 |
|---|---|---|---|---|---|
| Rent | -10% $-133 | -5% $-71 | +0% $-8 | +5% $55 | +10% $117 |
| Rate | -1.0pp $93 | -0.5pp $43 | base $-8 | +0.5pp $-60 | +1.0pp $-113 |
UW: 25.0% down · 7.5% · 30yr · 1.5% tax · 5.0% vac · 8.0% maint · 8.0% mgmt
Financing live
Cash to close
- Down payment
- $50,000
- Closing costs
- $6,000
- Reserves months
- —
- Total cash needed
- —
Loan-product check · same deal, 3 products live
Conventional
25% down · 7.5% · 30yr
- Down + closing
- —
- Monthly P&I
- —
- Monthly cashflow
- —
- DSCR
- —
- Eligible?
- —
Personal DTI + credit; lowest rate.
DSCR
20% down · 8.5% · 30yr
- Down + closing
- —
- Monthly P&I
- —
- Monthly cashflow
- —
- DSCR
- —
- Eligible?
- —
No personal income docs; deal must DSCR.
Hard money
10% down · 12.0% · 12mo
- Down + closing
- —
- Monthly P&I
- —
- Monthly cashflow
- —
- DSCR
- —
- Eligible?
- —
Short-term bridge; refi at stabilization.
Rent comps 17 comps
| Address | Beds | Baths | Sqft | Rent | $/sqft | DOM | Units | Dist |
|---|---|---|---|---|---|---|---|---|
| 2579 Gotts Ln Fayetteville, NC | 2.0 | 2.0 | 1200 | $1,295 | $1.08 | 23d | 1 | 0.52mi |
| 2935 Chillingworth Dr Fayetteville, NC | 3.0 | 2.0 | 1403 | $1,750 | $1.25 | 15d | 1 | 0.59mi |
| 5532 Robmont Dr Fayetteville, NC | 2.0 | 2.0 | 1301 | $1,800 | $1.38 | 15d | 1 | 0.60mi |
| 2524 Penny Dr Fayetteville, NC | 3.0 | 2.0 | 1330 | $1,400 | $1.05 | 25d | 1 | 0.72mi |
| 4615 Cumberland Rd Fayetteville, NC | 2.0 | 1.0 | 783 | $825 | $1.05 | 25d | 1 | 0.79mi |
| 3038 Walesby Dr Fayetteville, NC | 3.0 | 2.0 | 1272 | $1,650 | $1.30 | 25d | 1 | 1.04mi |
| 2543 Painters Mill Dr Fayetteville, NC | 3.0 | 2.0 | 1154 | $1,600 | $1.39 | 15d | 1 | 1.07mi |
| 2161 Bingham Dr Fayetteville, NC | 3.0 | 2.0 | 1300 | $1,325 | $1.02 | 15d | 1 | 1.10mi |
| 5595 Quietwood Pl Fayetteville, NC | 3.0 | 2.0 | 1288 | $1,395 | $1.08 | 25d | 1 | 1.15mi |
| 1514 Aristo Pl Hope Mills, NC | 2.0 | 2.0 | 1000 | $1,050 | $1.05 | 15d | 1 | 1.16mi |
| 5032 Shimmer Dr Fayetteville, NC | 4.0 | 2.0 | 1473 | $1,700 | $1.15 | 15d | 1 | 1.19mi |
| 5032 Shimmer Dr Fayetteville, NC | 4.0 | 2.0 | 1473 | $1,750 | $1.19 | 25d | 1 | 1.19mi |
| 5151 Queensdale Dr Fayetteville, NC | 3.0 | 2.0 | 1107 | $1,295 | $1.17 | 25d | 1 | 1.27mi |
| 5151 Queensdale Dr Fayetteville, NC | 3.0 | 2.0 | 1107 | $1,295 | $1.17 | 15d | 1 | 1.27mi |
| 3511 Birchfield Ct Fayetteville, NC | 2.0–3.0 | 2.0 | 1270 | $1,685 | $1.33 | 15d | 5 | 1.39mi |
| 4630 Canterbury Rd Fayetteville, NC | 3.0 | 2.0 | 1250 | $1,350 | $1.08 | 25d | 1 | 1.47mi |
| 2640 Latrobe Ave Fayetteville, NC | 1.0–3.0 | 1.0–2.0 | 1079 | $1,815 | $1.68 | 15d | 30 | 1.48mi |
Listing history 9 events
-
2023-09-01status Pending
-
2023-08-25historical
-
2022-10-05soldstatus $172,000
-
2022-08-16historical
-
2022-07-12$199,999
-
2020-12-30soldstatus $15,000
-
1996-06-25soldstatus $48,000
-
1992-06-18soldstatus $52,000
-
1987-06-22soldstatus $41,500
ⓘ Source: listings_history table (triggers on properties + properties_extension) + one-shot
backfill from property_details.listing_events for pre-trigger history.
Tax reassessment forecast NC · Resets to sale price
- Current annual tax
- $1,536 · $128/mo
- Projected year-2 tax
- $1,640 · $137/mo
- Expected delta
- +$104/yr (+$9/mo · 6.8%)
ⓘ Screening estimate from a state-policy table — verify with the county assessor before closing.
Climate risk First Street
- Flood 1/10 Low FEMA zone X (unshaded) · 0% chance over 30 yrs
- Wildfire 5/10 Major
- Heat 7/10 Severe 7 d/yr ≥106°F today · 16 d/yr by 30 yrs out
- Wind 6/10 Major 74% chance of damaging wind over 30 yrs
- Air quality 1/10 Low 0 unhealthy d/yr today · 0 by 30 yrs out
Nearby sold comps map
Loading sold comps map…
Walkable amenities ~0.75 mi
Loading nearby amenities…
Taxation est. · year 1
- Rental income
- $19,019
- − Mortgage interest
- −$11,203
- − Property taxes
- −$1,536
- − Insurance
- −$1,000
- − Repairs & maintenance
- −$1,522
- − Management
- −$1,522
- − Depreciation
- −$5,818
- Taxable loss
- −$3,581
- Est. tax savings @ 24.0%
- +$859
- After-tax cash flow
- $763/yr
For passive investors: Depreciation is non-cash, so a rental often shows a tax loss while cash-flowing — sheltering income. Rental losses are passive: they offset passive income freely, and up to $25,000/yr can offset ordinary (W-2) income if you actively participate and your MAGI is under $100k (phasing out to $0 by $150k); unused losses carry forward. On sale, claimed depreciation is recaptured at up to 25%, and gains may owe capital-gains tax (a 1031 exchange can defer both). Figures are a year-1 estimate at your 24.0% rate — not tax advice; consult a CPA.
Schools (NCES district)
- District
- Cumberland County Schools
- NCES district ID
- 3700011
- Math proficiency
- 32% ▼ -2.00%
- Reading proficiency
- 41% ▼ -1.00%
- Median HH income
- $44,168
- Composite
- 31.0/100
- National rank
- #6096
- State rank
- #126 of 178 in NC
Livability — Hope Mills
- Score
- 67/100
- State rank
- #234
- US rank
- #10761
Category grades
Schools grade is shown separately in the Schools card above.
Census & demographics
- County
- Cumberland County · 265,314 people
- City population
- 39,196
- Metro
- Fayetteville, NC
- Population (ZIP)
- 43,042
- Household income
- $67,544
- Rent vs Own
- Severe rent burden
- 1386.0
Population outlook (Cumberland County) Hauer SSP2
- Today (2025)
- 330,855 people
- By 2030
- 333,523 · +0.8%
- By 2040
- 335,583 · +1.4%
- By 2050
- 335,325 · +1.4%
- By 2075
- 342,853 · +3.6%
- By 2100
- 340,698 · +3.0%
Race, ethnicity, and origin ACS 2023
- Neighborhood character
- Diverse neighborhood (Simpson 0.68)
- Race & ethnicity
- White 44% Black 33% Hispanic / Latino 13% Two or more races 8% Asian 4% Native American 2%
- Hispanic origin (detail)
- Mexican 5% Puerto Rican 5%
- Common ancestry
- Italian 2% Slovak 1% Serbian 1%
- Foreign-born
- 8% · Canada, South Korea, Jamaica
- Languages at home
- 87% English-only · Spanish 9% Other Indo-European 1% French/Haitian/Cajun 1%
Political lean MEDSL · Cumberland
- 2024 margin
- D (+13.4) · D 56.1% · R 42.7% · Other 1.2%
- 2008→2024 swing
- -4.3pp toward R · 2008: 17.7pp · 2024: 13.4pp
- All cycles
- 2024: D+13.4 2020: D+16.6 2016: D+16.0 2012: D+19.7 2008: D+17.7
Not yet ingested
- Civics
- —
Market trends
- HPI YoY
- ▼ -51.69%
- Current HPI
- 239.7281
- Rent YoY
- ▲ 0.90%
- Metro
- Fayetteville, NC
- State GDP YoY
- ▲ 3.28%
- F500 in state
- 26
Industry mix (Fortune 500 HQ in NC)
| Industry | F500 HQs | Revenue |
|---|---|---|
| Financial Services | 2 | $213B |
|
||
| Retail | 2 | $95B |
|
||
| Industrial Conglomerate | 1 | $38B |
|
||
| Metals / Steel | 1 | $35B |
|
||
| Utilities | 1 | $30B |
|
||
| Industrial Machinery | 1 | $19B |
|
||
Price history
+314.5% since first listed9 events — show timeline
- 2023-09-01 Pending — LPRMLS
- 2023-08-25 Delisted — LPRMLS
- 2022-10-05 Sold (Public Records) $172,000 Public Records
- 2022-08-16 Delisted — LPRMLS
- 2022-07-12 Listed $199,999 LPRMLS
- 2020-12-30 Sold (Public Records) $15,000 Public Records
- 1996-06-25 Sold (Public Records) $48,000 Public Records
- 1992-06-18 Sold (Public Records) $52,000 Public Records
- 1987-06-22 Sold (Public Records) $41,500 Public Records
Property tax history
+6.8%/yrLatest (2025): $1,536 · +44.1% YoY. Source: county tax records.
Cash-flow waterfall
monthlySold comps — $/sqft
last 12 mo · ≤1 miLoading sold comps…