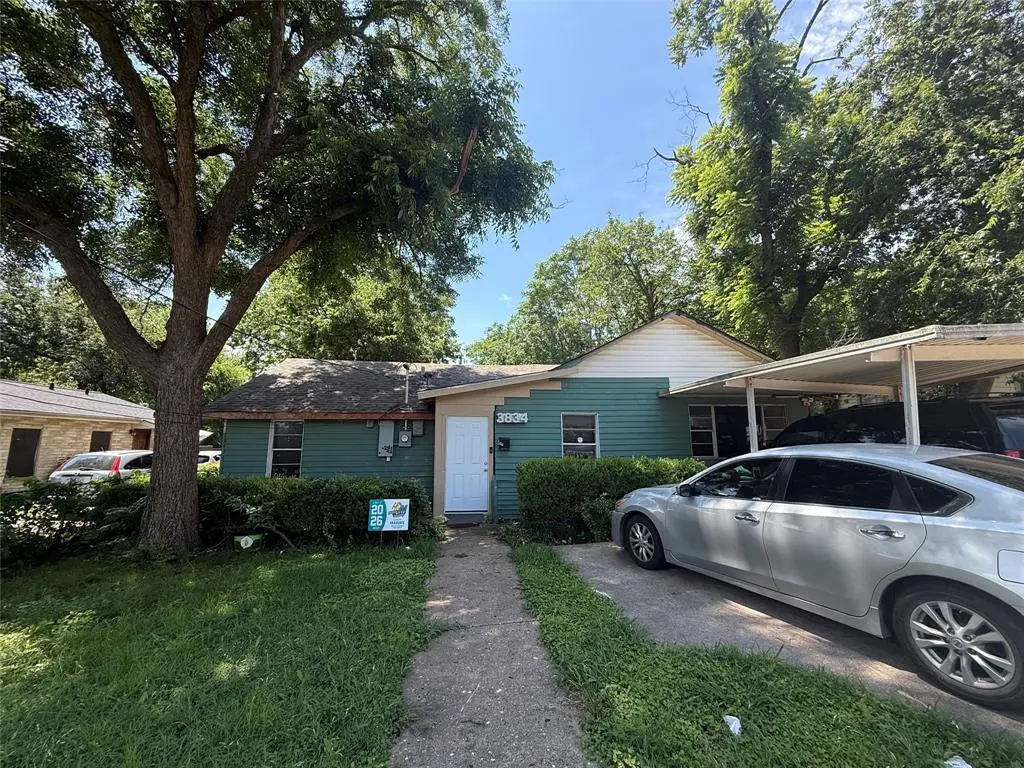
3834 Shelley Blvd · Dallas, TX
Flood risk 1/10 · Minimal
- FEMA flood zone
- X (unshaded)
- Chance of flooding over 30 yrs
- 0.0%
- Est. flood insurance / yr
- $507 – $1,088
Fire risk 1/10 · Minimal
- Est. fire insurance / yr
- $1,222 – $2,270
Heat risk 7/10 · Major
- Hot days now (above 109°F)
- 7 days/yr
- Hot days in 30 yrs
- 22 days/yr
Wind risk 6/10 · Moderate
- Chance of severe wind over 30 yrs
- 27.0%
Air-quality risk 3/10 · Minor
- Unhealthy air days now
- 2 days/yr
- Unhealthy air days in 30 yrs
- 3 days/yr
Risk factors via First Street. Map © Google.
Why this score? — see what drove the D+ grade
The composite is a weighted blend of 9 inputs, each scored 0–100. Each bar is that input's sub-score; the figure is the points it added to the 100-point composite (weight × sub-score).
- ARV discount +15.0/15.0
- Cash flow +12.9/30.0
- 1% rule +4.9/10.0
- Livability +4.0/5.0
- DSCR +3.9/10.0
- Schools +2.8/10.0
- Condition / age +2.5/5.0
- Rent growth +1.5/5.0
- Appreciation +0.0/10.0
$175,000
🖨 Deal sheet (PDF) 📄 Offer letter ✓ Due diligence
Listing remarks
SOLD AS IS WHERE IS. Tons of potential in this 3 bedroom 1 bath home with an open layout. Carport for parking and an additional building in the back that could be used as a rental or storage or a workshop. Has electric connected already. Large backyard with shed. Great location close to Bishop Arts and downtown Dallas.
Key facts
- Large backyard
- Great location
- Open layout
Tags
Property features AI
Finance
- Other: Possession available in 30–60 days
- Financial info: Listing terms: Cash; Loan type treated as clear; No second mortgage
- HOA & community: No homeowners association
Exterior
- Parking: Covered carport with 2 spaces
- Utilities: City water; City sewer; Electricity connected; Cable available; Individual gas meter; Individual water meter; Not in a municipal utility district
- Home design: Single-family residence; Residential property; One story
- Construction: Siding exterior; Built in 1938; Preowned
- Exterior features: Outbuilding, shed(s), and a workshop with electricity
Interior
- Kitchen: Gas range
- Bedrooms: 3 bedrooms (all on the main level); Primary bedroom with walk-in closet
- Flooring: Ceramic tile; Laminate
- Bathrooms: 1 full bathroom with built-in cabinets
- Heating & cooling: Central heating (electric); Central air conditioning (electric)
- Interior features: Open floorplan; High-speed internet available; One living area; One dining area; Total of 8 rooms; One level
- Laundry & utility: Laundry/utility area located in the kitchen
Neighborhood map
What this means for you Summary
Snapshot
- This is a 2-bed/1.0-bath single-family listed at $175k.
Deal economics
- At list price, monthly cash flow is $-12 ($-143/yr) — negative.
- To cash-flow at today's rent, offer at most $173k (1.2% below list).
- To meet the 1% rule (rent ≥ 1% of price), the offer needs to be $173k (0.9% below list).
- Recommended offer: $172k (1.5% below list) — sets the bar for market timing.
- Cap rate 6.2% vs local median 2.3% in Dallas — top-decile yield for the area; either an underpriced asset or a hidden risk that comps aren't pricing in. Stress-test before assuming the spread holds.
Location & tenants
- Location reads 81/100 on livability (#24 in TX, #1,380 nationally) — a professional / high-income tenant draw. Strengths: amenities A+, commute A+, housing A+; Watch: crime F.
- Dallas ISD (urban): math 31% / reading 36% proficiency, ranked #559 of 826 in TX (top 68%) — families likely to look elsewhere, expect single-tenant / working-renter base with shorter leases; 83% free/reduced lunch — lower-income household profile, screen leases tightly.
- Zoned schools: L O Donald El (math 47% / reading 47%, grade D-, #1,006 of 4,322 statewide, top 25%, 327 students, 90% FRL); Zan Wesley Holmes Jr Middle (math 22% / reading 28%, grade F, #1,258 of 1,662 statewide, top 77%, 644 students, 96% FRL); Justin F Kimball H S (math 15% / reading 24%, grade F, #1,424 of 1,632 statewide, top 88%, 1,192 students, 81% FRL).
- Market conditions: Rents falling (-3.9%/yr); 158 active listings in the ZIP; 33 comparable units currently listed for rent nearby; rentals at typical pace (median 21d on market — plan ~3-4 weeks tenant-placement turnaround); 12,577 units permitted in Dallas County in 2024 (6,829 in 5+ unit buildings).
- This rent runs 37% of the median local income ($57k/yr) — at the standard rent-burdened threshold; future hikes will face affordability resistance.
Forward outlook
- Local home prices are declining (-3.0%/yr); year-one equity from $1k of loan paydown is wiped out by about $5k of value loss. Plan a longer hold.
- Dallas County population projected at +35% by 2050 — long-run rental-demand tailwind backs the buy-and-hold thesis.
Negotiation context
- It's been on market 20 days — a 2% lower offer ($172k) is reasonable based on typical stale-listing flexibility.
Risks & watch-outs
- Watch-outs: property tax is 2.7% of price; built in 1938 — expect roof / HVAC / electrical / plumbing capex.
- Climate carrying-cost: major wind risk, 27% chance of damaging wind over 30y; extreme-heat days projected 7→22/yr by 2055 (HVAC capex compounding) — expect insurance premiums to compound above CPI over the hold.
Questions for the listing agent
- What do current leases actually rent for vs. the listed asking? Can we see a recent rent roll and the last 12 months of T-12 income?
- Built in 1938 — when were the roof, HVAC, electrical panel, plumbing, and water heater last replaced?
- Property tax is high relative to price — has the assessment been appealed recently, and will the sale trigger a re-assessment?
- Is there a deadline driving the sale (1031 exchange, divorce, estate, relocation)? That informs how much negotiation room exists.
- Crime grade is F in this area — have there been break-ins, vandalism, or insurance claims at this property in the last 3 years? What carrier currently insures it and at what premium?
- The area grade is low — what's the realistic commute time and amenity access for the typical tenant pool here? Any planned neighborhood developments (good or bad) we should know about?
- What's the average days-on-market for RENTAL listings here right now (not sales)? A rising rental-DOM trend means longer vacancies and softer asking-rent achievability than the comps imply.
- What's the recent tenant-quality profile in this submarket — average credit score on applications, eviction rate, late-payment / NSF rate, and stable-employment percentage? A property-management company in the area should have these aggregated.
- How much new for-sale + rental construction is in the pipeline within 1–3 miles? Heavy new supply typically softens prices + rents 12–24 months out; constrained supply supports both.
Investment metrics
- 1% rule
- 0.99% ✗
- Cap rate
- 6.21%
- Cash-on-cash
- -0.29%
- DSCR
- 0.99
- GRM
- 8.4
CMA / ARV
- ARV (on-the-fly)
- $246,600
- Comps found
- 12
Show comp detail 12 sales within ~0.75 mi
| Address | Dist | Beds/Ba | Sqft | Sold | Price | $/sf | Match |
|---|---|---|---|---|---|---|---|
| 3619 Falls Dr | 0.22mi | 2/1.0 | 1,147 (+5%) | 3mo | $245,000 | $214 | 79 |
| 4036 Dutton Dr | 0.27mi | 3/1.0 (+1) | 1,111 (+1%) | 5mo | $260,000 | $234 | 76 |
| 4024 Moler St | 0.23mi | 3/2.0 (+1) | 1,066 (-3%) | 5mo | $240,000 | $225 | 72 |
| 4117 Moler St | 0.31mi | 3/2.0 (+1) | 1,104 (+1%) | 10mo | $309,000 | $280 | 67 |
| 4007 Shelley Blvd | 0.12mi | 3/2.0 (+1) | 1,000 (-9%) | 6mo | $319,000 | $319 | 66 |
| 1239 Tarpley Ave | 0.30mi | 3/1.0 (+1) | 1,002 (-9%) | 4mo | $159,900 | $160 | 63 |
| 3815 Poinsettia Dr | 0.24mi | 3/2.0 (+1) | 1,256 (+15%) | 4mo | $279,900 | $223 | 52 |
| 4224 Shelley Blvd | 0.35mi | 3/1.5 (+1) | 1,237 (+13%) | 7mo | $263,000 | $213 | 49 |
| 3503 June Dr | 0.46mi | 3/1.0 (+1) | 936 (-15%) | 3mo | $175,000 | $187 | 46 |
| 3307 Dawes Dr | 0.52mi | 3/1.0 (+1) | 936 (-15%) | 3mo | $260,000 | $278 | 44 |
| 3218 Emmett St | 0.65mi | 3/2.0 (+1) | 1,198 (+9%) | 5mo | $220,000 | $184 | 41 |
| 3313 Thibet St | 0.66mi | 3/2.0 (+1) | 973 (-11%) | 6mo | $252,000 | $259 | 37 |
Match score weights: distance 35% · size 25% · config 20% · recency 20%. Top-matched comps best support the ARV.
Projected returns pro-forma
-3.0% appreciation · 0.0% rent growth · sell at horizon
- IRR
- -20.6%
- Equity multiple
- 0.30×
- Total profit
- $-34,067
- Equity at exit
- $26,093
- IRR
- -24.3%
- Equity multiple
- -0.02×
- Total profit
- $-49,743
- Equity at exit
- $15,131
Cash invested: $49,000 (down + closing). Projections, not guarantees.
Landlord ↔ Tenant lean methodology
- Overall (STATE)
- 87 Strongly Landlord-Friendly
- State Texas
- 87 Strongly Landlord-Friendly · R+5
- County
- — inherits STATE
- City
- — inherits STATE
ZIP-level market 75211
- Rents YoY
- -3.9%
- Active inventory
- 158
- Price-to-rent
- 8.4×
Monthly cashflow live
- Estimated rent
- $1,734 high interval (Pro) →
- Mortgage (P&I)
- −$918
- Tax from tax record
- −$391 /mo · $4,690/yr
- Insurance
- −$73
- HOA
- −$0
- Vacancy / Maint / Mgmt
- −$364
- Net cashflow
- $-12
Break-even live
Sensitivity live
| Price | -10% $87 | -5% $38 | +0% $-12 | +5% $-61 | +10% $-111 |
|---|---|---|---|---|---|
| Rent | -10% $-149 | -5% $-80 | +0% $-12 | +5% $57 | +10% $125 |
| Rate | -1.0pp $76 | -0.5pp $33 | base $-12 | +0.5pp $-57 | +1.0pp $-103 |
UW: 25.0% down · 7.5% · 30yr · 1.5% tax · 5.0% vac · 8.0% maint · 8.0% mgmt
Financing live
Cash to close
- Down payment
- $43,750
- Closing costs
- $5,250
- Reserves months
- —
- Total cash needed
- —
Loan-product check · same deal, 3 products live
Conventional
25% down · 7.5% · 30yr
- Down + closing
- —
- Monthly P&I
- —
- Monthly cashflow
- —
- DSCR
- —
- Eligible?
- —
Personal DTI + credit; lowest rate.
DSCR
20% down · 8.5% · 30yr
- Down + closing
- —
- Monthly P&I
- —
- Monthly cashflow
- —
- DSCR
- —
- Eligible?
- —
No personal income docs; deal must DSCR.
Hard money
10% down · 12.0% · 12mo
- Down + closing
- —
- Monthly P&I
- —
- Monthly cashflow
- —
- DSCR
- —
- Eligible?
- —
Short-term bridge; refi at stabilization.
Rent comps 33 comps
| Address | Beds | Baths | Sqft | Rent | $/sqft | DOM | Units | Dist |
|---|---|---|---|---|---|---|---|---|
| 4002 Falls Dr Dallas, TX | 3.0 | 2.0 | 1078 | $2,000 | $1.86 | 8d | 1 | 0.18mi |
| 1104 S Gilpin Ave Dallas, TX | 2.0 | 1.0 | 820 | $1,450 | $1.77 | 46d | 1 | 0.47mi |
| 4126 Kernack St Dallas, TX | 2.0 | 1.0 | 799 | $1,400 | $1.75 | 26d | 1 | 0.48mi |
| 3414 June Dr Dallas, TX | 2.0 | 1.0 | 980 | $1,750 | $1.79 | 45d | 1 | 0.52mi |
| 1123 Sunnyside St Unit B Dallas, TX | 2.0 | 1.0 | 918 | $1,050 | $1.14 | 9d | 1 | 0.56mi |
| 3228 Emmett St Dallas, TX | 3.0 | 1.0 | 1000 | $2,000 | $2.00 | 7d | 1 | 0.60mi |
| 3323 W Clarendon Dr Dallas, TX | 2.0 | 1.0 | 720 | $1,850 | $2.57 | 5d | 1 | 0.67mi |
| 3564 Virginia Blvd Dallas, TX | 3.0 | 2.0 | 1327 | $2,150 | $1.62 | 26d | 1 | 0.80mi |
| 3564 Virginia Blvd Dallas, TX | 3.0 | 2.0 | 1327 | $2,000 | $1.51 | 9d | 1 | 0.80mi |
| 637 Coombs Creek Dr Dallas, TX | 2.0 | 1.0 | 1270 | $1,650 | $1.30 | 45d | 1 | 0.84mi |
| 2855 Sharon St Dallas, TX | 2.0 | 2.0 | 836 | $2,000 | $2.39 | 5d | 1 | 0.86mi |
| 3310 Brooklyndell Ave Dallas, TX | 3.0 | 2.0 | 1400 | $2,300 | $1.64 | 45d | 1 | 0.88mi |
| 500 Andrews Ave Dallas, TX | 2.0 | 1.5 | 840 | $1,249 | $1.49 | 26d | 1 | 0.89mi |
| 500 Andrews Ave Dallas, TX | 2.0 | 1.0 | 792 | $1,256 | $1.59 | 5d | 1 | 0.89mi |
| 4646 Ridgepoint Dr Dallas, TX | 3.0 | 1.5 | 1300 | $1,850 | $1.42 | 20d | 1 | 0.93mi |
| 404 Andrews Ave Dallas, TX | 1.0–2.0 | 1.0 | 642 | $1,256 | $1.96 | 5d | 16 | 0.93mi |
| 400 Andrews Ave Dallas, TX | 2.0 | 1.0 | 722 | $999 | $1.38 | 5d | 1 | 0.96mi |
| 400 Andrews Ave Dallas, TX | 2.0 | 1.0 | 722 | $1,250 | $1.73 | 45d | 1 | 0.96mi |
| 3727 Meredith Ave Dallas, TX | 3.0 | 2.0 | 1386 | $2,100 | $1.52 | 26d | 1 | 1.01mi |
| 2925 Spruce Valley Ln Unit 403 Dallas, TX | 3.0 | 2.0 | 1477 | $2,500 | $1.69 | 22d | 1 | 1.09mi |
| 2925 Spruce Valley Ln Unit 302 Dallas, TX | 2.0 | 2.0 | 1266 | $2,300 | $1.82 | 22d | 1 | 1.09mi |
| 2736 Rolinda Dr Dallas, TX | 3.0 | 2.0 | 1250 | $2,150 | $1.72 | 8d | 1 | 1.10mi |
| 2715 Grafton Ave Dallas, TX | 3.0 | 2.0 | 1403 | $2,650 | $1.89 | 45d | 1 | 1.11mi |
| 4520 Wyoming St Dallas, TX | 3.0 | 1.0 | 1250 | $1,750 | $1.40 | 26d | 1 | 1.14mi |
| 3911 Orlando Ct Dallas, TX | 2.0 | 1.0 | 792 | $1,649 | $2.08 | 45d | 1 | 1.14mi |
| 2859 W Brooklyn Ave Dallas, TX | 3.0 | 2.0 | 1430 | $2,950 | $2.06 | 45d | 1 | 1.15mi |
| 2706 Emmett St Dallas, TX | 1.0 | 1.0 | 700 | $1,297 | $1.85 | 8d | 1 | 1.16mi |
| 4311 Division St Unit 102 Dallas, TX | 2.0 | 1.0 | 750 | $1,300 | $1.73 | 45d | 1 | 1.27mi |
| 2849 W 12th St Dallas, TX | 2.0 | 1.0 | 1115 | $1,825 | $1.64 | 8d | 1 | 1.29mi |
| 2730 Gladstone Dr Dallas, TX | 3.0 | 2.0 | 1466 | $2,000 | $1.36 | 6d | 1 | 1.34mi |
| 2607 Clearview Cir Dallas, TX | 3.0 | 1.5 | 1486 | $1,950 | $1.31 | 9d | 1 | 1.37mi |
| 1016 Matamoros Plz Dallas, TX | 3.0 | 2.5 | 1323 | $1,980 | $1.50 | 0d | 1 | 1.38mi |
| 2626 Duncanville Rd Dallas, TX | 1.0–2.0 | 1.0–2.0 | 805 | $1,400 | $1.74 | 1d | 17 | 1.42mi |
Listing history 13 events
-
2026-06-21days on market $175,000 Active 20 DOM
-
2026-06-18days on market $175,000 Active 17 DOM
-
2026-06-17days on market $175,000 Active 16 DOM
-
2026-06-16days on market $175,000 Active 15 DOM
-
2026-06-15days on market $175,000 Active 14 DOM
-
2026-06-13days on market $175,000 Active 12 DOM
-
2026-06-09days on market $175,000 Active 8 DOM
-
2026-06-08days on market $175,000 Active 7 DOM
-
2026-06-07days on market $175,000 Active 6 DOM
-
2026-06-04days on market $175,000 Active 3 DOM
-
2026-06-03days on market $175,000 Active 2 DOM
-
2026-06-02remarks 320-char remark
-
2026-06-02$175,000 Active 1 DOM
ⓘ Source: listings_history table (triggers on properties + properties_extension) + one-shot
backfill from property_details.listing_events for pre-trigger history.
Tax reassessment forecast TX · Resets to sale price
- Current annual tax
- $4,690 · $391/mo
- Projected year-2 tax
- $4,690 · $391/mo
- Expected delta
- $0/yr ($0/mo · 0.0%)
ⓘ Screening estimate from a state-policy table — verify with the county assessor before closing.
Climate risk First Street
- Flood 1/10 Low FEMA zone X (unshaded) · 0% chance over 30 yrs
- Wildfire 1/10 Low
- Heat 7/10 Severe 7 d/yr ≥109°F today · 22 d/yr by 30 yrs out
- Wind 6/10 Major 27% chance of damaging wind over 30 yrs
- Air quality 3/10 Moderate 2 unhealthy d/yr today · 3 by 30 yrs out
Nearby sold comps map
Loading sold comps map…
Walkable amenities ~0.75 mi
Loading nearby amenities…
Taxation est. · year 1
- Rental income
- $20,802
- − Mortgage interest
- −$9,803
- − Property taxes
- −$4,690
- − Insurance
- −$875
- − Repairs & maintenance
- −$1,664
- − Management
- −$1,664
- − Depreciation
- −$5,091
- Taxable loss
- −$2,984
- Est. tax savings @ 24.0%
- +$716
- After-tax cash flow
- $573/yr
For passive investors: Depreciation is non-cash, so a rental often shows a tax loss while cash-flowing — sheltering income. Rental losses are passive: they offset passive income freely, and up to $25,000/yr can offset ordinary (W-2) income if you actively participate and your MAGI is under $100k (phasing out to $0 by $150k); unused losses carry forward. On sale, claimed depreciation is recaptured at up to 25%, and gains may owe capital-gains tax (a 1031 exchange can defer both). Figures are a year-1 estimate at your 24.0% rate — not tax advice; consult a CPA.
Schools (NCES district)
- District
- Dallas ISD
- NCES district ID
- 4816230
- Math proficiency
- 31% ▼ -16.00%
- Reading proficiency
- 36% ▼ -4.00%
- Median HH income
- $42,881
- Composite
- 28.41/100
- National rank
- #6763
- State rank
- #559 of 826 in TX
Livability — Dallas
- Score
- 81/100
- State rank
- #24
- US rank
- #1380
Category grades
Schools grade is shown separately in the Schools card above.
Census & demographics
- Census place
- Dallas, TX
- County
- Dallas County · 2,612,404 people
- City population
- 1,168,437
- Metro
- Dallas-Fort Worth-Arlington, TX
- Population (ZIP)
- 73,534
- Household income
- $56,807
- Rent vs Own
- Severe rent burden
- 2585.0
Population outlook (Dallas County) Hauer SSP2
- Today (2025)
- 2,979,839 people
- By 2030
- 3,191,823 · +7.1%
- By 2040
- 3,619,611 · +21.5%
- By 2050
- 4,026,915 · +35.1%
- By 2075
- 4,957,073 · +66.4%
- By 2100
- 5,508,725 · +84.9%
Race, ethnicity, and origin ACS 2023
- Neighborhood character
- Predominantly Hispanic (79%)
- Race & ethnicity
- Hispanic / Latino 79% Two or more races 24% White 10% Black 9% Native American 2%
- Hispanic origin (detail)
- Mexican 69%
- Foreign-born
- 32% · Canada
- Languages at home
- 32% English-only · Spanish 67%
Political lean MEDSL · Dallas
- 2024 margin
- Strong D (+22.2) · D 60.2% · R 38.0% · Other 1.8%
- 2008→2024 swing
- +6.9pp toward D · 2008: 15.3pp · 2024: 22.2pp
- All cycles
- 2024: D+22.2 2020: D+31.6 2016: D+26.2 2012: D+15.4 2008: D+15.3
Not yet ingested
- Civics
- —
Market trends
- HPI YoY
- ▼ -233.57%
- Current HPI
- 343.4166
- Rent YoY
- ▼ -3.89%
- Metro
- Dallas-Fort Worth-Arlington, TX
- State GDP YoY
- ▲ 3.95%
- F500 in state
- 110
Industry mix (Fortune 500 HQ in TX)
| Industry | F500 HQs | Revenue |
|---|---|---|
| Energy | 16 | $1,198B |
|
||
| Technology | 5 | $198B |
|
||
| Engineering / Construction | 4 | $72B |
|
||
| Energy Services | 3 | $60B |
|
||
| Utilities | 3 | $41B |
|
||
| Healthcare | 2 | $330B |
|
||
Price history
2 events — show timeline
- 2026-06-01 Listed $175,000 NTREIS
- 2021-08-10 Sold (Public Records) — Public Records
Property tax history
+7.2%/yrLatest (2025): $4,690 · -2.8% YoY. Source: county tax records.
Cash-flow waterfall
monthlySold comps — $/sqft
last 12 mo · ≤1 miLoading sold comps…